. 2021 Feb 2;12(1):735.
doi: 10.1038/s41467-021-20964-4.

Plasma membrane H+-ATPase overexpression increases rice yield via simultaneous enhancement of nutrient uptake and photosynthesis

Affiliations

Plasma membrane H+-ATPase overexpression increases rice yield via simultaneous enhancement of nutrient uptake and photosynthesis

Maoxing Zhang et al. Nat Commun. .

Abstract

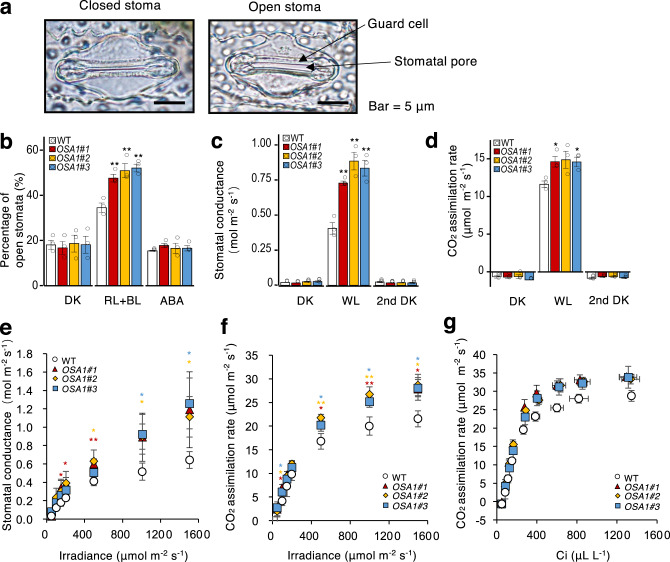
Nitrogen (N) and carbon (C) are essential elements for plant growth and crop yield. Thus, improved N and C utilisation contributes to agricultural productivity and reduces the need for fertilisation. In the present study, we find that overexpression of a single rice gene, Oryza sativa plasma membrane (PM) H+-ATPase 1 (OSA1), facilitates ammonium absorption and assimilation in roots and enhanced light-induced stomatal opening with higher photosynthesis rate in leaves. As a result, OSA1 overexpression in rice plants causes a 33% increase in grain yield and a 46% increase in N use efficiency overall. As PM H+-ATPase is highly conserved in plants, these findings indicate that the manipulation of PM H+-ATPase could cooperatively improve N and C utilisation, potentially providing a vital tool for food security and sustainable agriculture.


Conflict of interest statement

The authors declare no competing interests.

Figures

Fig. 1
Fig. 1. Plasma membrane (PM) H+-ATPase regulates ammonium (NH4+) uptake in rice.
a 15NH4+ absorption rate in wild-type (WT) rice. To determine 15NH4+ absorption rates, rice seedlings were incubated in 2 mM 15NH4+ solution with 5 μM fusicoccin (FC) for 30 min under dark or illuminated conditions. b Average transpiration rates of rice leaves under dark and illuminated conditions over 30 min. Small circles in a, b represent data points for individual experiments; three biological replicates were analysed for each treatment. Columns and error bars in a, b represent the means ± standard errors (SEs; n = 3). Differences were evaluated using the two-tailed Student’s t test (*P < 0.05; ***P < 0.005; n.s., not significant). The exact P values are 0.0018 (mock in dark vs. FC in dark), 0.0025 (mock in dark vs. mock in light), 0.0143 (mock in light vs. FC in light) and 0.0016 (FC in dark vs. FC in light) for (a); 0.8194 (mock in dark vs. FC in dark), 0.0006 (mock in dark vs. mock in light), 0.0851 (mock in light vs. FC in light), and 4.27 × 10−5 (FC in dark vs. FC in light) for (b). n.s. Not significant.
Fig. 2
Fig. 2. OSA1 overexpression promotes nitrogen (N) and carbon (C) uptake in rice.
a Phenotypes of 4-week-old WT and OSA1-overexpressing (ox) plants. b Dry weights of WT and OSA1-ox plants. c Relative OSA1 expression levels in WT and OSA1-ox plants. d Relative PM H+-ATPase protein levels in WT and OSA1-ox plants. e Hydrolytic activity of PM H+-ATPase in WT and OSA1-ox plants. f 15NH4+ absorption rates in the roots of WT and OSA1-ox plants under different NH4+ concentrations. To determine 15NH4+ absorption rates, seedlings were incubated with 0.5–8 mM 15NH4+ for 5 min to reflect the net uptake rate. g, h Total N and C levels in WT and OSA1-ox plants. Plants were grown hydroponically in a greenhouse for 4 weeks. Small circles in b–h represent data points for individual experiments; three biological replicates were analysed for each treatment. Values in b–h are presented as the means ±  SEs (n = 3). Differences were evaluated using the two-tailed Student’s t test (*P < 0.05; **P < 0.01). The exact P values are provided in the Source Data file.
Fig. 3
Fig. 3. osa1 mutant plants exhibit lower N uptake and decreased C content.
a Phenotypes of WT and osa1 plants (scale = 10 cm). b Root and shoot dry weights of WT plants and osa1 mutants. c Relative expression levels of OSA1 in the roots and leaves of WT plants and osa1 mutants. d Relative PM H+-ATPase protein levels in the roots and leaves of WT plants and osa1 mutants. e ATP hydrolytic activity of PM H+-ATPase in WT plants and osa1 mutants. f 15NH4+ absorption rates in the roots of WT plants and osa1 mutants under different NH4+ concentrations. The 15NH4+ absorption rate was determined after seedlings were incubated with 0.5–8 mM 15NH4+ for 5 min. g, h Total N and C levels in roots and leaves of WT plants and osa1 mutants. Plants were grown hydroponically in a greenhouse for 4 weeks; small circles in b–h represent data points for individual experiments; three biological replicates were analysed for each treatment. Values in b–h are presented as the means ± SEs (n = 3). Differences were evaluated using the two-tailed Student’s t test (*P < 0.05; **P < 0.01). The exact P values are provided in the Source Data file.
Fig. 4
Fig. 4. Stomatal and photosynthetic properties of OSA1-ox plants.
a Representative stomata in the epidermis of WT plants. Experiments were repeated three occasions with similar results. b Percentage of open stomata observed after 3 h of darkness (DK), red light plus blue light (RL + BL) or RL + BL in the presence of 20 μΜ abscisic acid (ABA) in WT and OSA1-ox plants (for the details see the “Methods” section). c, d Stomatal conductance (c) and CO2 assimilation rate under (d) DK (30 min), white light (WL; 2 h) and a second DK treatment (30 min) in WT and OSA1-ox plants. e, f Stomatal conductance (e) and CO2 assimilation rate (f) in response to light in WT and OSA1-ox plants. g Relationship between CO2 assimilation rate and intercellular CO2 concentration in WT and OSA1-ox plants. Small circles in b–d represent data points for individual experiments; three biological replicates were analysed for each treatment. Values in b–d are presented as the means ± SEs (n = 3) and those in e–g are the means ± SDs (n = 3). Differences were evaluated using the two-tailed Student’s t test (*P < 0.05; **P < 0.01). The exact P values are provided in the Source Data file.
Fig. 5
Fig. 5. Differentially expressed genes (DEGs) enrichment caused by the modification of OSA1 in rice.
a Venn diagram representing overlapping upregulated genes in OSA1-ox and downregulated genes in the osa1-2 mutant (osa1) in roots and leaves (false discovery rate [FDR] < 0.05). b Heat map of the DEGs. Significant genes in response to N, C metabolism and ion transport are listed (FDR < 0.05). c–h Relative expression of N metabolism-related genes in WT and OSA1-ox roots (c–f) and leaves (c, g, h). Plants were grown hydroponically in a greenhouse for 4 weeks. Small circles in c–h represent data points for individual experiments; three biological replicates were analysed for each treatment. Columns and error bars in c–h represent the means ± SEs (n = 3). Differences were evaluated using the two-tailed Student’s t test (*P < 0.05; **P < 0.01). The exact P values are provided in the Source Data file.
Fig. 6
Fig. 6. Overexpression of OSA1 increases grain yield and N use efficiency (NUE) in the field.
a–d Photographs of 100-day-old WT and OSA1-ox plants in the field (a), in pots in the field (b) and harvested panicles (c) and spikelets (d) in 2017 in northern Nanjing under 200 kg N ha−1 (M–N) fertilisation. e Grain yield, f panicle weight per plant, g panicles per hill and h spikelets per panicle of WT and OSA1-ox plants in field tests at three locations (n ≥ 6). i Relative agronomic NUE in WT and OSA1-ox plants in field tests under low (L–N; 100 kg N ha−1), moderate (M–N; 200 kg N ha−1) or high (H–N; 300 kg N ha−1) levels of N fertilisation. Columns and error bars represent the means ± SEs (n = 3). j Grain yield of WT and OSA1-ox plants in field tests under different N conditions. Black asterisks represent significant differences between WT and OSA1-ox plants under the same N fertilisation level; small circles in e–h, j represent data points of collected samples in individual experiments (n = 6 in 2017 Nanjing-N and n = 8 in 2016 Nanjing-S and 2017 Fengyang). Centre line indicates the median, upper and lower bounds represent the 75th and the 25th percentile, respectively. Whiskers indicate the minimum and the maximum in the box plots (e–h, j). Differences were evaluated using the two-tailed Student’s t test (*P < 0.05; **P < 0.01; n.s., not significant). The exact P values are provided in the Source Data file.

Similar articles

Cited by

References

    1. Marschner, P. Marschner’s Mineral Nutrition of Higher Plants (Elsevier, 2012).
    1. Smil V. Detonator of the population explosion. Nature. 1999;400:415. doi: 10.1038/22672. - DOI
    1. Omar P, Aula L, Oyebiyi F, Raun WR. World cereal nitrogen use efficiency trends: review and current knowledge. Agrosyst. Geosci. Environ. 2019;2:180045.
    1. Stevens CJ. Nitrogen in the environment. Science. 2019;363:578–580. doi: 10.1126/science.aav8215. - DOI - PubMed
    1. Kimball BA. Crop responses to elevated CO2 and interactions with H2O, N, and temperature. Curr. Opin. Plant Biol. 2016;31:36–43. doi: 10.1016/j.pbi.2016.03.006. - DOI - PubMed

Publication types

MeSH terms