. 2021 Jan 10;12(5):1563-1574.
doi: 10.7150/jca.54252. eCollection 2021.

Metabolomics study reveals the potential evidence of metabolic reprogramming towards the Warburg effect in precancerous lesions

Affiliations

Metabolomics study reveals the potential evidence of metabolic reprogramming towards the Warburg effect in precancerous lesions

Xun Chen et al. J Cancer. .

Abstract

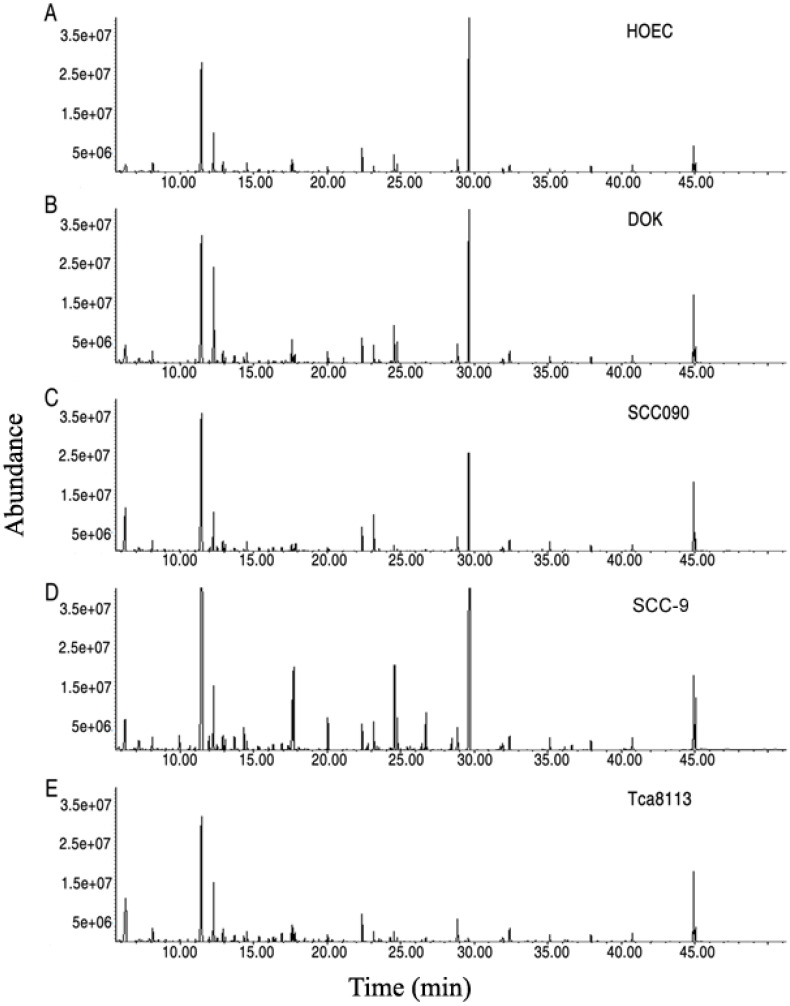
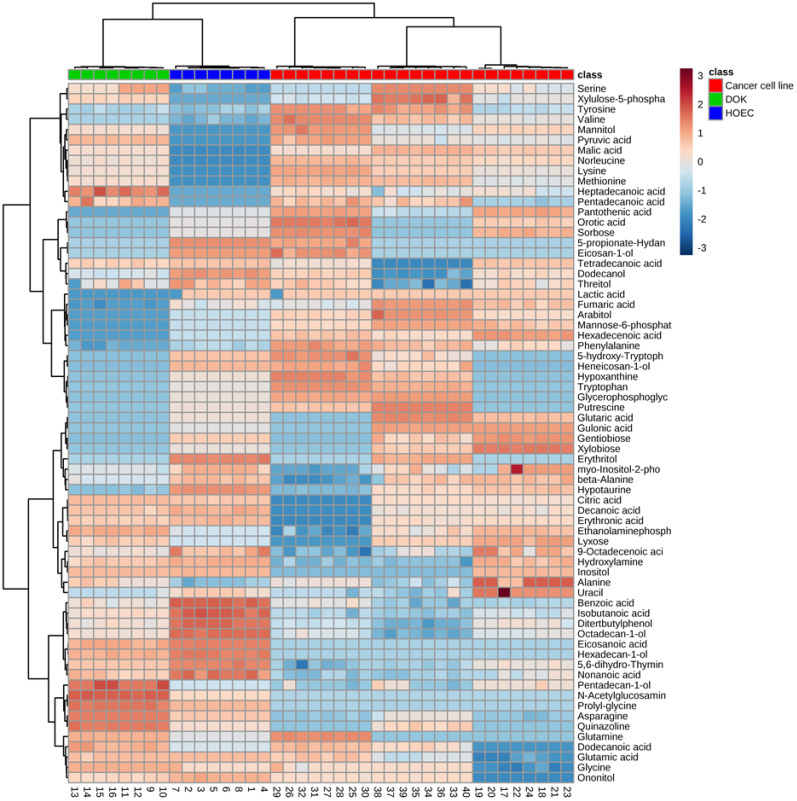
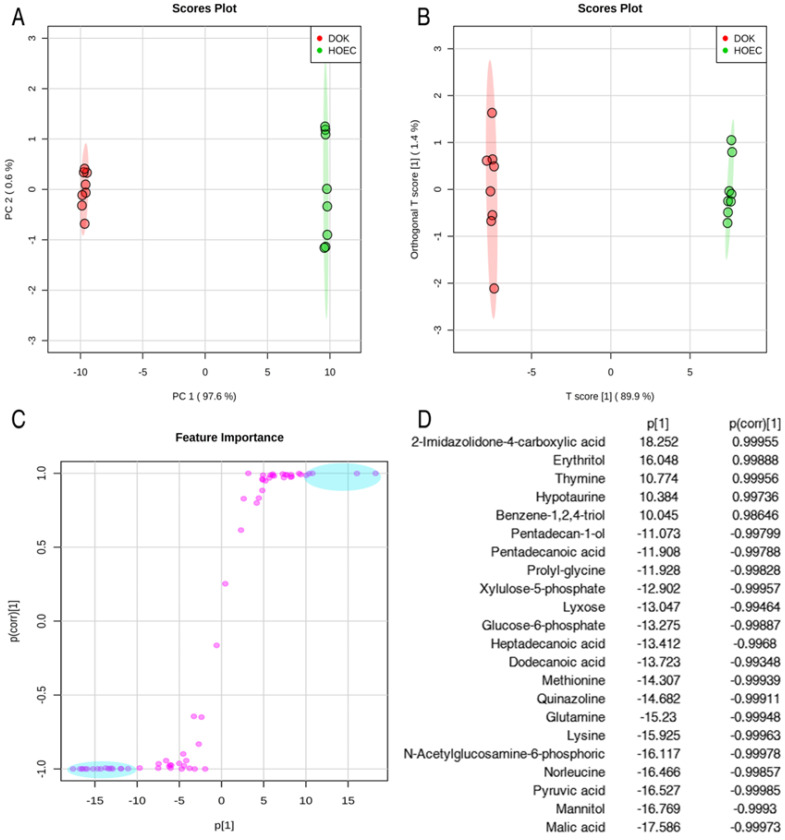
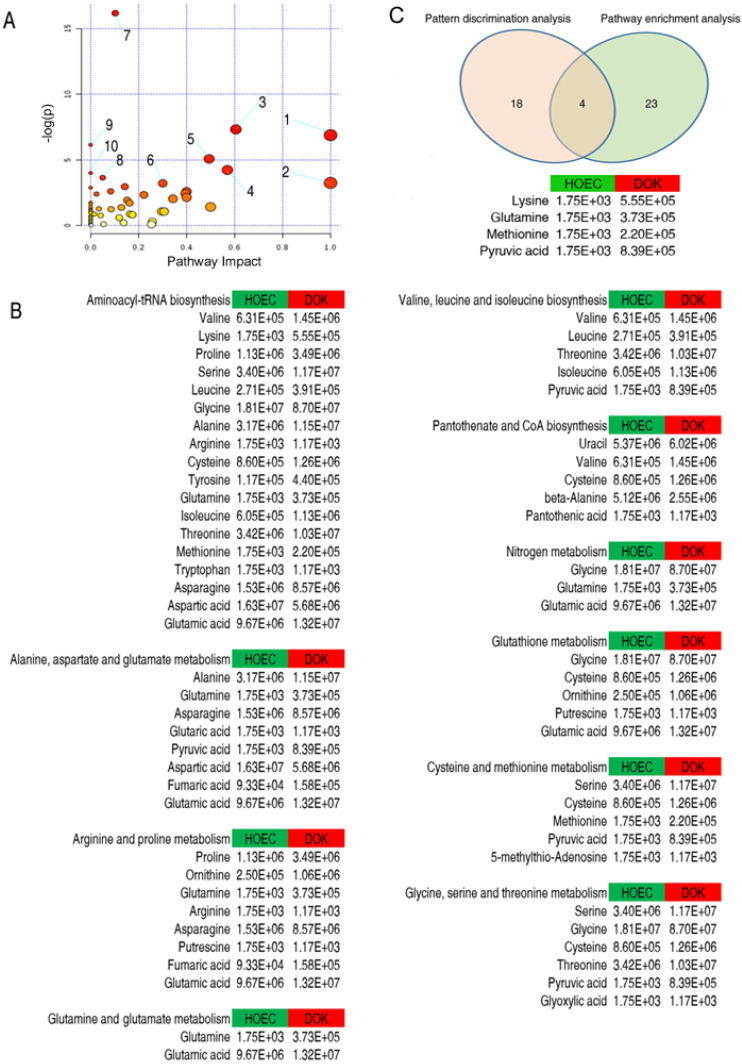
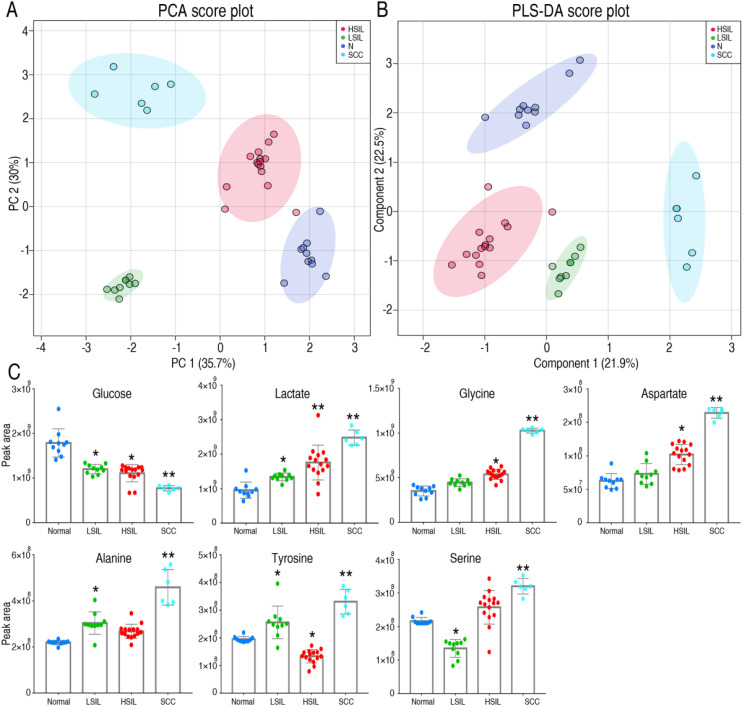
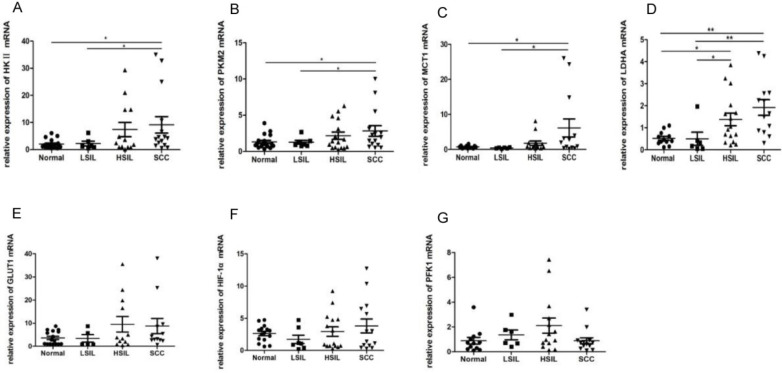
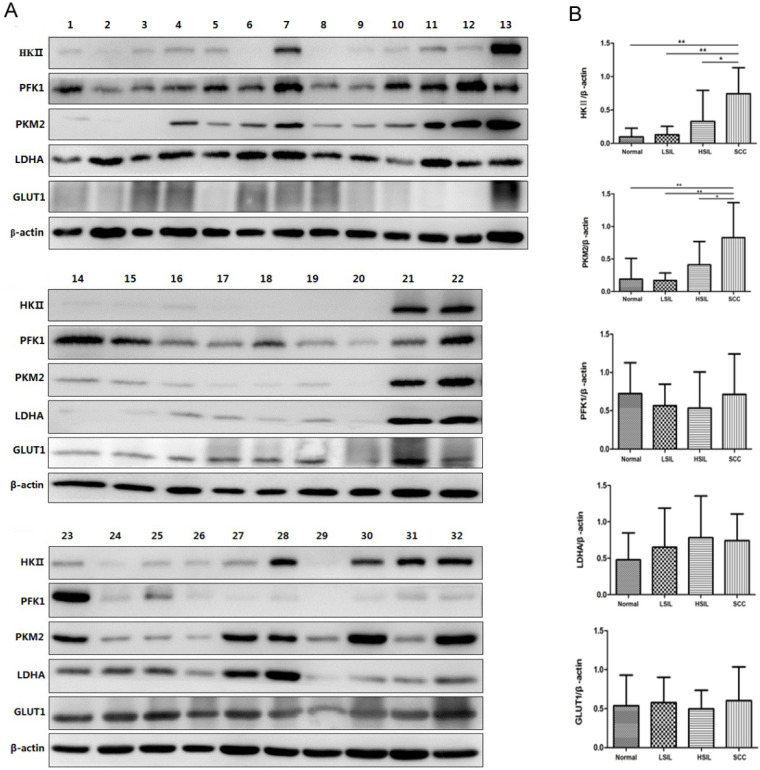
Background: Most tumors have an enhanced glycolysis flux, even when oxygen is available, called the aerobic glycolysis or the Warburg effect. Metabolic reprogramming promotes cancer progression, and is even related to the tumorigenesis. However, it is not clear whether the observed metabolic changes act as a driver or a bystander in cancer development. Methods: In this study, the metabolic characteristics of oral precancerous cells and cervical precancerous lesions were analyzed by metabolomics, and the expression of glycolytic enzymes in cervical precancerous lesions was evaluated by RT-PCR and Western blot analysis. Results: In total, 115 and 23 metabolites with reliable signals were identified in oral cells and cervical tissues, respectively. Based on the metabolome, oral precancerous cell DOK could be clearly separated from normal human oral epithelial cells (HOEC) and oral cancer cells. Four critical differential metabolites (pyruvate, glutamine, methionine and lysine) were identified between DOK and HOEC. Metabolic profiles could clearly distinguish cervical precancerous lesions from normal cervical epithelium and cervical cancer. Compared with normal cervical epithelium, the glucose consumption and lactate production increased in cervical precancerous lesions. The expression of glycolytic enzymes LDHA, HK II and PKM2 showed an increased tendency in cervical precancerous lesions compared with normal cervical epithelium. Conclusions: Our findings suggest that cell metabolism may be reprogrammed at the early stage of tumorigenesis, implying the contribution of metabolic reprogramming to the development of tumor.

Keywords: glycolytic enzymes; metabolic reprogramming; metabolomics; precancerous lesions; the Warburg-like effect.


Conflict of interest statement

Competing Interests: The authors have declared that no competing interest exists.

Figures

Figure 1
Figure 1
Metabolomics profiles of oral cell lines HOEC, DOK, SCC090, SCC-9 and Tca8113. Representative total ion current chromatograms are shown (A-E). X-axis, retention time (min); Y-axis, abundance.
Figure 2
Figure 2
Differential metabolomics profiles of normal human oral epithelial cells (HOEC), dysplastic oral keratinocyte (DOK) and oral cancer cell lines SCC090, SCC9 and Tca8113. The heatmap shows 73 differential metabolites. Wine red and pewter indicate increased and decreased metabolites relative to the median metabolite levels, respectively (see color scale).
Figure 3
Figure 3
Identification of metabolomic candidates. PCA analysis of metabolites of HOEC and DOK cells (A). Each dot represents the technological replicate analysis of samples in the plot. PC1 and PC2 used in this plot explain 98.2% of the total variance, which allows for confident interpretation of the variation. Orthogonal partial least squares discriminant analysis (OPLS-DA, R2X=0.899, R2Y=0.999, Q2=0.999) (B). Score plot drawn with OPLS-DA (C). The crucial metabolomic candidates, shown in the light blue oval box (C), were selected by the weight absolute values of p and p(corr), which are more than 10 and 0.9, respectively (D).
Figure 4
Figure 4
Enrichment analysis of metabolic pathways and its combination with pattern discrimination analysis. Significantly enriched pathways were selected to be plotted (A). From 1 to 10 represent glutamine and glutamate metabolism; valine, leucine and isoleucine biosynthesis; alanine, aspartate and glutamate metabolism; glycine, serine and threonine metabolism; arginine and proline metabolism; cysteine and methionine metabolism; aminoacyl-tRNA biosynthesis; glutathione metabolism; pantothenate and CoA biosynthesis; and nitrogen metabolism, respectively. The relative abundance of each metabolite is shown (B). Integration of metabolite pathway enrichment analysis and pattern discrimination analysis identified 4 crucial differential biomarkers responsible for the phenotype of DOK (C).
Figure 5
Figure 5
Metabolomics characteristics of cervical epithelial tissues. PCA and PLS-DA completely separated cervical precancerous lesions (HSIL and LSIL) from normal cervical epithelial tissues (N, Normal) and cervical cancer tissues (SCC) (A and B). Levels of several key metabolites in different cervical tissues were detected by GC-MS (C). LSIL, low-grade squamous intraepithelial lesions; HSIL, high-grade squamous intraepithelial lesions. *P < 0.05 vs Normal and **P < 0.01 vs Normal.
Figure 6
Figure 6
RT-PCR was used to detect the expression of HK II, PKM2, LDHA, MCT1, GLUT1, HIF-1α and PFK1 in cervical biopsies, including 15 normal cervical epithelial tissues, 6 low-grade squamous intraepithelial lesions (LSIL), 14 high-grade squamous intraepithelial lesions (HSIL) and 13 squamous cell carcinomas (SCC). *P < 0.05, **P < 0.01.
Figure 7
Figure 7
Expression of HK II, PFK1, PKM2, LDHA and GLUT1 in cervical biopsies was detected by Western blot analysis. In total, 32 biopsies were examined, including normal cervical tissues (samples 1, 2, 3, 14, 15, 16, 17, 23, 24), LSIL (samples 4, 5, 6, 18, 19, 25, 26), HSIL (samples 7, 8, 9, 10, 20, 27, 28, 29) and SCC (samples 11, 12, 13, 21, 22, 30, 31, 32) (A). The relative expression of HK II, PFK1, PKM2, LDHA and GLUT1 was normalized by β-actin (B). *P < 0.05, **P < 0.01.

Similar articles

Cited by

References

    1. Pavlova NN, Thompson CB. The Emerging Hallmarks of Cancer Metabolism. Cell Metab. 2016;23:27–47. - PMC - PubMed
    1. Yu L, Chen X, Sun XQ, Wang LT, Chen SW. The Glycolytic Switch in Tumors: How Many Players Are Involved? J Cancer. 2017;8:3430–40. - PMC - PubMed
    1. Warburg O, Wind F, Negelein E. The Metabolism of Tumors in the Body. J Gen Physiol. 1927;8:519–30. - PMC - PubMed
    1. Vander Heiden MG, Cantley LC, Thompson CB. Understanding the Warburg effect: the metabolic requirements of cell proliferation. Science. 2009;324:1029–33. - PMC - PubMed
    1. Chen X, Zhao Y. Human papillomavirus infection in oral potentially malignant disorders and cancer. Arch Oral Biol. 2017;83:334–9. - PubMed