

Opioid Prescription Patterns for Discharged Patients from the Emergency Department
- PMID: 33532010
- PMCID: PMC7837768
- DOI: 10.1155/2021/4980170
Opioid Prescription Patterns for Discharged Patients from the Emergency Department
Abstract
Objectives: It is important to analyze the types of etiologies and provider demographics that drive opioid prescription in our emergency departments. Our study aimed to determine which patients in the ED are receiving opioid prescriptions, as well as their strength and quantity. Secondary outcomes included identifying difference in prescribing between provider classes.
Methods: We conducted a retrospective study at a tertiary care university-based, level-one trauma ED from November 2017 to October 2018. We identified and analyzed data from 2,259 patients who were sent home with an opioid prescription. We retrieved patient and provider demographics, diagnosis, etiologies, and prescription information.
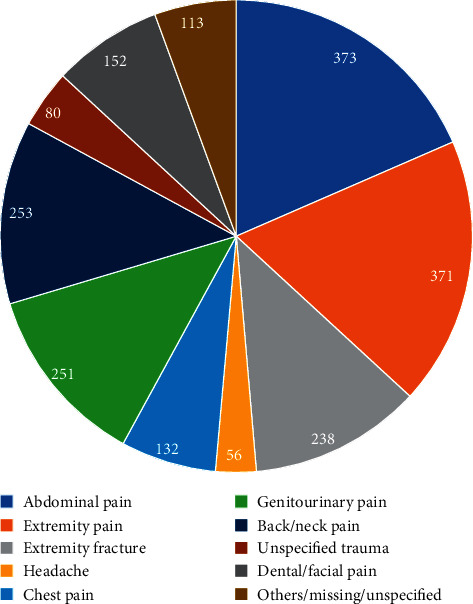
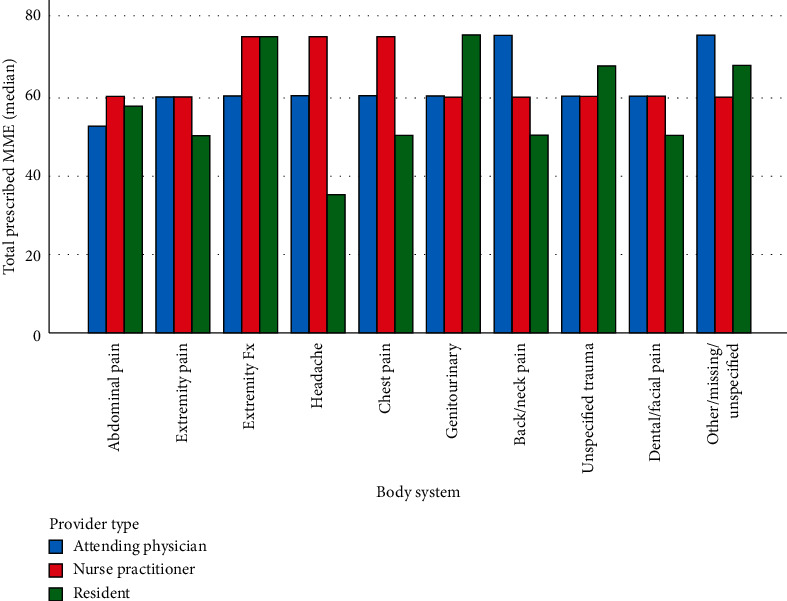
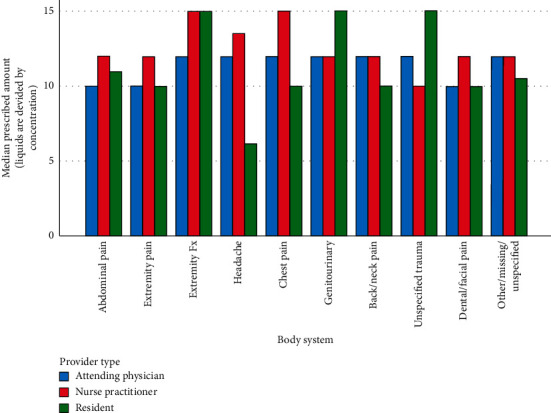
Results: The mean age of a patient receiving an opioid prescription was 45, and 72.7% of patients were white. The most common diagnosis groups associated with an opioid prescription were abdominal pain (18.5%), nonfracture extremity pain (18.4%), and back/neck pain (12.5%). Hydrocodone-acetaminophen 5-325 mg was the most commonly prescribed (67.4%). The median total prescribed milligram morphine equivalent (MME) was highest for extremity fracture (75.0; IQR 54.0-100.0). The median total prescribed amount of pills was highest for patients with extremity fractures (15.0; IQR 12.0-20.0).
Conclusions: Our study elucidates the prescribing patterns of an academic level 1 trauma center and should pave the way for future studies looking to maximize effectiveness at ways to curb ED opioid prescription.
Copyright © 2021 Justin Yanuck et al.
Conflict of interest statement
The authors declare that they have no conflicts of interest.
Figures
References
-
- Warner M., Chen L. H., Makuc D. M., Anderson R. N, Miniño A. M. Drug poisoning deaths in the United States, 1980-2008. NCHS Data Briefs. 2011;81:1–8. - PubMed
-
- National Institute on Drug Abuse. America’s addiction to opioids: heroin and prescription drug abuse. 2016. http://www.drugabuse.gov/about-nida/legislative-activities/testimony-to-....
-
- Centers for Disease Control and Prevention. Vital signs: overdoses of prescription opioid pain relievers—United States, 1999—2008. Morbidity and Mortality Weekly Report. 2011;60(43):1487–1492. - PubMed
MeSH terms
Substances
LinkOut - more resources
Full Text Sources
Other Literature Sources
Miscellaneous
