

Decitabine Downregulates TIGAR to Induce Apoptosis and Autophagy in Myeloid Leukemia Cells
- PMID: 33532040
- PMCID: PMC7836025
- DOI: 10.1155/2021/8877460
Decitabine Downregulates TIGAR to Induce Apoptosis and Autophagy in Myeloid Leukemia Cells
Abstract
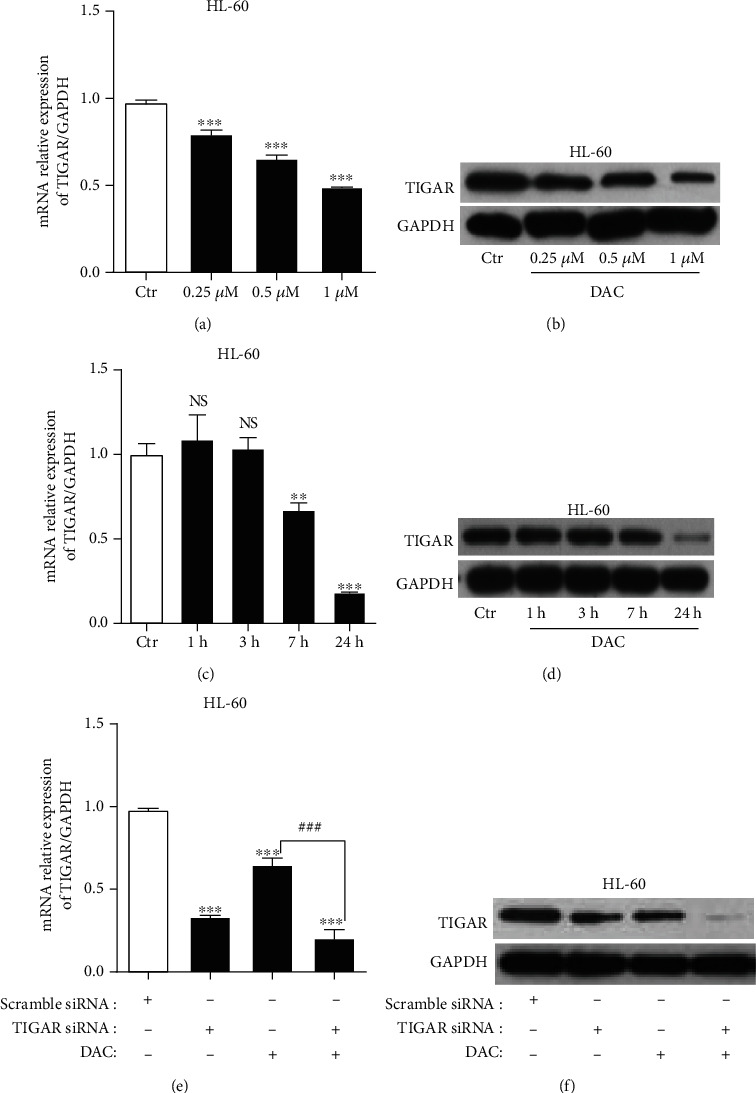
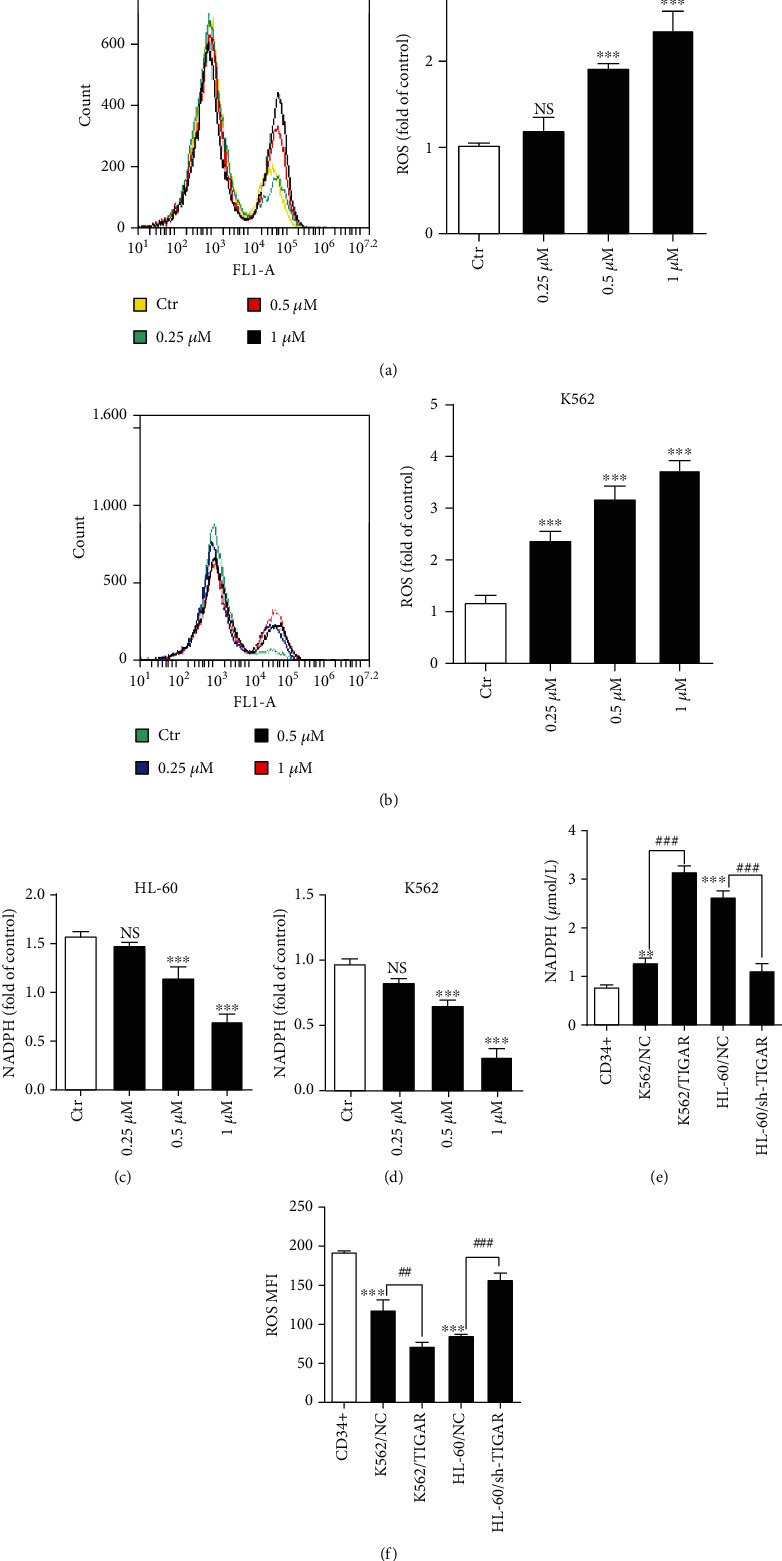
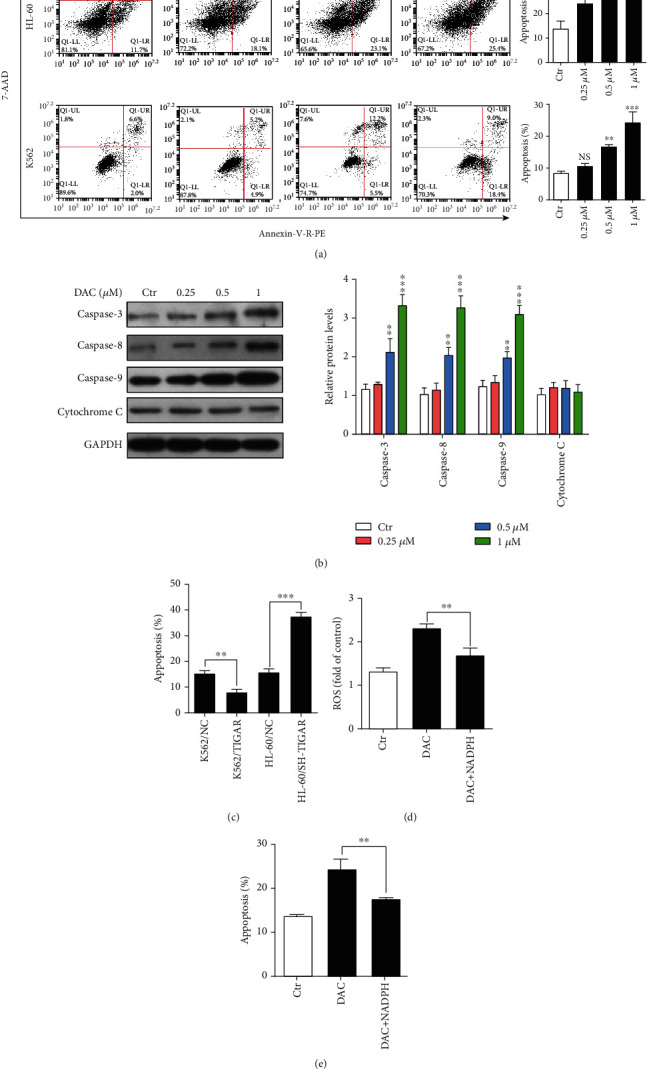
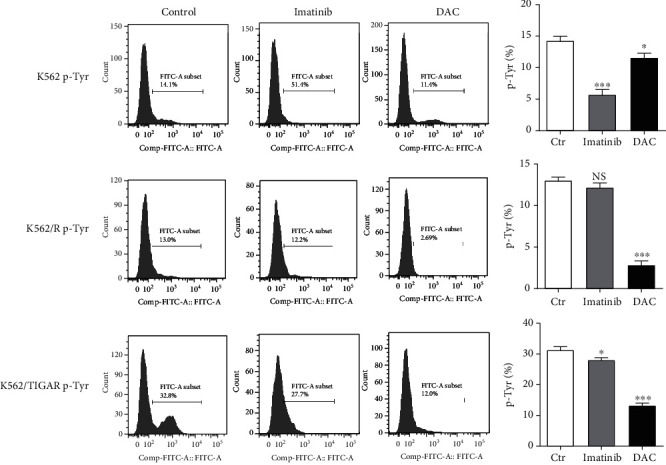
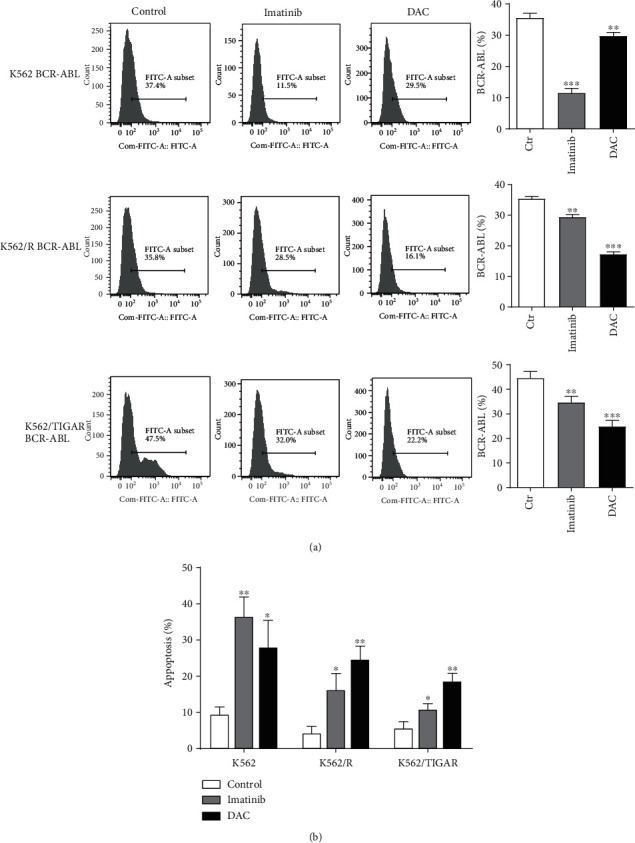
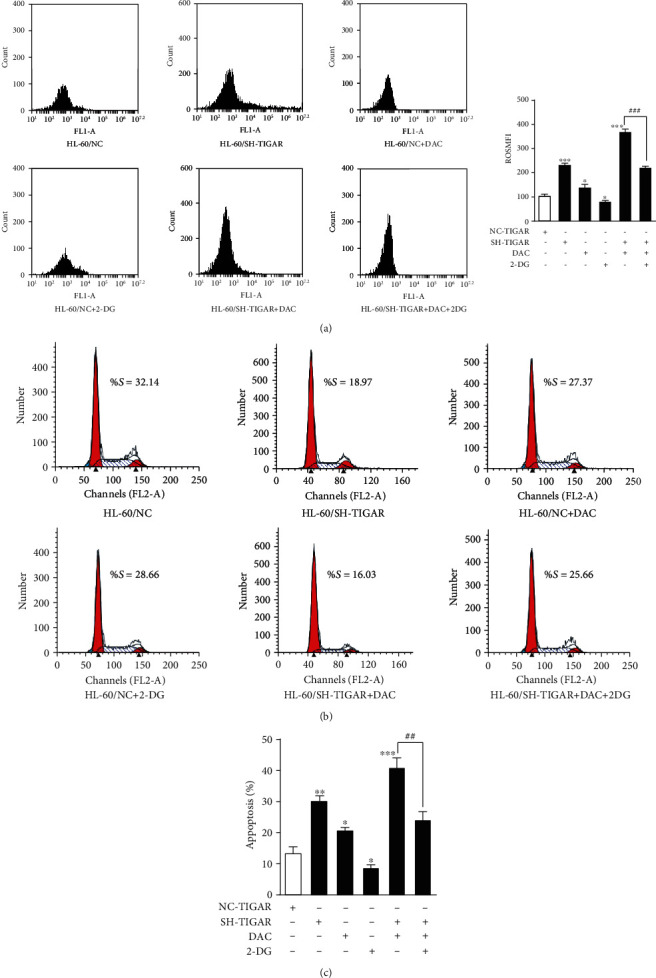
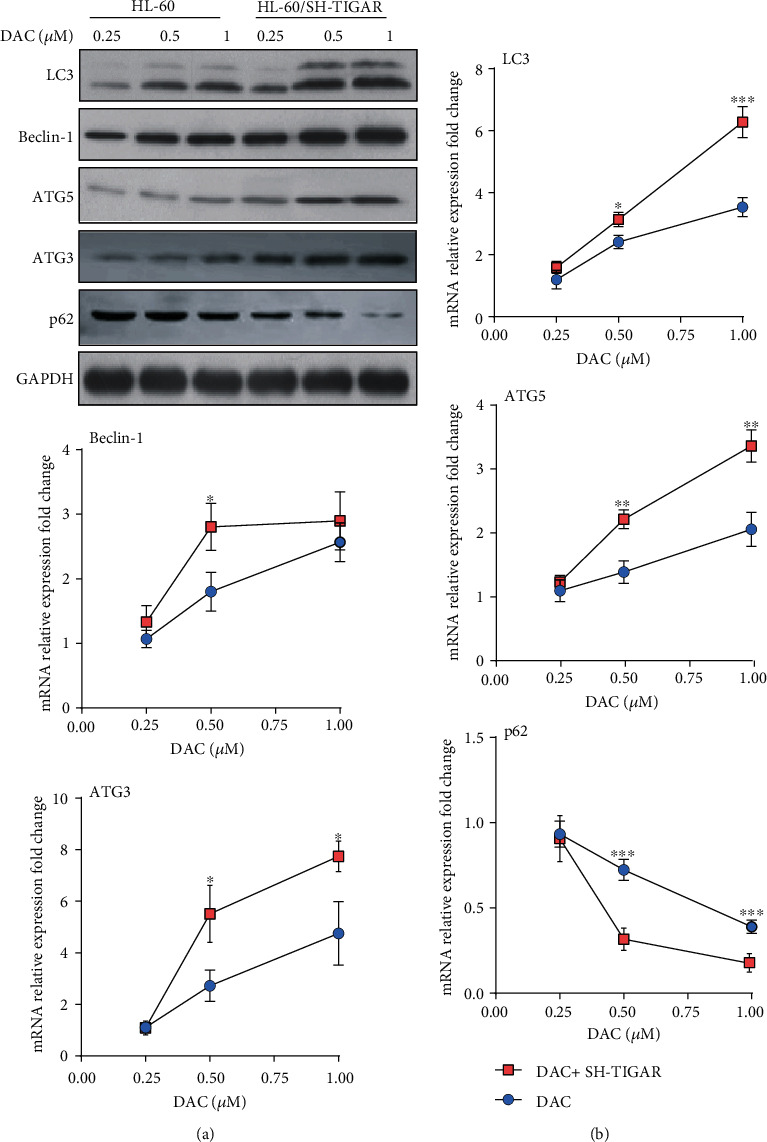
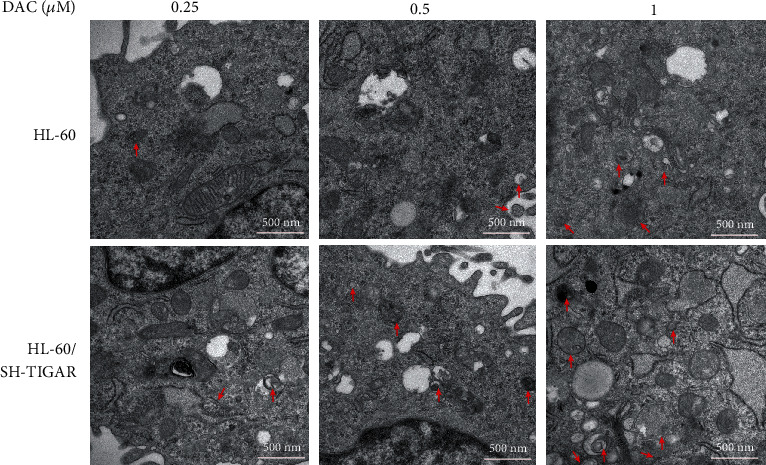
Decitabine (DAC) is a well-known DNA methyltransferase inhibitor, which has been widely used for the treatment of acute myeloid leukemia (AML). However, in addition to hypomethylation, DAC in AML is also involved in cell metabolism, apoptosis, and immunity. The TP53-induced glycolysis and apoptosis regulator (TIGAR) functions to inhabit glycolysis and protect cancer cells from reactive oxygen species- (ROS-) associated apoptosis. Our previous study revealed that TIGAR is highly expressed in myeloid leukemia cell lines and AML primary cells and associated with poor prognosis in adult patients with cytogenetically normal AML. In the present study, it was found that in a time- and concentration-dependent manner, DAC downregulates the TIGAR expression, induces ROS production, and promotes apoptosis in HL-60 and K562 cells. However, blocking the glycolytic pathway partially reversed the combined effects of DAC and TIGAR knockdown on apoptosis, ROS production, and cell cycle arrest, indicating that DAC induced apoptosis through the glycolytic pathway. Furthermore, TIGAR also has a negative impact on autophagy, while DAC treatment upregulates autophagy-related proteins LC3, Beclin-1, ATG3, and ATG-5, downregulates p62, and promotes the formation of autophagosomes, indicating that DAC may activate autophagy by downregulating TIGAR. Taken together, DAC plays an unmethylated role in inducing apoptosis and activating autophagy in myeloid leukemia by downregulating TIGAR.
Copyright © 2021 Lanzhu Li et al.
Conflict of interest statement
The authors declare that they have no conflict of interest.
Figures
Similar articles
-
TIGAR cooperated with glycolysis to inhibit the apoptosis of leukemia cells and associated with poor prognosis in patients with cytogenetically normal acute myeloid leukemia.J Hematol Oncol. 2016 Nov 25;9(1):128. doi: 10.1186/s13045-016-0360-4. J Hematol Oncol. 2016. PMID: 27884166 Free PMC article.
-
TIGAR impedes compression-induced intervertebral disc degeneration by suppressing nucleus pulposus cell apoptosis and autophagy.J Cell Physiol. 2020 Feb;235(2):1780-1794. doi: 10.1002/jcp.29097. Epub 2019 Jul 17. J Cell Physiol. 2020. PMID: 31317559
-
TIGAR, a p53-inducible regulator of glycolysis and apoptosis.Cell. 2006 Jul 14;126(1):107-20. doi: 10.1016/j.cell.2006.05.036. Cell. 2006. PMID: 16839880
-
Deciphering the Controversial Role of TP53 Inducible Glycolysis and Apoptosis Regulator (TIGAR) in Cancer Metabolism as a Potential Therapeutic Strategy.Cells. 2025 Apr 15;14(8):598. doi: 10.3390/cells14080598. Cells. 2025. PMID: 40277923 Free PMC article. Review.
-
Structure, regulation, and biological functions of TIGAR and its role in diseases.Acta Pharmacol Sin. 2021 Oct;42(10):1547-1555. doi: 10.1038/s41401-020-00588-y. Epub 2021 Jan 28. Acta Pharmacol Sin. 2021. PMID: 33510458 Free PMC article. Review.
Cited by
-
The Expression of TP53-Induced Glycolysis and Apoptosis Regulator (TIGAR) Can Be Controlled by the Antioxidant Orchestrator NRF2 in Human Carcinoma Cells.Int J Mol Sci. 2022 Feb 8;23(3):1905. doi: 10.3390/ijms23031905. Int J Mol Sci. 2022. PMID: 35163828 Free PMC article.
-
TIGAR Protects Cochlear Hair Cells against Teicoplanin-Induced Damage.Mol Neurobiol. 2023 Jul;60(7):3788-3802. doi: 10.1007/s12035-023-03309-8. Epub 2023 Mar 21. Mol Neurobiol. 2023. PMID: 36943624 Free PMC article.
-
Inositol Alleviates Pulmonary Fibrosis by Promoting Autophagy via Inhibiting the HIF-1α-SLUG Axis in Acute Respiratory Distress Syndrome.Oxid Med Cell Longev. 2022 Dec 23;2022:1030238. doi: 10.1155/2022/1030238. eCollection 2022. Oxid Med Cell Longev. 2022. PMID: 36589681 Free PMC article.
-
Identification of PANoptosis-based signature for predicting the prognosis and immunotherapy response in AML.Heliyon. 2024 Nov 8;10(22):e40267. doi: 10.1016/j.heliyon.2024.e40267. eCollection 2024 Nov 30. Heliyon. 2024. PMID: 39634422 Free PMC article.
-
The dual role of autophagy in acute myeloid leukemia.J Hematol Oncol. 2022 May 7;15(1):51. doi: 10.1186/s13045-022-01262-y. J Hematol Oncol. 2022. PMID: 35526025 Free PMC article. Review.
References
-
- Huang X., Kong G., Li Y., et al. Decitabine and 5-azacitidine both alleviate LPS induced ARDS through anti- inflammatory/antioxidant activity and protection of glycocalyx and inhibition of MAPK pathways in mice. Biomedicine & Pharmacotherapy = Biomedecine & Pharmacotherapie. 2016;84:447–453. doi: 10.1016/j.biopha.2016.09.072. - DOI - PubMed
MeSH terms
Substances
LinkOut - more resources
Full Text Sources
Other Literature Sources
Research Materials
Miscellaneous
