. 2021 Jan 27;7(1):110-125.
doi: 10.1021/acscentsci.0c00601. Epub 2021 Jan 4.

Heterogeneity in 2,6-Linked Sialic Acids Potentiates Invasion of Breast Cancer Epithelia

Affiliations

Heterogeneity in 2,6-Linked Sialic Acids Potentiates Invasion of Breast Cancer Epithelia

Dharma Pally et al. ACS Cent Sci. .

Abstract

Heterogeneity in phenotypes of malignantly transformed cells and aberrant glycan expression on their surface are two prominent hallmarks of cancers that have hitherto not been linked to each other. In this paper, we identify differential levels of a specific glycan linkage: α2,6-linked sialic acids within breast cancer cells in vivo and in culture. Upon sorting out two populations with moderate, and relatively higher, cell surface α2,6-linked sialic acid levels from the triple-negative breast cancer cell line MDA-MB-231, both populations (denoted as medium and high 2,6-Sial cells, respectively) stably retained their levels in early passages. Upon continuous culturing, medium 2,6-Sial cells recapitulated the heterogeneity of the unsorted line whereas high 2,6-Sial cells showed no such tendency. Compared with high 2,6-Sial cells, the medium 2,6-Sial counterparts showed greater adhesion to reconstituted extracellular matrices (ECMs) and invaded faster as single cells. The level of α2,6-linked sialic acids in the two sublines was found to be consistent with the expression of a specific glycosyl transferase, ST6GAL1. Stably knocking down ST6GAL1 in the high 2,6-Sial cells enhanced their invasiveness. When cultured together, medium 2,6-Sial cells differentially migrated to the edge of growing tumoroid-like cocultures, whereas high 2,6-Sial cells formed the central bulk. Multiscale simulations in a Cellular Potts model-based computational environment calibrated to our experimental findings suggest that differential levels of cell-ECM adhesion, likely regulated by α2,6-linked sialic acids, facilitate niches of highly invasive cells to efficiently migrate centrifugally as the invasive front of a malignant breast tumor.


Conflict of interest statement

The authors declare no competing financial interest.

Figures

Figure 1
Figure 1
α2,6-Sialic acid heterogeneity in breast cancer. (A) Confocal micrographs showing α2,6-sialic acid (SNA-FITC, green) and α2,3-sialic acid (MAA-TRITC, red) staining of breast cancer sections from two individuals (top and bottom rows) showing heterogeneity in α2,6-sialic acid linkage expression. The nucleus is stained with DAPI (white) (scale bar: 100 μm). (B) Bar graphs showing quantification of individual sialic acid levels from breast cancer sections shown in part A. Error bars represent mean ± SD. (C) Confocal micrographs showing heterogeneity in α2,6-Sial levels (SNA-FITC green) and uniform α2,3-sialic levels (MAA-TRITC, red) in invasive breast cancer cell line MDA-MB-231 using lectin cytochemical fluorescence. Cells are counterstained for nucleus with DAPI (white) and F-actin with phalloidin (Magenta). Insets of a subfield within the images shown in bottom right corner. (D) Lectin-based flow cytometry profiles of MDA-MB-231 cells show bimodal distribution of α2,6-Sial levels (top left) and unimodal distribution of α2,3-Sial levels (top right). Red inset shows moderate levels of α2,6-Sial (left) and unchanged α2,3-Sial (right) in sorted medium 2,6-Sial cells. Orange inset shows higher α2,6-Sial (left) and unchanged α2,3-Sial (right) levels in sorted high 2,6-Sial cells.
Figure 2
Figure 2
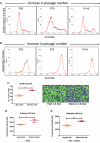
Medium 2,6-Sial cells show greater plasticity, adhere better to, and invade through ECM. (A) Lectin-based flow cytometry profile of α2,6-Sial levels of medium 2,6-Sial population at three passages (20, 70, and 145) of long-term culture showing a gradual recapitulation of bimodal α2,6-Sial distribution after 70 passages. (B) Lectin-based flow cytometry of high 2,6-Sial at three passages (20, 70, and 145) in long-term culture showing no change in α2,6-Sial even after 145 passages. (C) Bar graph showing lower invasion of high 2,6-Sial cells (yellow) compared with medium 2,6-Sial cells (red) that invaded to the other side of lrECM-coated transwells (n = 3). (D) Graph showing lower adhesion of high 2,6-Sial cells (yellow) compared with medium 2,6-Sial cells (red) to lrECM (n = 3). (E) Graph showing lower adhesion of high 2,6-Sial cells (yellow) compared with medium 2,6-Sial cells (red) to Type 1 collagen (n = 3). Error bars denote mean ± SEM. The unpaired Student’s t test was performed for statistical significance (*P ≤ 0.05, **P ≤ 0.01).
Figure 3
Figure 3
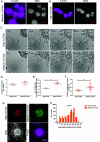
Medium 2,6-Sial cells invade faster through a 3D pathotypic multi-ECM microenvironment. (A) Confocal micrographs showing medium 2,6-Sial cells invading into fibrillar Type 1 collagen matrix from lrECM-coated multicellular clusters after 24 h. (B) Confocal micrographs showing high 2,6-Sial cells invading into fibrillar Type 1 collagen matrix from lrECM-coated multicellular clusters after 24 h. (A, B) Cells are counter-stained for the nucleus with DAPI (white) and F-actin with phalloidin (magenta) (scale bar: 200 μm). (C) Bright field images taken at 0, 12, 18, and 24 h from time-lapse videography of lrECM-coated clusters of high and medium 2,6-Sial (top and bottom) invading into surrounding Type 1 collagen. (D) Graph showing insignificant differences in collective cell mode of invasion of high (yellow) and medium (red) 2,6-Sial cells as measured by the increase in cluster size obtained from time-lapse videography (n = 3). (E) Graph showing significantly lower invasion of high 2,6-Sial cells (yellow) compared with medium 2,6-Sial cells (red) as measured by the number of dispersed single cells in Type 1 collagen normalized to the initial cluster size obtained from lapse videography (n = 3). (F) Graph showing significantly lower mean migratory velocity of single high 2,6-Sial cells (yellow) compared with medium 2,6-Sial cells (red) as measured by manual tracking dynamics obtained from lapse videography (n = 3, N ≥ 15 cells). (G) Confocal micrographs showing differential sorting of medium 2,6-Sial (green) cells invading and dispersing further into the Type 1 collagen ECM while high 2,6-Sial cells (red) form the core of the cluster when these two cells have been mixed in equal proportion and cultured in 3D. (Cells are counter-stained for the nucleus with DAPI (white) and F-actin with phalloidin (magenta) (scale bar: 200 μm). (H) Histogram showing distribution of intercellular distances between high 2,6-Sial cells (red) compared with medium 2,6-Sial cells (yellow). Intercellular distances between medium α2,6-Sial cells are shifted rightwards indicative of a greater spread and farther invasion within 3D matrix microenvironment compared to high 2,6-Sial cells. Error bars denote mean ± SEM. The unpaired Student’s t test was performed for statistical significance (*P ≤ 0.05, **P ≤ 0.01).
Figure 4
Figure 4
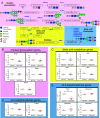
Differential expression of the ST6GAL1 gene. (A) Schematic depiction of key processes involved in the fate and utilization of sialic acids and the genes encoding the enzymes involved in these processes arranged in the temporal order of their function: N-glycan synthesis, sialic acid metabolism and sialyltransferases. (B) Graphs depicting relative mRNA levels of genes involved in N-linked glycosylation DPAGT1, ALG1, ALG3, GANAB, and MAN1A1; expression is insignificantly altered between high (yellow) and medium (red) 2,6-Sial cells. (C) Graphs depicting relative mRNA levels of genes involved in sialic acid metabolism GNE, NANS, CMAS, and NEU1; expression is insignificantly altered between high (yellow) and medium (red) 2,6-Sial cells. (D) Graphs depicting relative mRNA levels of genes involved in 2,3-sialic acid conjugation ST3GAL3 and ST3GAL4; expression is insignificantly altered between high (yellow) and medium (red) 2,6-Sial cells. (E) Graphs depicting relative mRNA levels of genes involved in 2,6-sialic acid conjugation ST6GAL1, ST6GALNAC2, ST6GALNAC4, and ST6GALNAC6; expression is insignificantly altered between high (yellow) and medium (red) 2,6-Sial cells for all except ST6GAL1, which is significantly lower in medium 2,6-Sial cells compared to high 2,6-Sial cells. Expression of all genes is plotted as 2–ΔΔct normalized to unsorted cells. The 18S rRNA gene is used as an internal control. Data shown are from five independent biological experiments with at least duplicate samples run in each experiment. Error bars denote mean ± SEM. The unpaired Student’s t test was performed for statistical significance (****P < 0.0001).
Figure 5
Figure 5
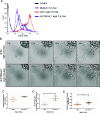
α2,6-Sial levels regulate mesenchymal invasion of high 2,6-Sial cells. (A) Lectin-based flow cytometry profiles showing decreased α2,6-Sial levels upon ST6GAL1 gene knockdown in high 2,6-Sial cells. (B) Bright field images taken at 0, 12, 18, and 24 h from time-lapse videography of lrECM-coated clusters of scrambled control and ST6GAL1 knocked down high 2,6-Sial cells (shSc-high 2,6-Sial top and shST6GAL1-high 2,6-Sial bottom) invading into surrounding Type 1 collagen. (C) Graph showing insignificant differences in the collective cell mode of invasion of shSc-high 2,6-Sial (yellow) and shST6GAL1-high 2,6-Sial (brown) cells as measured by the increase in cluster size obtained from time-lapse videography (n = 3). (D) Graph showing significantly lower invasion of shSc-high 2,6-Sial cells (yellow) compared with shST6GAL1-high 2,6-Sial cells (red) as measured by the number of dispersed single cells in Type 1 collagen normalized to the initial cluster size obtained from lapse videography (n = 3). (E) Graph showing significantly lower mean migratory velocity of single shSc-high 2,6-Sial cells (yellow) compared with shST6GAL1-high 2,6-Sial cells (red) as measured by manual tracking dynamics obtained from lapse videography (n = 3, N ≥ 15 cells). Error bars denote mean ± SEM. The unpaired Student’s t test was performed for statistical significance (*P ≤ 0.05, **P ≤ 0.01).
Figure 6
Figure 6
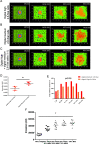
Multiscale simulations predict that matrix adhesion principally contributes to increased invasion. (A) Snapshots of simulation at MCS (0, 200, 400, and 600) of model lrECM-coated (blue) clusters of digital high 2,6-Sial cells in model Type 1 collagen (green). (B) Snapshots of the simulation at MCS (0, 200, 400, and 600) of model lrECM-coated (blue) clusters of digital medium 2,6-Sial cells in model Type 1 collagen (green). (C) Snapshots of simulation at MCS (0, 200, 400, and 600) of model lrECM-coated (blue) clusters of digital high and medium 2,6-Sial cells mixed in a ratio of 1:1 show a relatively greater invasion and dispersal of digital medium 2,6-Sial cells with digital high 2,6-Sial cells forming the central core. (D) Bar graph showing greater invasion of digital medium 2,6-Sial cells (red) compared with digital high 2,6-Sial cells in their 3D cocultures such as in Figure 6C (n = 3). Error bars denote mean ± SEM. The unpaired Student’s t test was performed for statistical significance. (E) Histograms depicting the intercellular distances of the digital high 2,6-Sial cells (yellow) and those of medium 2,6-Sial cells (red) with the rightward shift of the latter indicating greater dispersal. (F) Graph depicting the invasion of an overall population of cancer cells in 3D (conditions similar to parts A–C) wherein the clusters of digital cells are composed of digital high and medium 2,6-Sial cells in the relative proportion of 100%, 0%; 75%, 25%; 50%, 50%; 25%, 75%; and 0%, 100%, from left to right, respectively. Error bars denote mean ± SEM. Ordinary one-way ANOVA with Tukey’s post-hoc multiple comparisons was performed for statistical significance (*P ≤ 0.05).

Similar articles

Cited by

References

    1. Poudel P.; Nyamundanda G.; Patil Y.; Cheang M. C. U.; Sadanandam A. Heterocellular gene signatures reveal luminal-A breast cancer heterogeneity and differential therapeutic responses. NPJ. breast cancer 2019, 5, 21.10.1038/s41523-019-0116-8. - DOI - PMC - PubMed
    1. Verhaegh W.; et al. Heterogeneity in signaling pathway activity within primary breast cancer and between primary and metastases. J. Clin. Oncol. 2019, 37 (15s), 589–589. 10.1200/JCO.2019.37.15_suppl.589. - DOI - PubMed
    1. Lee H. J.; et al. HER2 heterogeneity affects trastuzumab responses and survival in patients with HER2-positive metastatic breast cancer. Am. J. Clin. Pathol. 2014, 142 (6), 755–766. 10.1309/AJCPIRL4GUVGK3YX. - DOI - PubMed
    1. Rye I. H.; et al. Intratumor heterogeneity defines treatment-resistant HER2+ breast tumors. Mol. Oncol. 2018, 12 (11), 1838–1855. 10.1002/1878-0261.12375. - DOI - PMC - PubMed
    1. Hawkins R. A.; et al. Oestrogen receptors, lactate dehydrogenase and cellularity in human breast cancer. Clin. Chim. Acta 1988, 175 (1), 89–96. 10.1016/0009-8981(88)90038-1. - DOI - PubMed

LinkOut - more resources