. 2021 Jan 27;7(1):200-209.
doi: 10.1021/acscentsci.0c01522. Epub 2021 Jan 5.

Accurate Representations of the Microphysical Processes Occurring during the Transport of Exhaled Aerosols and Droplets

Affiliations

Accurate Representations of the Microphysical Processes Occurring during the Transport of Exhaled Aerosols and Droplets

Jim S Walker et al. ACS Cent Sci. .

Erratum in

Abstract

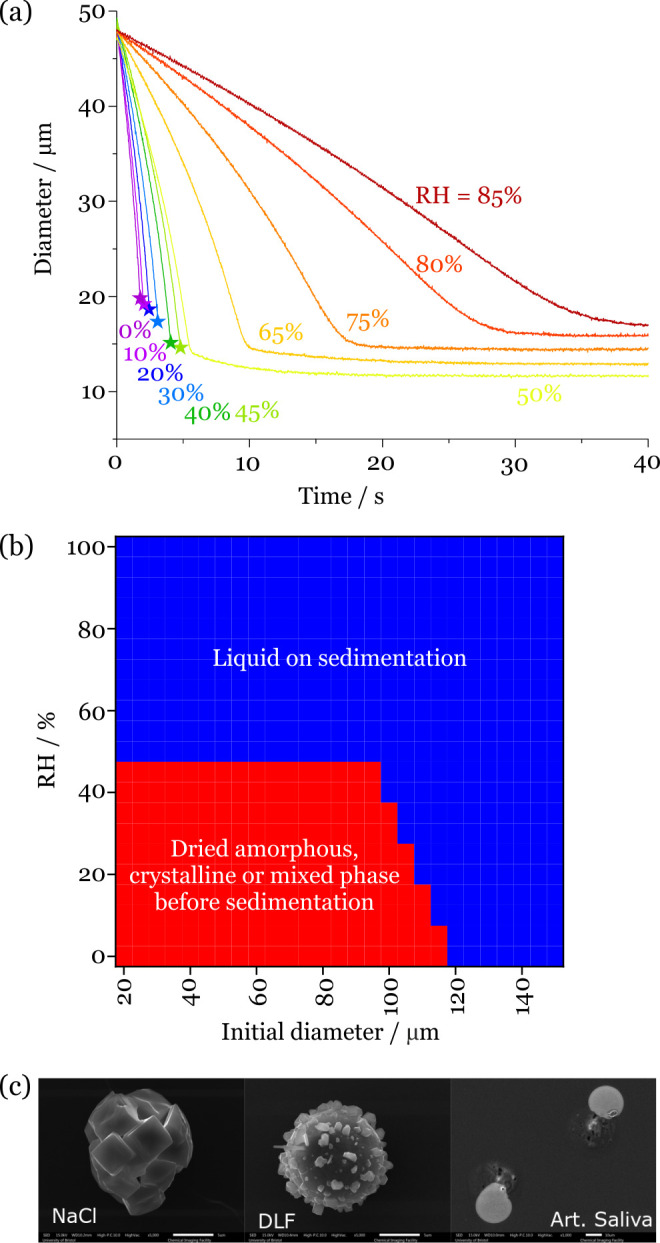
Aerosols and droplets from expiratory events play an integral role in transmitting pathogens such as SARS-CoV-2 from an infected individual to a susceptible host. However, there remain significant uncertainties in our understanding of the aerosol droplet microphysics occurring during drying and sedimentation and the effect on the sedimentation outcomes. Here, we apply a new treatment for the microphysical behavior of respiratory fluid droplets to a droplet evaporation/sedimentation model and assess the impact on sedimentation distance, time scale, and particle phase. Above a 100 μm initial diameter, the sedimentation outcome for a respiratory droplet is insensitive to composition and ambient conditions. Below 100 μm, and particularly below 80 μm, the increased settling time allows the exact nature of the evaporation process to play a significant role in influencing the sedimentation outcome. For this size range, an incorrect treatment of the droplet composition, or imprecise use of RH or temperature, can lead to large discrepancies in sedimentation distance (with representative values >1 m, >2 m, and >2 m, respectively). Additionally, a respiratory droplet is likely to undergo a phase change prior to sedimenting if initially <100 μm in diameter, provided that the RH is below the measured phase change RH. Calculations of the potential exposure versus distance from the infected source show that the volume fraction of the initial respiratory droplet distribution, in this size range, which remains elevated above 1 m decreases from 1 at 1 m to 0.125 at 2 m.


Conflict of interest statement

The authors declare no competing financial interest.

Figures

Figure 1
Figure 1
(a) Hygroscopic diameter growth curves for artificial saliva and deep lung fluid, compared with aqueous sodium chloride solution. (b) Dependence of equilibrium solution composition, represented as the variation in mass fraction of solute, on water activity, equivalent to RH. The stars indicate the water activity at which a phase change occurs.
Figure 2
Figure 2
(a) Simulated evaporation time scales for saliva droplets evaporating at 293 K (20 °C) and 50% RH with initial diameters spanning 5–200 μm (5 μm intervals). (b) Comparison of the evaporation–sedimentation curves for saliva droplets 20–150 μm in initial diameter (5 μm intervals), projected by a cough at 10 m/s at 293 K and 50% RH. The trajectory of the respiratory jet is shown in red (traveling from left to right). (I) indicates the initial droplet size and (F) the size at deposition. (c) Dependence of sedimentation distance on RH for saliva droplets initially 60 μm in diameter generated by a cough at 10 m/s at 293 K and 0–100% RH (5% RH intervals). The trajectory of the respiratory jet is shown in red.
Figure 3
Figure 3
(a) Comparison of the sedimentation trajectories of droplets composed of saliva, lung fluid, sodium chloride, and pure water showing two limiting cases for droplets initially of the same size (70 μm). The trajectory of the respiratory jet is shown in red. (b) Sedimentation distance for saliva droplets projected from a cough at 10 m/s into an environment at 293 K (20 °C). The black dashed line indicates when the 4 m sedimentation limit is reached. (c) Change in sedimentation distance on assuming that the droplets are composed of sodium chloride solution rather than saliva. The dashed lines indicate when the 4 m sedimentation limit is reached for saliva (black) and NaCl (green).
Figure 4
Figure 4
Sedimentation time scale for saliva droplets at 293 K (20 °C). The black dashed line indicates when the 4 m sedimentation limit is reached.
Figure 5
Figure 5
(a) Evaporation kinetics of deep lung fluid droplets with varying RH. The stars identify the onset of disruption to the light scattering pattern, indicating that a phase change has occurred to a nonspherical particle morphology. (b) Phase identification on sedimentation for deep lung fluid droplets with varying droplet size and RH from a cough at 10 m/s into an environment at 293 K (20 °C). The red bounded region indicates that droplets undergo a phase change before sedimenting onto a surface. (c) SEM images of the effloresced particles obtained from NaCl, deep lung fluid, and saliva droplets evaporated at 35% RH and 295 K. The scale bar represents 5 μm (NaCl and deep lung fluid) and 10 μm (saliva).
Figure 6
Figure 6
(a) Dependence of sedimentation distance on temperature for saliva droplets initially 60 μm in diameter generated by a cough at 10 m/s at 50% RH and 273–303 at 5 K intervals. The dashed lines represent the trajectory of the respiratory jet at 273 K (black) and 303 K (red). (b) Increase in sedimentation distance for saliva droplets generated by a cough when the ambient temperature increases to 303 K compared with 283 K. The region to the left of the dashed lines indicates when the 4 m limit is reached without sedimentation occurring for 283 K (black) and 303 K (yellow).
Figure 7
Figure 7
(a) Schematic of the indicative exposure calculation. The fraction of droplets and aerosols passing through the window at 1, 1.5, 2, 2.5, 3, 3.5, and 4 m is calculated. (b) RH-dependent volume exposure fraction at 1, 1.5, 2, 2.5, 3, 3.5, and 4 m for saliva droplets with an initial diameter <100 μm. These calculations are for a cough at an ambient temperature of 293 K. (c) Temperature-dependent droplet number exposure fraction at 1, 1.5, 2, 2.5, 3, 3.5, and 4 m for saliva droplets with an initial diameter <100 μm. These calculations are for a cough at an ambient RH of 50%.

References

    1. Asadi S.; Bouvier N.; Wexler A. S.; Ristenpart W. D. The Coronavirus Pandemic and Aerosols : Does COVID-19 Transmit via Expiratory Particles ?. Aerosol Sci. Technol. 2020, 54 (6), 635–638. 10.1080/02786826.2020.1749229. - DOI - PMC - PubMed
    1. Tellier R.; Li Y.; Cowling B. J.; Tang J. W. Recognition of Aerosol Transmission of Infectious Agents: A Commentary. BMC Infect. Dis. 2019, 19 (1), 1–9. 10.1186/s12879-019-3707-y. - DOI - PMC - PubMed
    1. Xie X.; Li Y.; Chwang A. T. Y.; Ho P. L.; Seto W. H. How Far Droplets Can Move in Indoor Environments – Revisiting the Wells Evaporation–Falling Curve. Indoor Air 2007, 17 (3), 211–225. 10.1111/j.1600-0668.2007.00469.x. - DOI - PubMed
    1. Johnson G. R.; Morawska L.; Ristovski Z. D.; Hargreaves M.; Mengersen K.; Chao C. Y. H.; Wan M. P.; Li Y.; Xie X.; Katoshevski D.; Corbett S. Modality of Human Expired Aerosol Size Distributions. J. Aerosol Sci. 2011, 42 (12), 839–851. 10.1016/j.jaerosci.2011.07.009. - DOI - PMC - PubMed
    1. Bourouiba L. Turbulent Gas Clouds and Respiratory Pathogen Emissions: Potential Implications for Reducing Transmission of COVID-19. JAMA 2020, 323 (18), 1837–1838. 10.1001/jama.2020.4756. - DOI - PubMed

LinkOut - more resources