. 2021 Jan 14;24(1):102015.
doi: 10.1016/j.isci.2020.102015. eCollection 2021 Jan 22.

Mycolic acid-containing bacteria trigger distinct types of membrane vesicles through different routes

Affiliations

Mycolic acid-containing bacteria trigger distinct types of membrane vesicles through different routes

Toshiki Nagakubo et al. iScience. .

Abstract

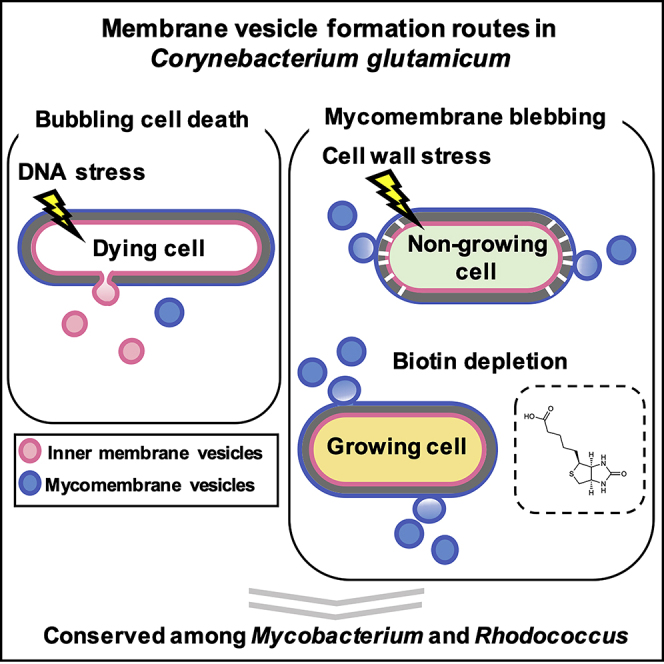
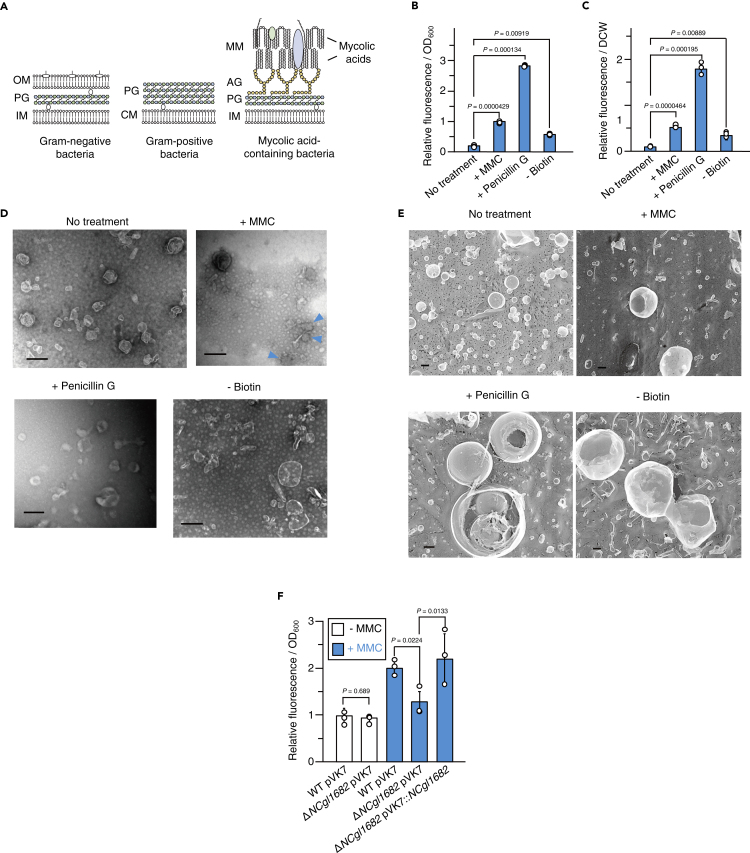
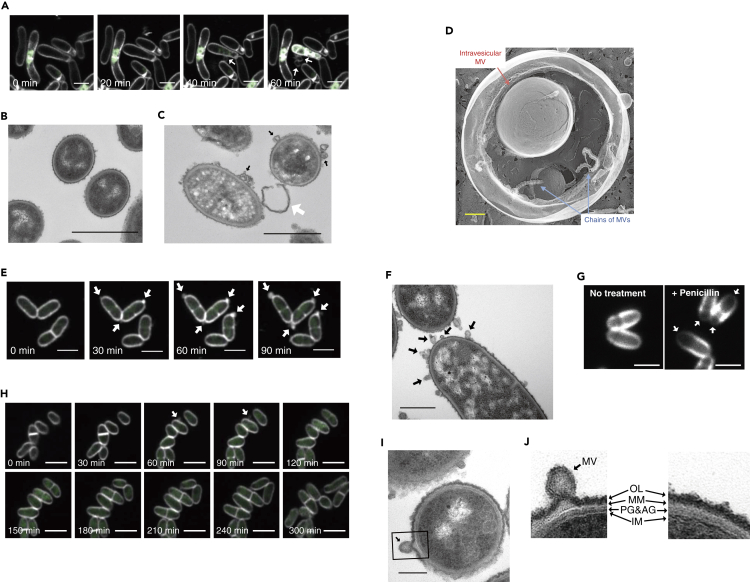
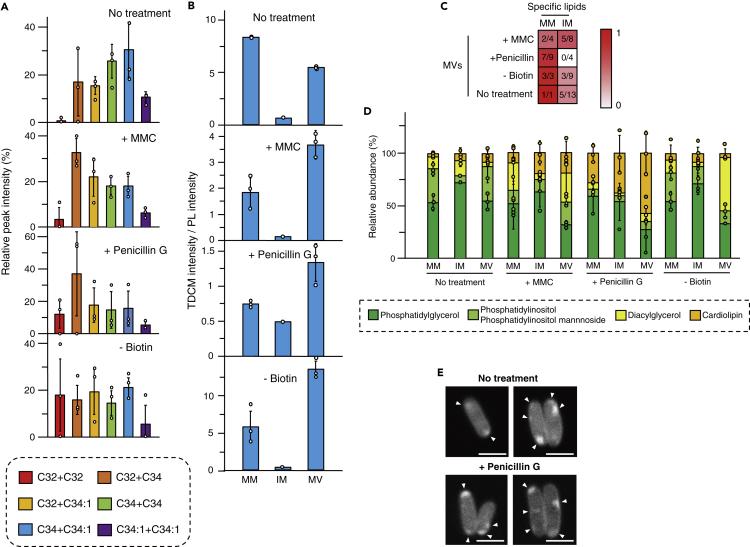
Bacterial membrane vesicles (MVs) are attracting considerable attention in diverse fields of life science and biotechnology due to their potential for various applications. Although there has been progress in determining the mechanisms of MV formation in Gram-negative and Gram-positive bacteria, the mechanisms in mycolic acid-containing bacteria remain an unsolved question due to its complex cell envelope structure. Here, by adapting super-resolution live-cell imaging and biochemical analysis, we show that Corynebacterium glutamicum form distinct types of MVs via different routes in response to environmental conditions. DNA-damaging stress induced MV formation through prophage-triggered cell lysis, whereas envelope stress induced MV formation through mycomembrane blebbing. The MV formation routes were conserved in other mycolic acid-containing bacteria. Our results show how the complex cell envelope structure intrinsically generates various types of MVs and will advance our knowledge on how different types of MVs can be generated from a single cell organism.

Keywords: Cell Biology; Microbiology.


Figures

None
Graphical abstract
Figure 1
Figure 1
Induction of membrane vesicle formation in Corynebacterium glutamicum (A) Structures of the cell envelope of Gram-negative (left), Gram-positive (middle), and mycolic acid-containing bacteria (right). OM, outer membrane; MM, mycomembrane; PG, peptidoglycan; IM, inner membrane; and AG, arabinogalactan; CM, cytoplasmic membrane. (B and C) Membrane vesicle (MV) release by C. glutamicum under MV formation-inducing conditions. FM4-64 fluorescence of the purified MV fractions was normalized to (B) OD600 or (C) dried cell weight (DCW). All values indicated by the bars represent the mean value ± SD for three experiments. p values were calculated using unpaired t test with Welch's correction. (D) Transmission electron microscopic (TEM) images of MVs released by C. glutamicum under the conditions shown in (B and C). Scale bars, 200 nm. Structures that are presumably MVs collapsed are indicated with blue arrowheads. (E) Quick-freeze deep-etch (QFDE) electron microscopic images of MVs. Scale bars, 200 nm. (F) MV release by wild-type C. glutamicum and NCgl1682 deletion mutant. White and blue bars indicate the presence or absence of MMC in the culture media, respectively. All values indicated by the bars represent the mean value ± SD for three experiments. p values were calculated using unpaired t test with Welch's correction.
Figure 2
Figure 2
MV release by Corynebacterium glutamicum via different routes (A, E, and H) Live-cell imaging of MV formation of C. glutamicum under (A) MMC condition, (E) penicillin G, and (H) biotin-deficient conditions. The image shows FM4-64 (white) merged with SYTOX green (green). Movies are shown as Videos S1, S2, and S3. White arrows indicate MVs. Scale bars, 2 μm. (B and C) Thin-section TEM images of C. glutamicum cells under (B) no treatment and (C) MMC conditions. Black and white arrows indicate MVs and presumably a cell wall fragment, respectively. Scale bars, 1 μm. (D) Magnified QFDE image of MVs formed under penicillin G treatment condition. Red arrow and blue arrows indicate intravesicular MV and chains of MVs, respectively. Scale bar, 200 nm. (F) Thin-section TEM images of C. glutamicum cells under penicillin G. Black arrows indicate MVs. Scale bar, 1 μm. (G) Peptidoglycans of C. glutamicum cells were visualized using HADA in the presence or absence of penicillin G. White arrows indicate the cell pole in which peptidoglycan synthesis is severely inhibited by penicillin G treatment. Scale bars, 2 μm. (I) Thin-section TEM images of C. glutamicum cells under biotin-deficient conditions. Scale bar, 200 nm. (J) Magnified images of the cell envelope of an MV-forming cell (left, black square in I) and a non-forming cell (right). OL, outer layer; OM, outer membrane; PG, peptidoglycan; AG, arabinogalactan; IM, inner membrane.
Figure 3
Figure 3
Lipid compositions of MVs (A) Trehalose dicorynomycolic acids (TDCMs) were detected from MVs using LC/MS. The structure of each TDCM was determined based on the results of GC/MS and LC/MS/MS analyses shown in Figures S12 and S14. (B) Intensities of TDCM and phospholipids (PLs) in TLC analysis were compared using ImageJ. Each lipid was extracted from mycomembrane (MM), inner membrane (IM), and MV of Corynebacterium glutamicum, and then separated by TLC as described under Methods. All values indicated by the bars represent the mean value ± SD for three experiments. (C) Mycomembrane-specific lipids (MMSLs) and inner membrane-specific lipids (IMSLs) of C. glutamicum cells under various growth conditions were identified by LC/MS analyses. In these analyses, we defined MMSLs and IMSLs as the lipids that were detected in either the mycomembrane (1-butanol extract) or the inner membrane extract (total of chloroform/methanol and chloroform/methanol/water extracts) of C. glutamicum cell under each of the designated culture conditions. Detailed information of these analyses is shown in Methods and Figures S15–S18. Denominator of each fraction indicates total number of specific lipids in the mycomembrane or the inner membrane extract of C. glutamicum cells under different culture condition, and the numerator of each fraction indicates total number of those MMSLs or IMSLs detected in MVs. (D) Lipid compositions of mycomembrane, inner membrane, and MVs were analyzed. Mycomembranes and inner membranes were extracted separately from cells using 1-butanol and chloroform/methanol solutions, respectively. Lipids were quantified using TLC and standard lipids. All values indicated by the bars represent the mean value ± SD for three experiments. (E) Cardiolipins were visualized using acridine orange 10-nonyl bromide. White arrowheads indicate the localization of cardiolipins. Scale bars, 2 μm.
Figure 4
Figure 4
Detection of various cellular components in MVs (A) Quantification of concentrations of double-stranded DNA associated with C. glutamicum MVs. All values indicated by the bars represent the mean value ± SD for three experiments. (B) Protein profiles of MVs. A, hypothetical membrane protein (NCgl0381); B, 5-methyltetrahydropteroyltriglutamate-homocysteine S-methyltransferase; C, PS1; D, ATP synthase β-subunit; E, elongation factor Tu; F, corynomycoloyl transferase C chain A (Cmt1); G, esterase family protein (Cmt2); H, PS1 fragment. Five micrograms of protein was applied to each lane. (C and D) Detection and quantification of (C) amino acids and (D) sugars that are derived from cell wall fragments in MVs. All values indicated by the bars represent the mean value ± SD for three experiments.
Figure 5
Figure 5
MV induction in other mycolic acid-containing bacteria (A–T) The panels (A–G, H–N, and O–T) correspond to Mycobacterium smegmatis MC2155, R. erythropolis PR4, and Rhodococcus equi IFO3730, respectively. (A, H, and O) M. smegmatis, R. erythropolis, and R. equi were cultured under various conditions and then their MV release were measured. M. smegmatis and R. erythropolis were cultured in synthetic minimum media, whereas R. equi was cultured in LB medium, with and without biotin supplementation, due to extremely low growth in synthetic minimum medium (details of growth conditions are described under Methods). All values indicated by the bars represent the mean value ± SD for three experiments. p values were calculated using unpaired t test with Welch's correction. DCW, dried cell weights. (B, I, and P) TEM images of MVs of the mycolic acid containing bacteria are shown. Scale bars, 200 nm. (C–F, J–M, and Q–S) Particle size distributions of the above MVs. Black lines indicate the mean values of the concentrations of the detected particles in MV solutions. Red regions indicate SD of the mean values. (G, N, and T) Thin-layer chromatography profiles of the above MVs. Lipids were processed using chloroform-methanol-water (65:25:4, v/v). N, no treatment condition; B, biotin-deficient condition in M. smegmatis and R. erythropolis, or without biotin supplemented in R. equi; M, MMC treatment condition; P, penicillin G treatment condition. Black star indicates apolar lipids including mycolic acid esters. Black circle indicates polar lipids including phospholipids.

Similar articles

Cited by

References

    1. Acevedo R., Fernández S., Zayas C., Acosta A., Sarmiento M.E., Ferro V.A., Rosenqvist E., Campa C., Cardoso D., Garcia L., Perez J.L. Bacterial outer membrane vesicles and vaccine applications. Front. Immunol. 2014;5:121. - PMC - PubMed
    1. Agrawal A., Ramachandran R. Exploring the links between lipid geometry and mitochondrial fission: Emerging concepts. Mitochondrion. 2019;49:305–313. - PubMed
    1. Alderwick L.J., Harrison J., Lloyd G.S., Birch H.L. The mycobacterial cell wall—peptidoglycan and arabinogalactan. Cold Spring Harb. Perspect. Med. 2015;5:a021113. - PMC - PubMed
    1. Andreoni F., Toyofuku M., Menzi C., Kalawong R., Shambat S.M., François P., Zinkernagel A.S., Eberl L. Antibiotics stimulate formation of vesicles in Staphylococcus aureus in both phage-dependent and -independent fashions and via different routes. Antimicrob. Agents Chemother. 2019;63 e01439–18. - PMC - PubMed
    1. Arndt D., Grant J., Marcu A., Sajed T., Pon A., Liang Y., Wishart D.S. PHASTER: a better, faster version of the PHAST phage search tool. Nucleic Acids Res. 2016;44:W16–W21. - PMC - PubMed

LinkOut - more resources