[Preprint]. 2021 Jan 25:2021.01.24.428007.
doi: 10.1101/2021.01.24.428007.

Effect of mutations in the SARS-CoV-2 spike protein on protein stability, cleavage, and cell-cell fusion function

Affiliations

Effect of mutations in the SARS-CoV-2 spike protein on protein stability, cleavage, and cell-cell fusion function

Chelsea T Barrett et al. bioRxiv. .

Update in

Abstract

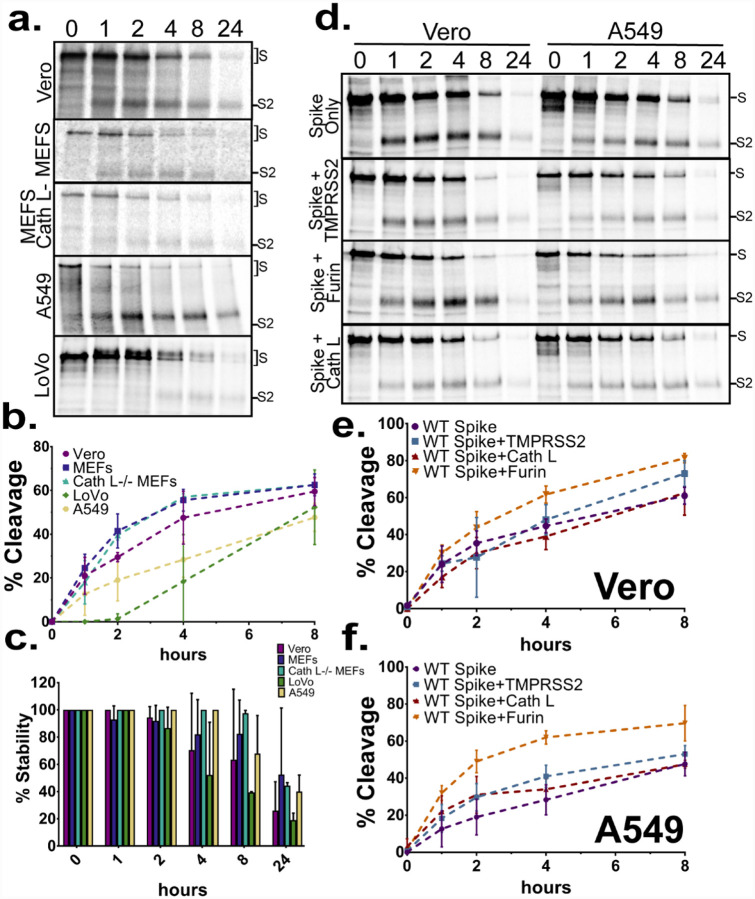
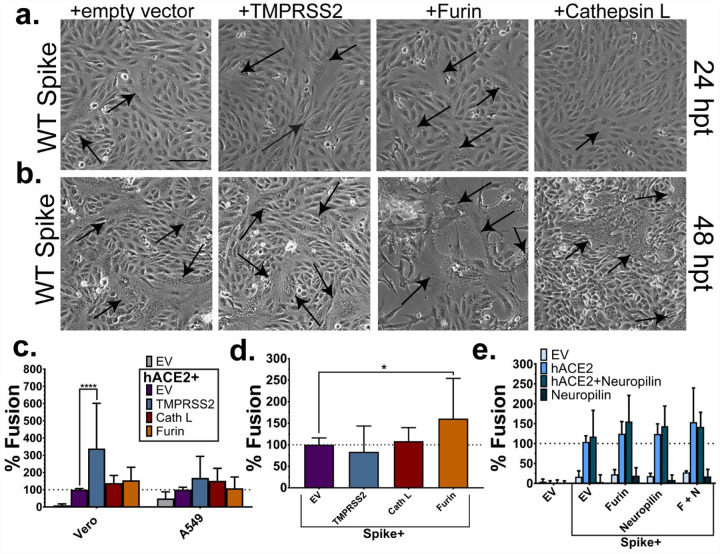
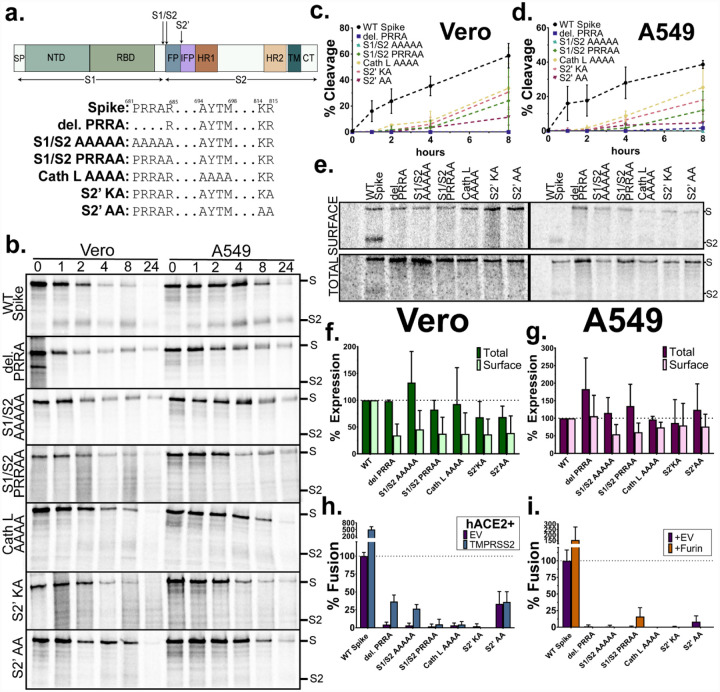
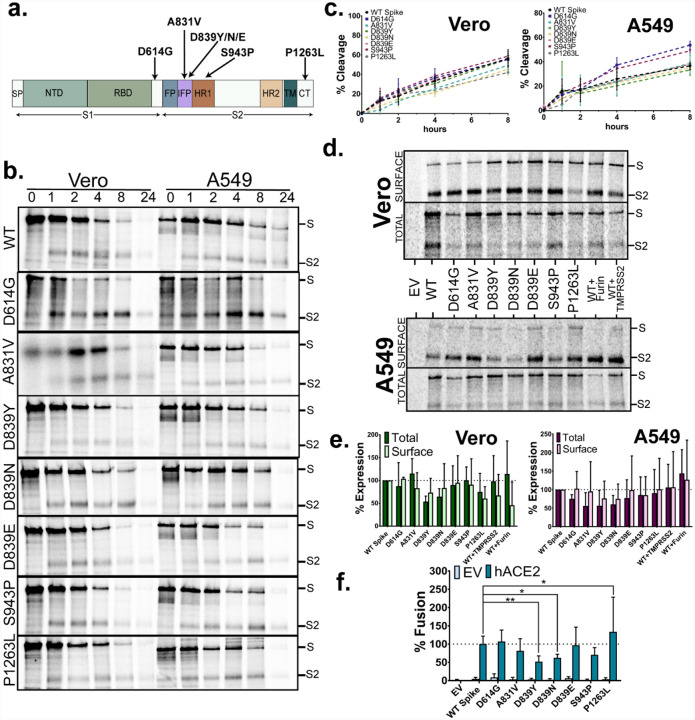
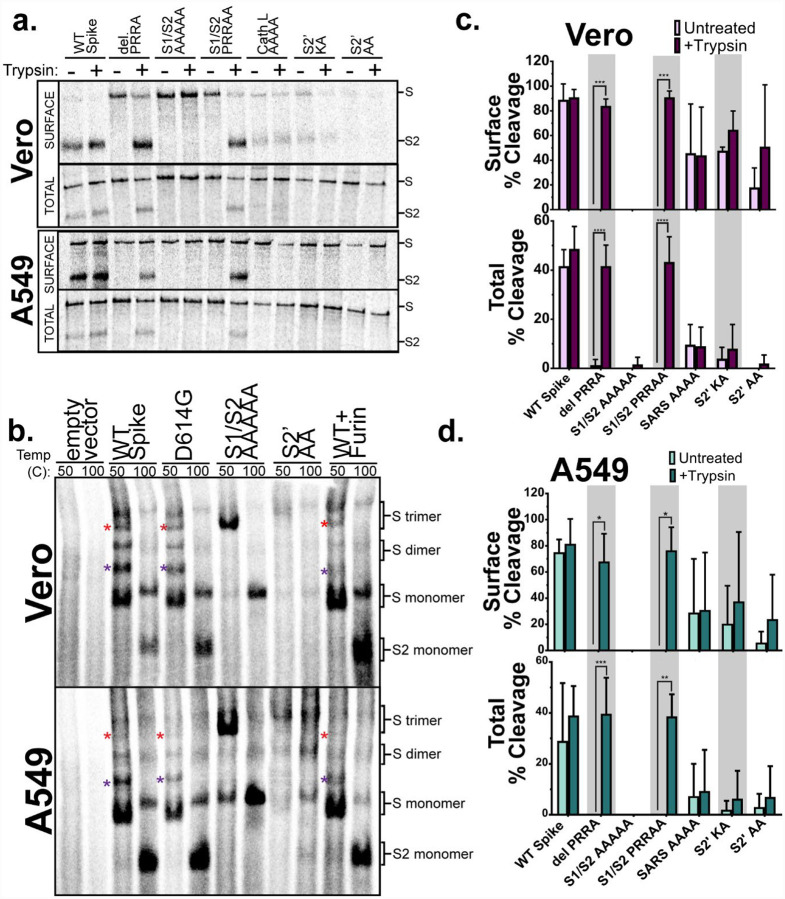
The SARS-CoV-2 spike protein (S) is the sole viral protein responsible for both viral binding to a host cell and the membrane fusion event needed for cell entry. In addition to facilitating fusion needed for viral entry, S can also drive cell-cell fusion, a pathogenic effect observed in the lungs of SARS-CoV-2 infected patients. While several studies have investigated S requirements involved in viral particle entry, examination of S stability and factors involved in S cell-cell fusion remain limited. We demonstrate that S must be processed at the S1/S2 border in order to mediate cell-cell fusion, and that mutations at potential cleavage sites within the S2 subunit alter S processing at the S1/S2 border, thus preventing cell-cell fusion. We also identify residues within the internal fusion peptide and the cytoplasmic tail that modulate S cell-cell fusion. Additionally, we examine S stability and protein cleavage kinetics in a variety of mammalian cell lines, including a bat cell line related to the likely reservoir species for SARS-CoV-2, and provide evidence that proteolytic processing alters the stability of the S trimer. This work therefore offers insight into S stability, proteolytic processing, and factors that mediate S cell-cell fusion, all of which help give a more comprehensive understanding of this highly sought-after therapeutic target.


Conflict of interest statement

Conflict of interest

The authors declare that they have no conflicts of interest with the contents of this article.

Figures

Figure 1:
Figure 1:. SARS-CoV-2 Spike is cleaved at the S1/S2 subunit border in a variety of cell lines.
a) The indicated cell types transiently expressing S were metabolically labeled for one hour, and chased for times indicated (hours). Band densitometry was used to quantify bands representing full length S or S cleaved at the S1/S2 border (S2) (b) Percent cleavage [S2 divided by S plus S2] and (b) Overall protein stability [Total S, S plus S2, for each time point, normalized to time point 0] were calculated for spike in each cell line (n=3). d) S alone, or S with proteases transiently expressed in Vero and A549 cells, cells were metabolically labeled, and chased for the times indicated (hours). Percent cleavage was measured using band densitometry in both (e) Vero and (f) A549 cells (b, c, e, f are represented as the average ± SD for 3 independent experiments).
Figure 2:
Figure 2:. CoV-2 spike alone mediates cell-cell fusion.
Veros expressing S and TMPRRS2, furin, or cathepsin L were imaged at 24 (a) and 48 (b) hpt for syncytia formation (black arrows). Magnification bar is 100μM. c) A luciferase reporter gene assay was performed with target cells (BSR/T7s expressing hACE2 and additional proteases) overlaid onto effector cells (Vero or A549s expressing S) for 9 hours. d) Luciferase reporter gene experiment was performed with additional proteases co-expressed with S in Veros and overlain with target cells expressing hACE2. e) The effect of Neuropilin in both target and effector (Vero) cells was examined with a luciferase reporter gene assay. Effector cells expression is listed along the x-axis. Target cell expression is listed in the graph legend. Results expressed as the percent fusion normalized to samples with S in the effector cells, and hACE2 only in the target cells (c-e are average ± SD for 3 independent experiments, performed in duplicate). Significance was determined by two-way ANOVA. *: p < 0.05, ****: p<0.0001
Figure 3:
Figure 3:. Mutations at all three potential spike cleavage sites reduce cleavage at the S1/S2 subunit border.
a) Full or partial alanine substitution mutations were made at each of the three potential cleavage sites. b) Plasmids expressing wt S or mutants were transfected into Veros and A549s, cells were metabolically labeled for one hour, and chased for the times indicated. Percent cleavage was determined in (c) Veros and (d) A549s (average ± SD for 3 independent experiments) e) Surface biotinylation was performed on cells expressing wt S and each mutant. Cells were radiolabeled for 6 hours. Protein expression in (f) Vero and (g) A549 cells, results are normalized to wt S, and error bars represent the standard deviation (average ± SD for 3 independent experiments). h) A luciferase reporter gene assay was performed using target cells expressing hACE2 and EV or TMPRRSS2, and effector (Vero) cells with wt S or each mutant. i) Luciferase reporter gene analysis with cells expressing hACE2 and effector (Vero) cells transfected with S or S mutants and EV or furin expressing plasmids. Results of both reporter gene assays are shown normalized to samples with wt S in the effector with hACE2 in target cells (average ± SD for 3 independent experiments, performed in duplicate).
Figure 4:
Figure 4:. Spike S2 subunit mutations found in circulating strains variably affect spike mediated cell-cell fusion.
a) Mutations in the S2 subunit of S identified in circulating SARS-CoV-2 strains, b) Wt S or the mutants were transfected into Veros and A549s, metabolically labeled for one hour, and chased for the times indicated. Percent cleavage was determined in (c) Veros and A549s (average ± SD for 3 independent experiments). d) Surface biotinylation on cells expressing wt S or each mutant. e) Total and surface protein expression normalized to wt S (average ± SD for 3 independent experiments). f) A luciferase reporter gene assay was performed using target cells expressing EV or hACE2, overlaid onto effector cells transfected with wt S or each mutant. Results are normalized to samples with wt S in the effector cells and hACE2 in target cells (average ± SD for 3 independent experiments, performed in duplicate). Significance was determined by two-way ANOVA, *: p<0.05, **: p<0.01.
Figure 5:
Figure 5:. Mutations at downstream potential cleavage sites render the S1/S2 border cleavage site less accessible to proteases.
a) Veros or A549s expressing wt S or S cleavage mutants were metabolically labeled for 6 hours. Surface proteins were biotinylated, and samples were either treated for 10 minutes with TPCK-Trypsin or left as untreated controls (as indicated). b) Veros or A549s expressing indicated proteins were metabolically labeled for 6 hours. Samples were treated at the indicated temperatures before separation on a nonreducing SDS-PAGE. Oligomers are labeled on the right based on size, and colored * represents potential intermediate species (n=3). Using band densitometry to quantify the bands in (a), percent cleavage was measured in (c) Vero and (d) A549 cells for both the surface (top graphs) and total (bottom graphs) populations (average ± SD for 3 independent experiments). Significance was determined by two-way ANOVA, *: p<0.05, **: p<0.01, ***: p<0.0005, ****: p<0.0001.
Figure 6:
Figure 6:. Furin or furin-like proteases in pteropus bat cells can cleave the S1/S2 border site of SARS-CoV-2 Spike.
a) Surface biotinylation was performed on pteropus lung and pteropus fetus cells transfected with wt S or the del. PRRA mutant. b) Surface or total protein expression levels were quantified using band densitometry and normalized to wt S levels. c) pt. lung and pt. fetus cells were transfected with wt S or del. PRRA mutant, metabolically labeled for one hour, and chased for the times indicated. Again, using band densitometry to quantify bands results were expressed as (d) protein cleavage and (e) protein stability over time. (b,d,e average ± SD for 3 independent experiments)

Similar articles

References

    1. World Health Organization. WHO Coronavirus Disease (COVID-19) Dashboard. 2020. [cited 2020 12/2/2020]; Available from: https://covid19.who.int/.
    1. Tortorici M.A. and Veesler D., Structural insights into coronavirus entry. Adv Virus Res, 2019. 105: p. 93–116. - PMC - PubMed
    1. Walls A.C., et al., Structure, Function, and Antigenicity of the SARS-CoV-2 Spike Glycoprotein. Cell, 2020. 181(2): p. 281–292.e6. - PMC - PubMed
    1. Lan J., et al., Structure of the SARS-CoV-2 spike receptor-binding domain bound to the ACE2 receptor. Nature, 2020. 581(7807): p. 215–220. - PubMed
    1. Luan J., et al., Spike protein recognition of mammalian ACE2 predicts the host range and an optimized ACE2 for SARS-CoV-2 infection. Biochem Biophys Res Commun, 2020. 526(1): p. 165–169. - PMC - PubMed

Publication types

LinkOut - more resources