[Preprint]. 2021 Jan 31:2021.01.27.21250570.
doi: 10.1101/2021.01.27.21250570.

Mapping a Pandemic: SARS-CoV-2 Seropositivity in the United States

Affiliations

Mapping a Pandemic: SARS-CoV-2 Seropositivity in the United States

Heather Kalish et al. medRxiv. .

Update in

  • Undiagnosed SARS-CoV-2 seropositivity during the first 6 months of the COVID-19 pandemic in the United States.
    Kalish H, Klumpp-Thomas C, Hunsberger S, Baus HA, Fay MP, Siripong N, Wang J, Hicks J, Mehalko J, Travers J, Drew M, Pauly K, Spathies J, Ngo T, Adusei KM, Karkanitsa M, Croker JA, Li Y, Graubard BI, Czajkowski L, Belliveau O, Chairez C, Snead KR, Frank P, Shunmugavel A, Han A, Giurgea LT, Rosas LA, Bean R, Athota R, Cervantes-Medina A, Gouzoulis M, Heffelfinger B, Valenti S, Caldararo R, Kolberg MM, Kelly A, Simon R, Shafiq S, Wall V, Reed S, Ford EW, Lokwani R, Denson JP, Messing S, Michael SG, Gillette W, Kimberly RP, Reis SE, Hall MD, Esposito D, Memoli MJ, Sadtler K. Kalish H, et al. Sci Transl Med. 2021 Jul 7;13(601):eabh3826. doi: 10.1126/scitranslmed.abh3826. Epub 2021 Jun 22. Sci Transl Med. 2021. PMID: 34158410 Free PMC article.

Abstract

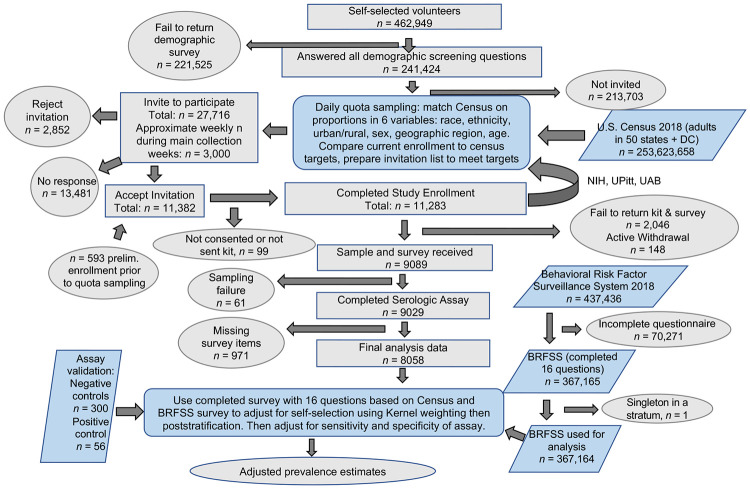
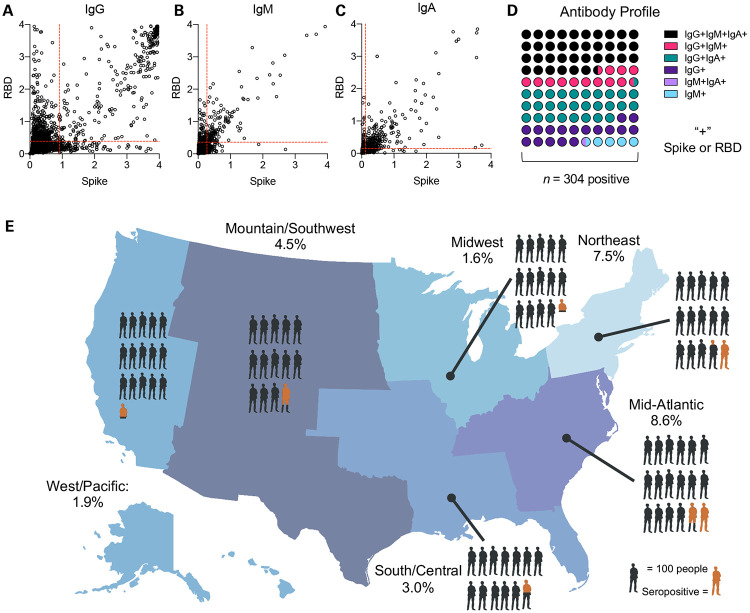
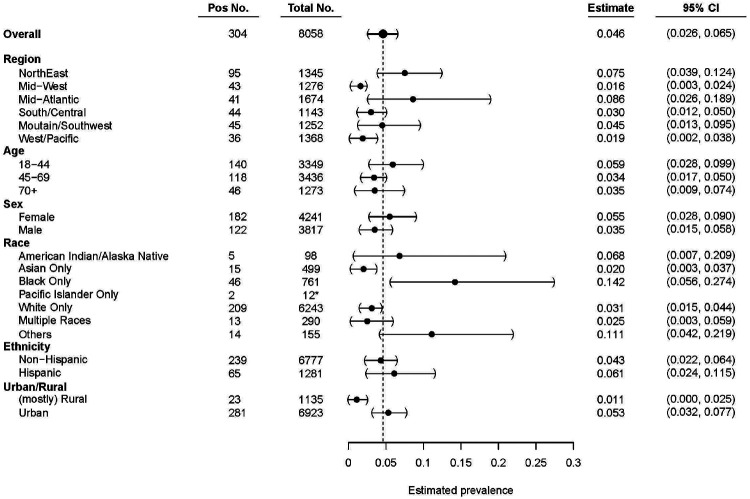
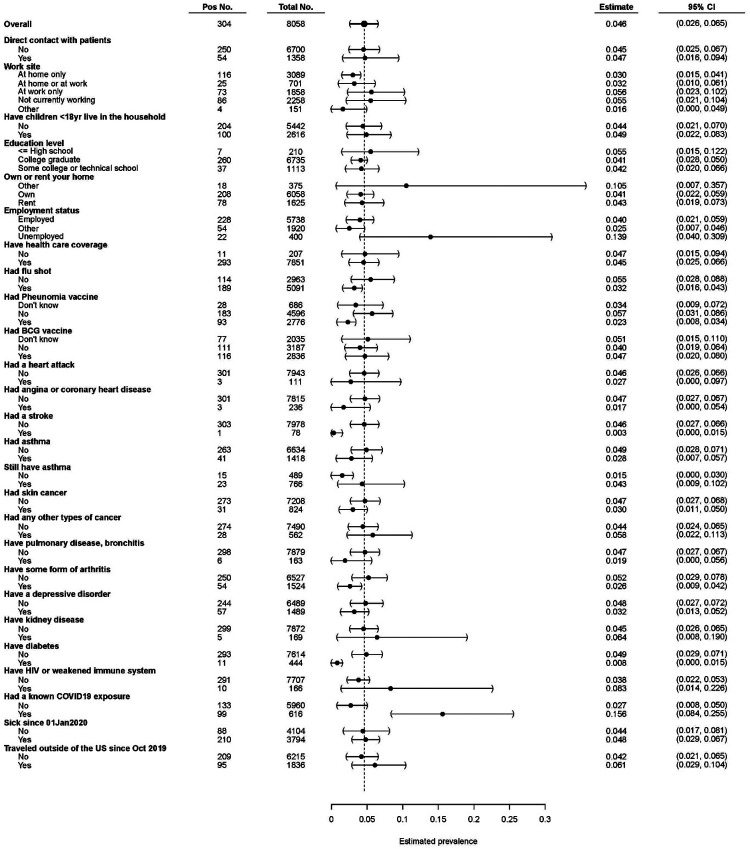
Asymptomatic SARS-CoV-2 infection and delayed implementation of diagnostics have led to poorly defined viral prevalence rates. To address this, we analyzed seropositivity in US adults who have not previously been diagnosed with COVID-19. Individuals with characteristics that reflect the US population (n = 11,382) and who had not previously been diagnosed with COVID-19 were selected by quota sampling from 241,424 volunteers (ClinicalTrials.gov NCT04334954). Enrolled participants provided medical, geographic, demographic, and socioeconomic information and 9,028 blood samples. The majority (88.7%) of samples were collected between May 10th and July 31st, 2020. Samples were analyzed via ELISA for anti-Spike and anti-RBD antibodies. Estimation of seroprevalence was performed by using a weighted analysis to reflect the US population. We detected an undiagnosed seropositivity rate of 4.6% (95% CI: 2.6 - 6.5%). There was distinct regional variability, with heightened seropositivity in locations of early outbreaks. Subgroup analysis demonstrated that the highest estimated undiagnosed seropositivity within groups was detected in younger participants (ages 18-45, 5.9%), females (5.5%), Black/African American (14.2%), Hispanic (6.1%), and Urban residents (5.3%), and lower undiagnosed seropositivity in those with chronic diseases. During the first wave of infection over the spring/summer of 2020 an estimate of 4.6% of adults had a prior undiagnosed SARS-CoV-2 infection. These data indicate that there were 4.8 (95% CI: 2.8-6.8) undiagnosed cases for every diagnosed case of COVID-19 during this same time period in the United States, and an estimated 16.8 million undiagnosed cases by mid-July 2020.


Figures

Figure 1:
Figure 1:. Serosurvey overview and statistical workflow.
A flow chart of donor recruitment through data analysis displaying steps in data acquisition and any attrition from data sets if applicable. Key: Ovals = starts and ends, gray rectangles = subsets of participants in this study, blue parallelograms = individuals from outside data sets that contribute to adjusted prevalence estimates, blue rounded rectangles = analysis processes.
Figure 2:
Figure 2:. Geographic distribution of undiagnosed seropositivity in the United States in summer 2020.
Raw serology data for (a) IgG and (b) IgM and (c) IgA against SARS-CoV-2 Spike and Receptor Binding Domain (RBD). Cut points for positivity are shown as red dashed lines, data are optical density (OD). (d) Serologic phenotype of antibody presence in seropositive participants (e) US Map showing seropositivity in six regions surveyed: Northeast = ME, NH, VT, MA, NY, CT, RI, PA, NJ, 7.5% (95% CI: 3.7 – 11.3%); Midwest = MN, IA, WI, IL, IN, MI, OH, 1.6% (95% CI: 0.06-2.3%); Mid-Atlantic = MD, DE, DC, VA, WV, KY, TN, NC, SC, GA, 8.6% (1.3 – 15.8%); South/Central = FL, MS, AL, LA, AR, MO, KS, OK, 3.0% (1.2 – 4.5%); Mountain/Southwest = TX, NM, AZ, CO, UT, WY, NE, SD, ND, MT, ID, 4.5% (0.09 – 7.9%); West/Pacific = WA, OR, NV, CA, AK, HI, 1.9% (0.02 – 3.2%). One person in diagram represents 100 participants, orange represents weighted prevalence estimate within the geographic region.
Figure 3:
Figure 3:. Undiagnosed seroprevalence in main demographic categories.
Six main categories utilized during quota-based sampling: region, age, sex, race, ethnicity, and urban/rural. Seropositivity estimates of samples that had a full clinical questionnaire completed and successful sampling. Data are weighted estimates ± 95% confidence intervals. Dashed line = weighted national seroprevalence estimate. * = n value too low to make proper weighted estimate, raw positivity displayed.
Figure 4:
Figure 4:. Seroprevalence estimates of health and behavioral traits.
Seropositivity estimates of samples that had a full clinical questionnaire completed and successful sampling. Data are weighted estimates ± 95% confidence intervals. Dashed line = weighted national seroprevalence estimate.

References

    1. Fauci AS, Lane HC, Redfield RR. Covid-19—navigating the uncharted. In: Mass Medical Soc; 2020. - PMC - PubMed
    1. Taubenberger JK, Morens DM. The pathology of influenza virus infections. Annu Rev Pathol Mech Dis. 2008;3:499–522. - PMC - PubMed
    1. Taubenberger JK, Morens DM. 1918 Influenza: the mother of all pandemics. Revista Biomedica. 2006;17(1):69–79. - PMC - PubMed
    1. Huang AT, Garcia-Carreras B, Hitchings MD, et al. A systematic review of antibody mediated immunity to coronaviruses: antibody kinetics, correlates of protection, and association of antibody responses with severity of disease. medRxiv. 2020. - PMC - PubMed
    1. Long Q-X, Liu B-Z, Deng H-J, et al. Antibody responses to SARS-CoV-2 in patients with COVID-19. Nature medicine. 2020:1–4. - PubMed

Publication types

Associated data