. 2021 Mar;34(2):400-418.
doi: 10.1007/s13577-020-00481-0. Epub 2021 Feb 2.

Morphological and biochemical changes in the pancreas associated with acute systemic hypoxia

Affiliations

Morphological and biochemical changes in the pancreas associated with acute systemic hypoxia

Fumiya Morioka et al. Hum Cell. 2021 Mar.

Abstract

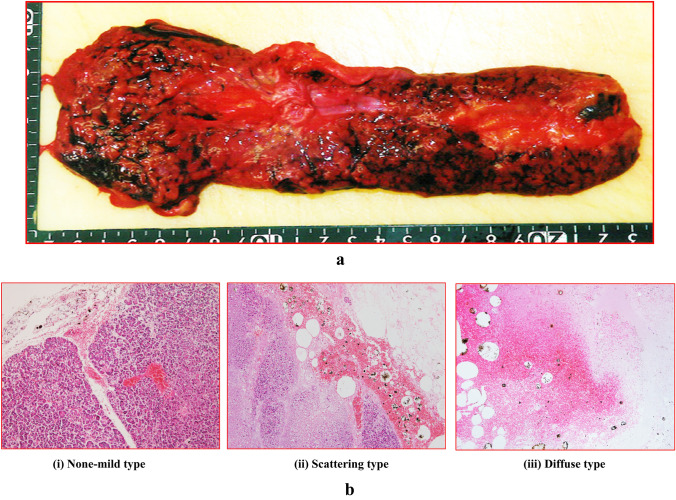
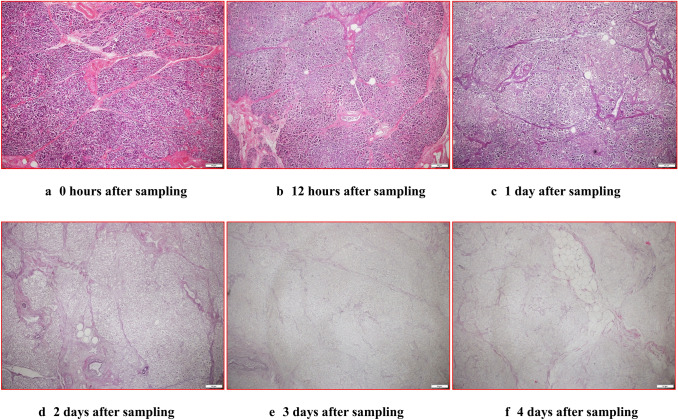
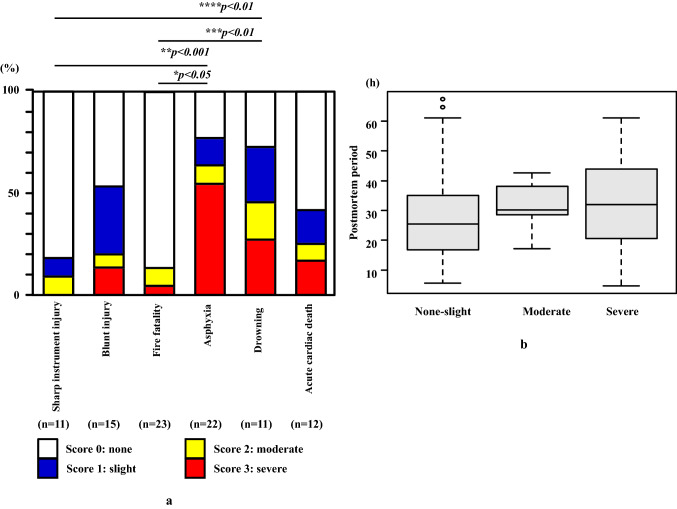
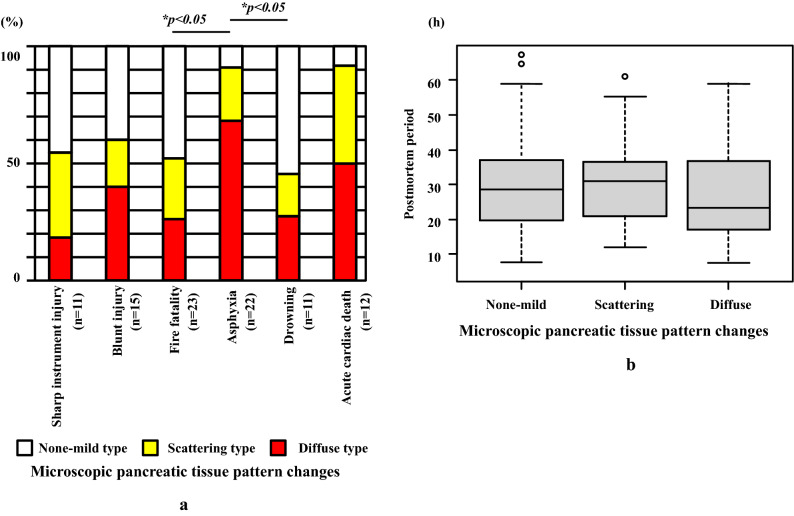
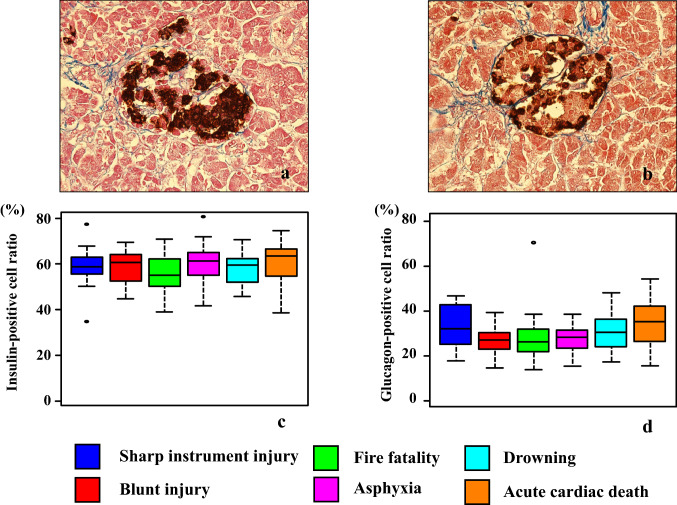
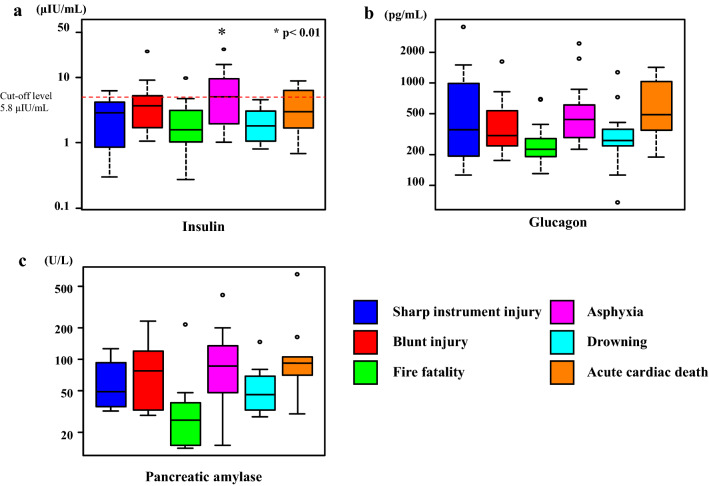
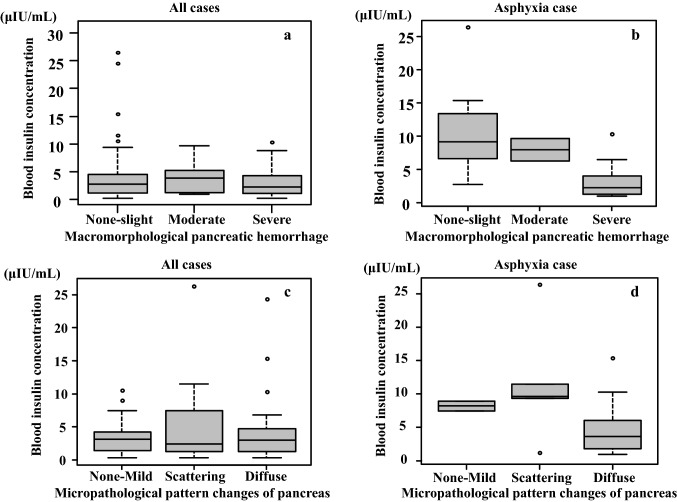
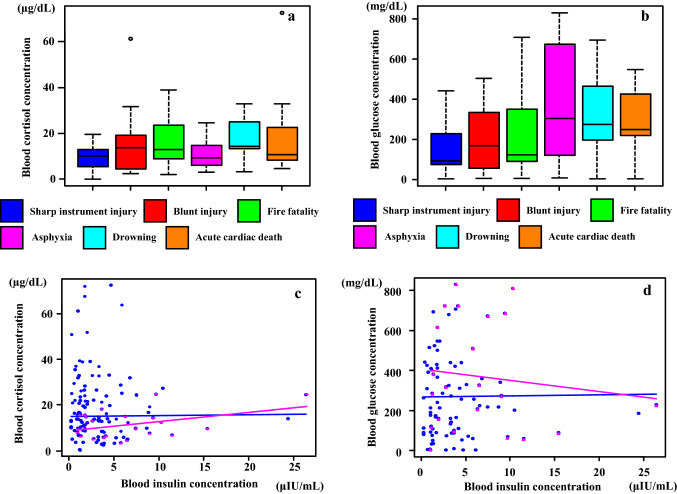
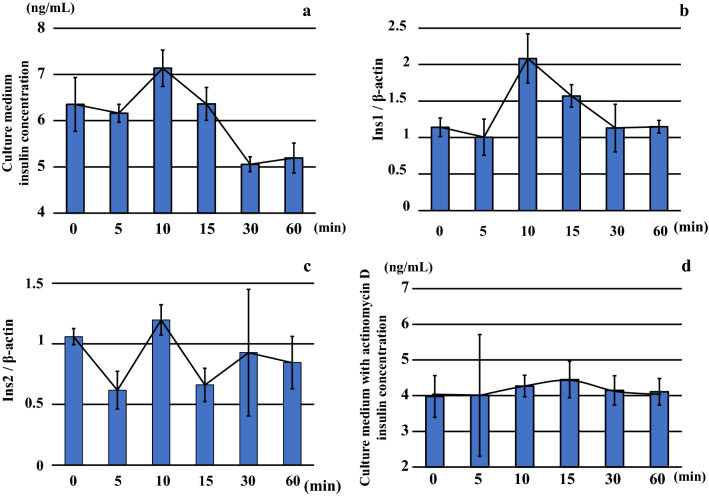
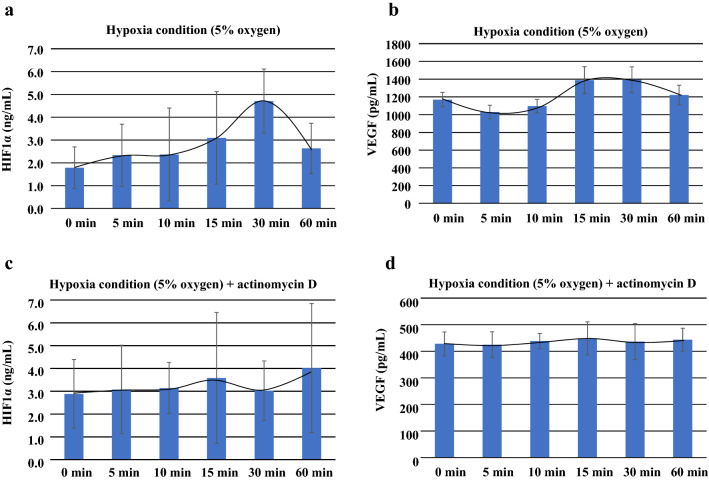
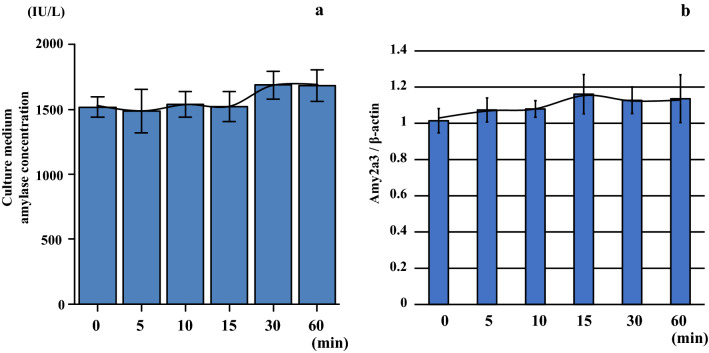
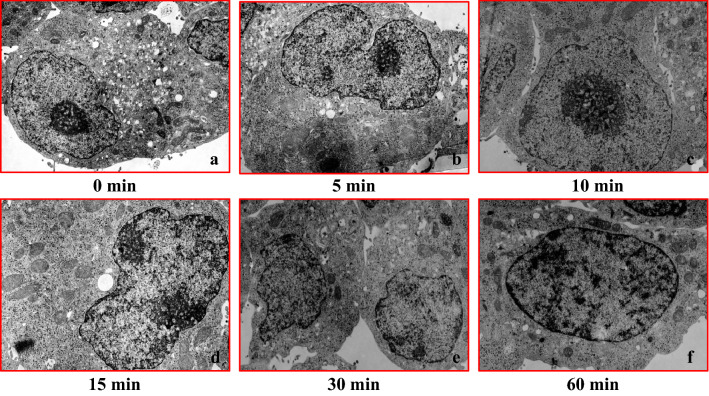
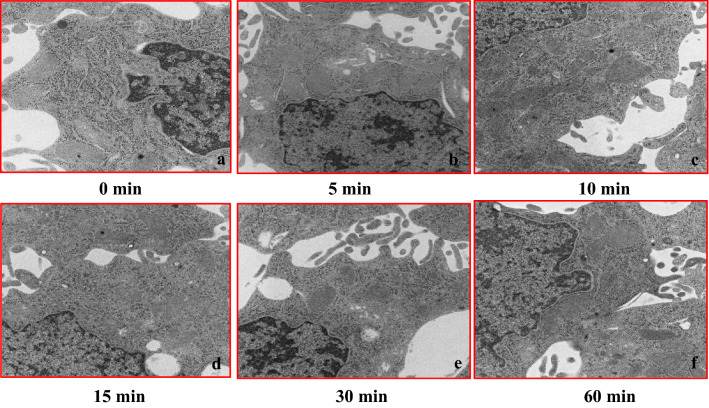
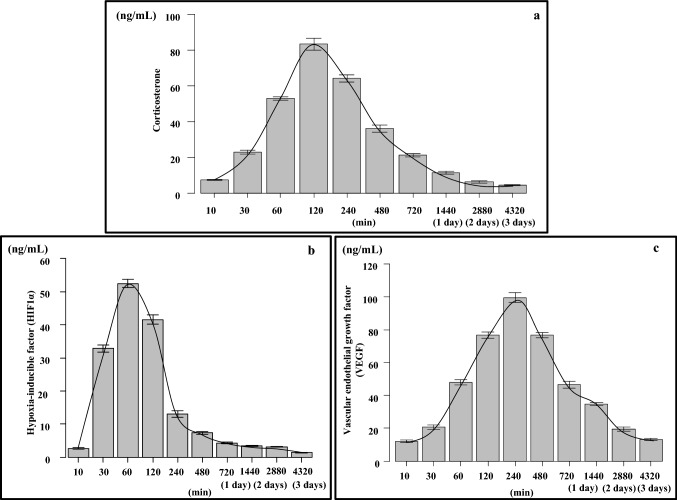
This study aimed to investigate the changes associated with acute systemic hypoxia in the endocrine system, particularly in pancreatic tissues. The investigation was based on macroscopic, pathohistological, biochemical, and molecular biological findings in cell lines and human cadavers. The results showed that cases of death due to asphyxia more frequently showed severe subcapsular/interstitial hemorrhage versus the other causes of death. Histological examination showed that asphyxia cases were associated with severe morphological changes. Although measured insulin levels in the asphyxia were higher compared to other causes of death, no differences were noted for the glucagon and amylase levels with regard to the cause of death. Increased blood insulin levels were not associated with macro- and micromorphological changes, and did not show any association with glucose or cortisol levels. The experiment conducted under hypoxic conditions in cultured cells demonstrated that insulin mRNA expression and insulin protein levels peaked at 10 min after hypoxia exposure. However, there were no changes in either the amylase mRNA or protein levels. Corticosterone level peaked at 120 min after exposure to hypoxic conditions. Overall, acute systemic hypoxic conditions can directly affect the mechanisms involved in pancreatic insulin secretion.

Keywords: Cell culture; Cortisol; Glucose; Hypoxia; Insulin.


Conflict of interest statement

The authors declare they have no conflict of interest.

Figures

Fig. 1
Fig. 1
a Macromorphological findings showing pancreatic subcapsular/interstitial hemorrhage without parenchymal injury. b Panels (i)–(iii) show each of the histological findings (a: none to mild type, b: scattering type, c: diffuse type). Figure indicates (i) male in his 50 s, asphyxia, postmortem period 18 h; (ii) female in her 80 s, fire fatality, postmortem period 30 h; (iii) male in his 30 s, asphyxia, postmortem period 20 h
Fig. 2
Fig. 2
The figure shows the changes observed for the elapsed times for each of the extracted pancreas samples at autopsy. a 0 h after sampling, b 12 h after sampling, c 1 day after sampling, d 2 days after sampling, e 3 days after sampling, f 4 days after sampling
Fig. 3
Fig. 3
a Range and/or degree of macroscopic pancreatic subcapsular/interstitial hemorrhage according to the cause of death. Moderate to high scores (score of 2 and 3) were observed in the asphyxia cases. b Graph showing a ratio of macroscopic pancreatic tissue hemorrhage levels in the postmortem period. There was no significant relationship observed between the postmortem period and pancreatic hemorrhage degree (p > 0.05)
Fig. 4
Fig. 4
a Graph showing score ratios for microscopic pancreatic tissue pattern changes. Asphyxia cases exhibited a scattering and diffuse pattern (moderate to severe) as compared to the other causes of death. b Graph showing the ratio of the microscopic pancreatic tissue pattern changes in the postmortem period. There was no significant relationship between the postmortem period and microscopic pancreatic tissue pattern changes (p > 0.05)
Fig. 5
Fig. 5
The figure shows the insulin (a) and glucagon (b) immunostaining in the Langerhans cells of the pancreas. Immunohistochemical findings for the percentage of insulin-positive (c) and glucagon-positive (d) cells in the Langerhans cells. There were no significant differences for the percentage of insulin- or glucagon-positive cells found among all causes of death (p > 0.05)
Fig. 6
Fig. 6
Insulin (a), glucagon (b), and amylase (c) levels in the right heart blood according to the cause of death in the autopsy cases. Asphyxia cases show significantly higher blood insulin levels as compared to the other causes of death (*p < 0.01). No significant differences were observed for the blood glucagon and amylase levels in accordance with the cause of death (p > 0.05)
Fig. 7
Fig. 7
Comparison between macromorphological pancreatic hemorrhage levels and blood insulin levels in cases with pancreatic subcapsular/interstitial hemorrhage. There was no relationship observed between the hemorrhage levels and blood insulin levels (a: all cases, b: asphyxia cases) (p > 0.05). Histological comparison between the pattern changes in the tissue and blood insulin level in the pancreas. There was no relationship observed between the tissue pattern changes and the blood insulin level in the cases (c: all cases, d: asphyxia cases) (p > 0.05)
Fig. 8
Fig. 8
Blood cortisol (a) and glucose (b) concentrations according to the cause of death in autopsy cases. There was no relationship observed between the cortisol concentrations and causes of death (p > 0.05). Evaluation of the correlation between the blood cortisol (c), glucose (d), and the blood insulin concentrations revealed that there was no relationship between these groups [blue lines and circles: all cases (p > 0.05); red lines and triangles: asphyxia cases (p > 0.05)]
Fig. 9
Fig. 9
Insulin concentrations (a) and insulin mRNA levels, including Ins1 (b) and Ins2 (c), in the conditioned medium BRIN-BD11 cultured under hypoxic conditions (O2 5%). Insulin levels were highest after 10 min of incubation under hypoxic conditions. However, insulin levels gradually decreased after 15 min. With regard to insulin mRNA expressions, Ins1 expression increased after incubation for 10 min under hypoxic conditions. Ins2 expression did not exhibit any remarkable change under the hypoxic conditions as compared to that observed for Ins1 mRNA expression. Furthermore, after adding actinomycin D to the BRIN-BD11 cells, there was inhibition of the reproduction and transcription from the DNA. Results showed that the insulin exhibited low levels as compared to the actinomycin D non-addition experiment (d)
Fig. 10
Fig. 10
Graph shows the HIF1α and VEGF concentrations in the conditioned medium BRIN-BD11 that was cultured under hypoxic conditions. a Levels of HIF1α and VEGF, which were used as the hypoxia control markers for cellular function during the hypoxic conditions in the BRIN-BD11 cells, increased starting from 30 min in HIF1α. b The graph shows the VEGF concentrations from 15 min to 60 min, with the maximum reached from 15 min to 30 min. The figure also shows the HIF1α (c) and VEGF (d) levels after the addition of actinomycin D during the conditions of hypoxia. The addition of actinomycin D in the cultured cells during the hypoxia, led to smaller changes in both the HIF1α and VEGF
Fig. 11
Fig. 11
AR42J cells exhibited no increased amylase levels (a) or amylase mRNA (Amy2a3) levels (b) in the culture medium following incubation for 0–60 min under hypoxic conditions (O2 5%) at each of the respective time points
Fig. 12
Fig. 12
Transmission electron microscopy images of the BRIN-BD (rat islets) cell culture model during conditions of hypoxia (O2 5%). Cell structure remained normal until approximately 10 min after the hypoxia. However, mitochondrial swelling and nuclear structure collapse findings became apparent around 15 min after the hypoxia (hypoxic condition period: a 0 min, b 5 min, c 10 min, d 15 min, e 30 min, and f 60 min)
Fig. 13
Fig. 13
Transmission electron microscopy images of the AR42J (rat acinar cells) cell culture model during conditions of hypoxia (O2 5%). In the AR42J cells, there were no changes in the cell organelles as the hypoxia progressed as compared to the pancreatic internal secretion cells (BRIN-BD11), with the exception for mitochondrial edema (af)
Fig. 14
Fig. 14
Corticosterone (a), HIF1α (b), and VEGF (c) concentrations in the conditioned medium Y-1 cultured under hypoxic conditions (O2 1%). Corticosterone concentration levels were highest after 120 min of incubation under hypoxic conditions. HIF1α concentration levels were highest after 60 min, while the VEGF concentration levels were highest after 240 min of incubation under hypoxic conditions

References

    1. Kimura H, Ota H, Kimura Y, Takasawa S. Effects of intermittent hypoxia on pulmonary vascular and systemic diseases. Int J Environ Res Public Health. 2019;16:3101. - PMC - PubMed
    1. Prisby RD. Mechanical, hormonal and metabolic influences on blood vessels, blood flow and bone. J Endocrinol. 2017;235:R77–R100. - PMC - PubMed
    1. Xing J, Ying Y, Mao C, et al. Hypoxia induces senescence of bone marrow mesenchymal stem cells via altered gut microbiota. Nat Commun. 2018;9:2020. - PMC - PubMed
    1. Fisher DA. Endocrinology of fatal development. In: Kronenberg HM, Melmed S, Polonsky KS, Larsen PR, editors. Williams textbook of endocrinology. 11. Philadelphia, PA: Saunders; 2007. pp. 755–782.
    1. Fink G, Pfaff DW, Levine JE, editors. Handbook of Neuroendocrinology. 1. Cambridge (MA): Academic Press; 2011.

LinkOut - more resources