. 2021 Apr 5;218(4):e20202515.
doi: 10.1084/jem.20202515.

Persistent cellular immunity to SARS-CoV-2 infection

Affiliations

Persistent cellular immunity to SARS-CoV-2 infection

Gaëlle Breton et al. J Exp Med. .

Abstract

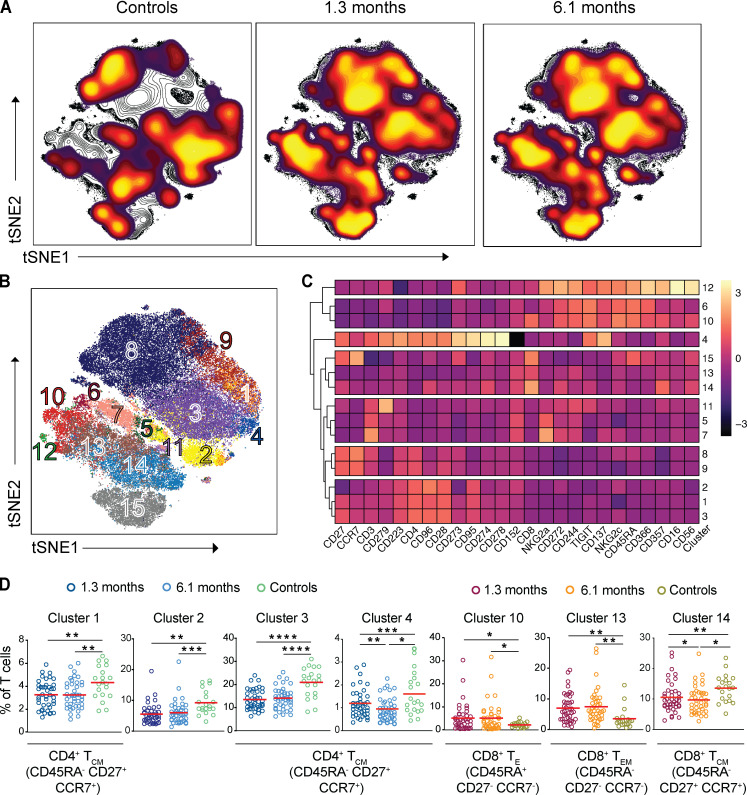
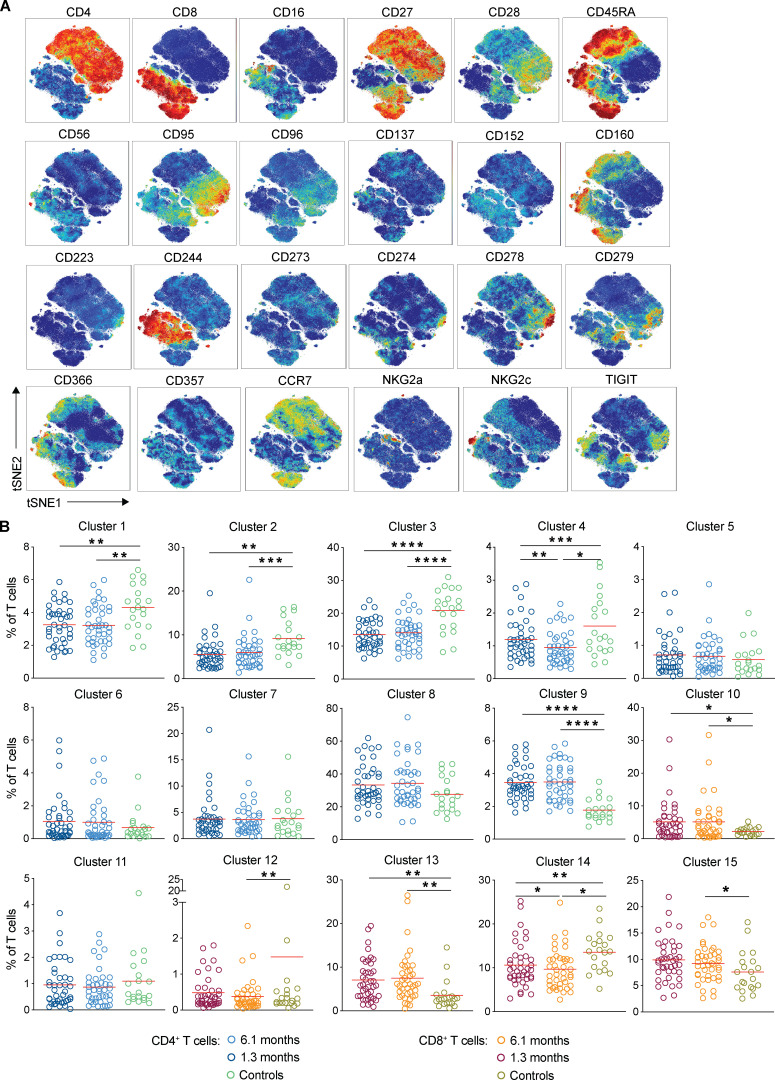
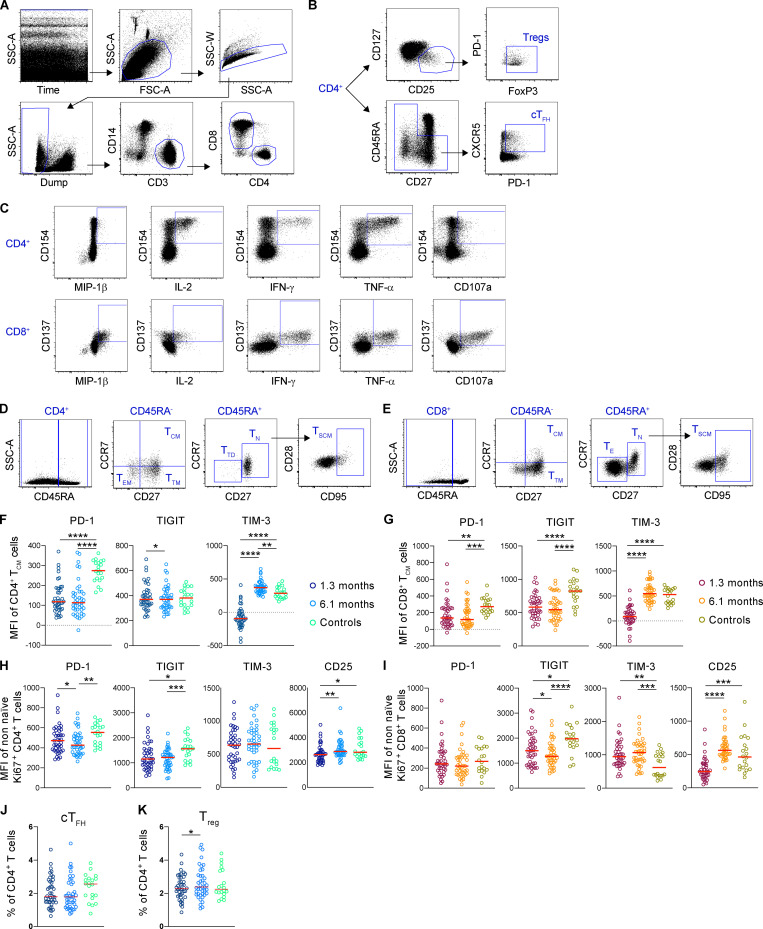
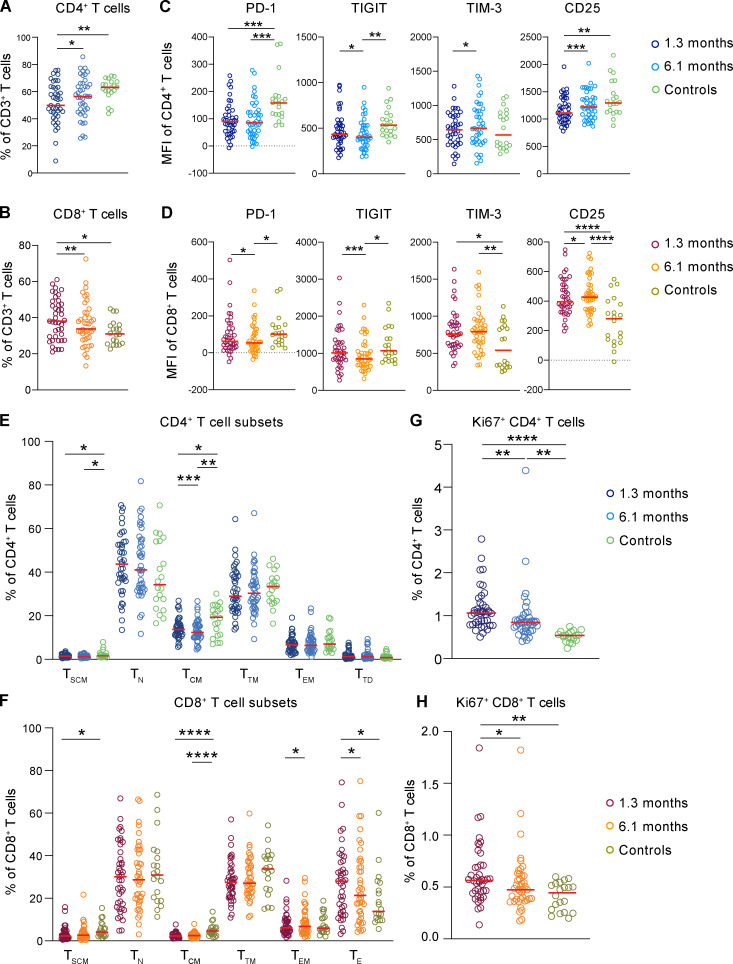
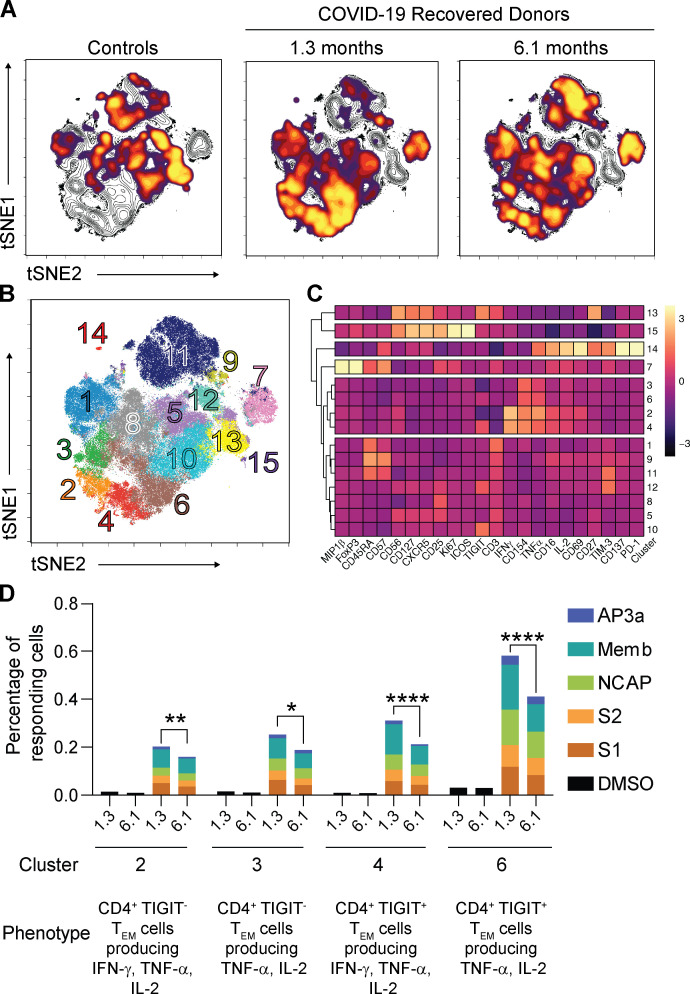
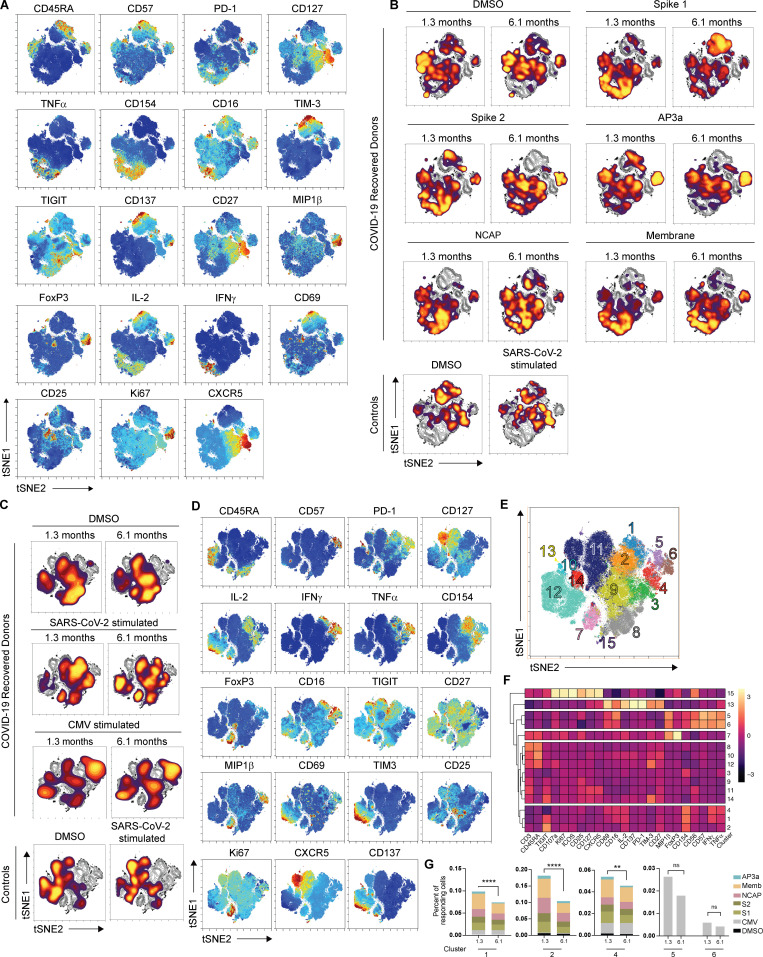
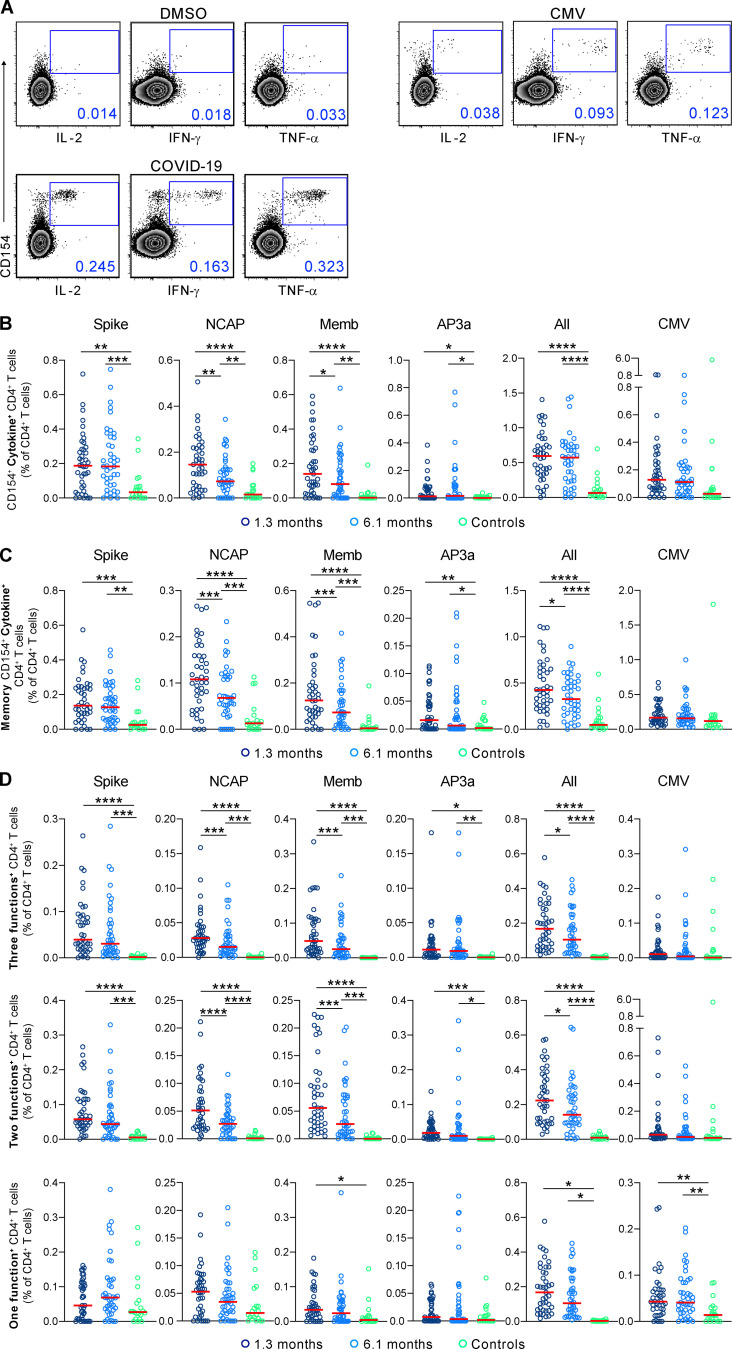
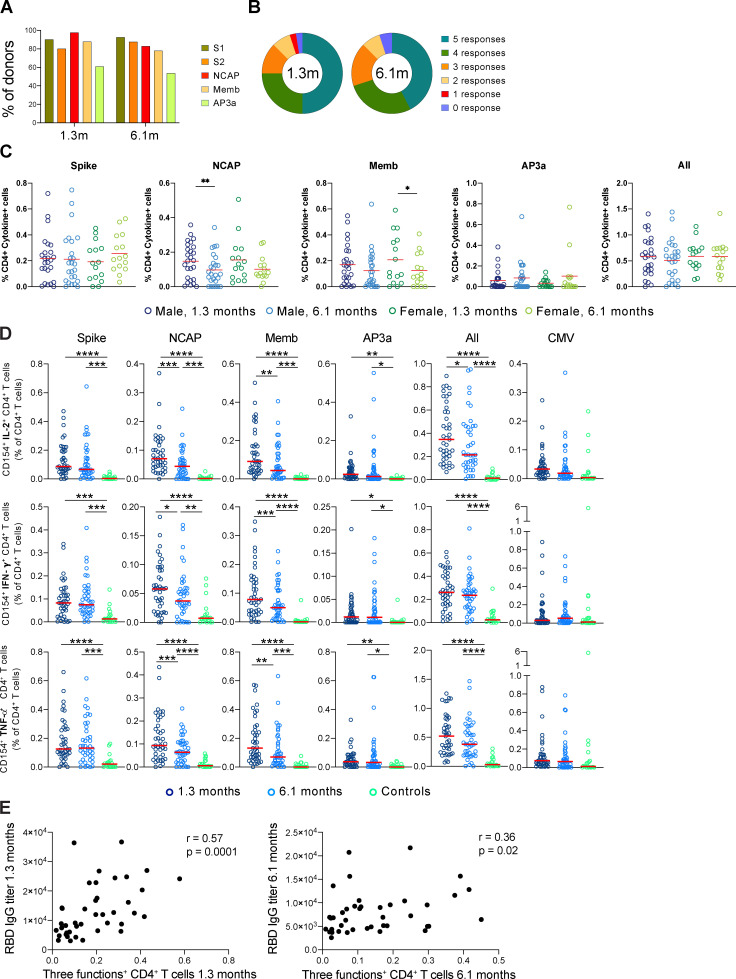
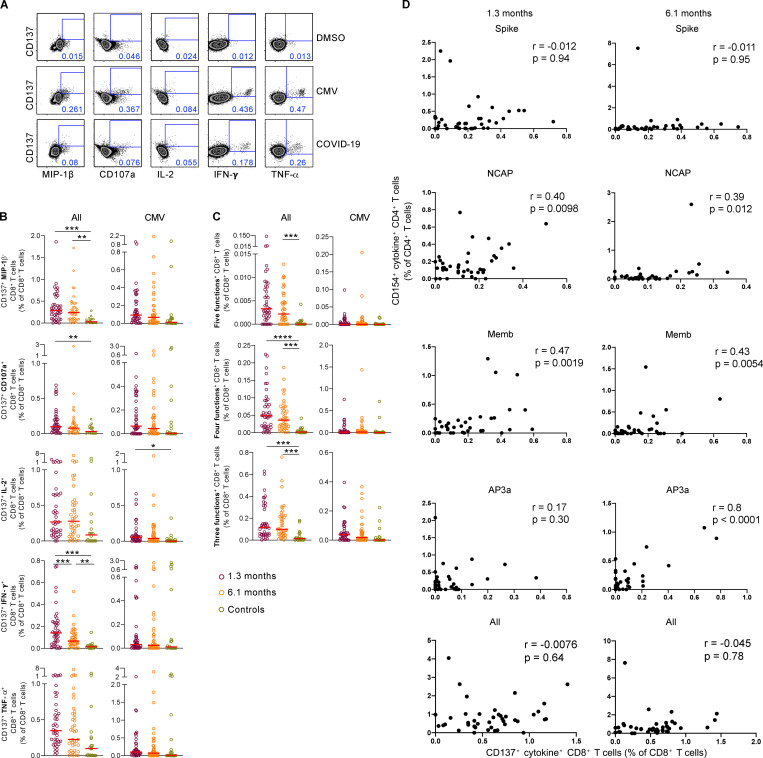
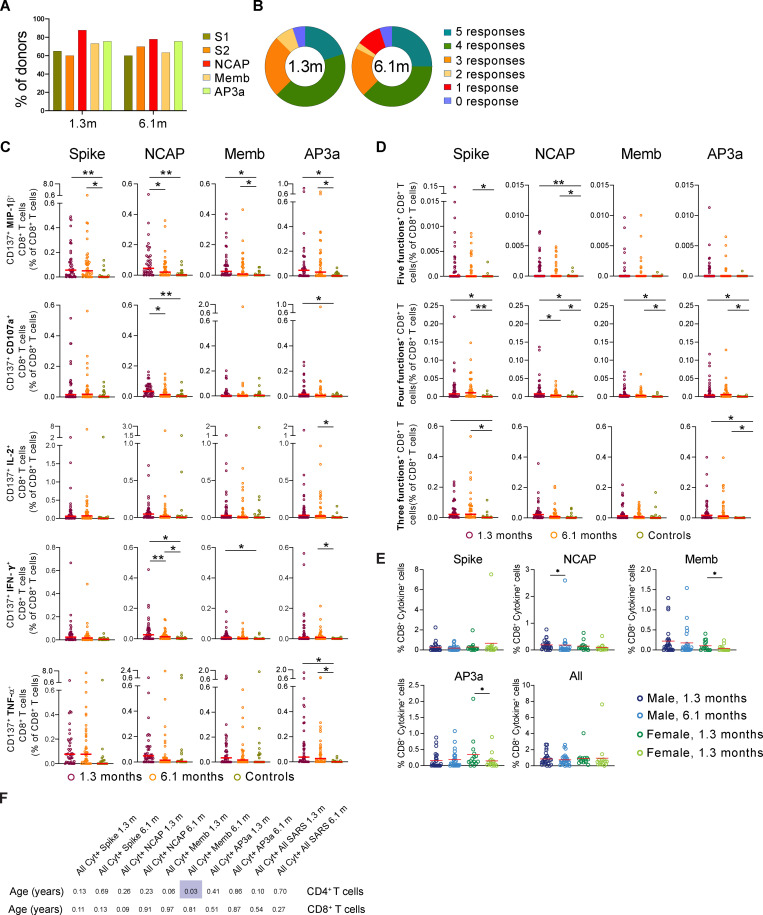
SARS-CoV-2 is responsible for an ongoing pandemic that has affected millions of individuals around the globe. To gain further understanding of the immune response in recovered individuals, we measured T cell responses in paired samples obtained an average of 1.3 and 6.1 mo after infection from 41 individuals. The data indicate that recovered individuals show persistent polyfunctional SARS-CoV-2 antigen-specific memory that could contribute to rapid recall responses. Recovered individuals also show enduring alterations in relative overall numbers of CD4+ and CD8+ memory T cells, including expression of activation/exhaustion markers, and cell division.


Conflict of interest statement

Disclosures: M.C. Nussenzweig reported a patent to SARS-2 monoclonal antibodies pending. No other disclosures were reported.

Figures

Figure 1.
Figure 1.
Persistent longitudinal changes in the phenotypic landscape of T cells in individuals recovered from COVID-19. (A) Global viSNE projection of pooled T cells for all participants pooled (controls, n = 20; COVID-19–convalescent individuals, n = 41) shown in background contour plots, with overlaid projections of concatenated controls, convalescent patients at 1.3 mo, and convalescent patients at 6.1 mo, respectively. (B) viSNE projection of pooled T cells for all participants of T cell clusters identified by FlowSOM clustering. (C) Column-scaled z-scores of MFI as indicated by cluster and marker. (D) Frequency of T cells from each group in FlowSOM clusters indicated. Each dot represents an individual with COVID-19 at 1.3 mo (dark blue for CD4+ T cells and dark red for CD8+ T cells) or 6.1 mo (light blue for CD4+ T cells and orange for CD8+ T cells) as well as control individuals (green). *, P < 0.05; **, P < 0.01; ***, P < 0.001; ****, P < 0.0001.
Figure S1.
Figure S1.
Persistent longitudinal changes in the phenotypic landscape of T cells in individuals recovered from COVID-19, related to Fig. 1. (A) viSNE projections of the indicated protein expression. (B) Frequency of T cells from each group in FlowSOM clusters indicated. *, P < 0.05; **, P < 0.01; ***, P < 0.001; ****, P < 0.0001.
Figure S2.
Figure S2.
Gating strategy and phenotyping of CD4+ and CD8+ T cells and their subsets in the peripheral blood of COVID-19 infected individuals. (A) Gating strategy of total CD4+ and CD8+ T cells. Dump channel includes CD19, CD20, and CD66b as well as Live/Dead. CD4+ T cells are identified as DumpCD14CD3+CD4+, whereas CD8+ T cells are DumpCD14CD3+CD8+. (B) Gating strategy of cTFH cells and T reg cells. cTFH cells are gated as nonnaive CD4+ T cells that express PD-1 and CXCR5. T reg cells are CD4+CD25+CD127dim FoxP3+ T cells. (C) Representative flow cytometry plots showing the cytokine production (MIP-1β, IL-2, IFN-γ, TNF-α, and CD107a) of CD4+ and CD8+ T cells after Staphylococcus enterotoxin B stimulation. (D and E) Flow cytometry gating strategy to identify CD4+ (D) and CD8+ (E) T cell subsets. TSCM (stem cell memory), TN (naive), TCM, TTM (transitional memory), TEM, and TTD (terminally differentiated)/TE cell subsets are identified based on their CD45RA, CCR7, CD27, and CD95 expression. (F) PD-1, TIGIT, and TIM-3 expression of CD4+ central memory T cells. (G) PD-1, TIGIT, and TIM-3 expression of CD8+ central memory T cells. (H) PD-1, TIGIT, TIM-3, and CD25 expression of CD4+ cycling T cells (Ki67+). (I) PD-1, TIGIT, TIM-3, and CD25 expression of CD8+ cycling T cells (Ki67+). (J and K) cTFH cell (J) and T reg cell (K) relative numbers. Each dot represents a COVID-19–convalescent individual (n = 41) at 1.3 mo (dark blue) or 6.1 mo (light blue) or control individuals (n = 20; green). Significance was determined by paired t test for comparisons between time points within individuals and unpaired t test for comparison between unexposed and COVID-19 individuals. *, P < 0.05; **, P < 0.01; ***, P < 0.001; ****, P < 0.0001. SSC-A, side scatter area; SSC-W, side scatter width; FSC-A, forward scatter area.
Figure 2.
Figure 2.
Persistent changes after 6.1 mo. (A) Frequency of CD4+ T cells out of total CD3+ T cells. (B) Frequency of CD8+ T cells out of total CD3+ T cells. (C) PD-1, TIGIT, TIM-3, and CD25 expression of CD4+ T cells. (D) PD-1, TIGIT, TIM-3, and CD25 expression of CD8+ T cells. (E) Percentage of TSCM (stem cell memory), TN (naive), TCM , TTM (transitional memory), TEM, and TTD (terminally differentiated) CD4+ T cells. (F) Percentage of TSCM, TN, TCM, TTM, TEM, and TE CD8+ T cells. (G) Frequency of cycling Ki67+ CD4+ T cells. (H) Frequency of cycling Ki67+ CD8+ T cells. Each dot represents an individual with COVID-19 (n = 41) at 1.3 mo (dark blue for CD4+ T cells and dark red for CD8+ T cells) or 6.1 mo (light blue for CD4+ T cells and orange for CD8+ T cells) as well as control individuals (n = 20; green). Significance determined by paired t test for comparisons between time points within individuals and unpaired t test for comparison between controls and COVID-19 individuals. *, P < 0.05; **, P < 0.01; ***, P < 0.001; ****, P < 0.0001.
Figure 3.
Figure 3.
Antigen-specific CD4+ T cells dynamics in COVID-19–convalescent individuals. (A) viSNE representations of CD137+ CD154+ SARS-CoV-2-stimulated CD4+ T cells in unexposed individuals (controls, n = 20) and COVID-19 convalescent individuals (n = 41) pooled. Density plots from each group concatenated is overlaid on the total contour viSNE plot. (B) viSNE representation of antigen-specific CD4+ T cell clusters, identified by FlowSOM clustering. (C) Column-scaled z-scores of MFI as indicated by cluster and marker. (D) Percentage of antigen-specific CD4+ cells in the indicated FlowSOM clusters. Each bar represents the mean percentage for all COVID-19–convalescent individuals for the indicated SARS-CoV-2 peptide pools. *, P < 0.05; **, P < 0.01; ****, P < 0.0001.
Figure S3.
Figure S3.
Antigen-specific CD4+ T cell dynamics responding to individual SARS-CoV-2 peptide pools and CMV in COVID-19–convalescent individuals. (A) viSNE projections of CD137+CD154+ SARS-CoV-2–stimulated CD4+ T cells in controls (n = 20) and COVID-19–convalescent individuals (n = 41) pooled, related to Fig. 3, with the indicated protein expression shown. (B) viSNE representations of CD137+CD154+ SARS-CoV-2–stimulated CD4+ T cells in COVID-19–convalescent individuals and controls pooled, related to Fig. 3. Density plots from COVID-19–recovered donors show responses to the DMSO control and to each individual SARS-CoV-2 peptide pool; and plots from controls show responses to the DMSO control and all SARS-CoV-2 peptide pools combined. Density plots are overlaid on the total contour viSNE plot. (C) viSNE representations of CD137+CD154+CD4+ T cells, including samples from stimulations with SARS-CoV-2 or CMV in controls (n = 20) and COVID-19–convalescent individuals (n = 41) pooled. Density plots from each group concatenated are overlaid on the total contour viSNE plot. (D) viSNE representation of each indicated marker expression, related to Fig. S3 C. (E) viSNE representation of CD137+CD154+CD4+ T cell clusters, identified by FlowSOM clustering, related to Fig. S3 C. (F) MFI for indicated markers, column-normalized z-score, related to Fig. S3 C. (G) Percentage of CD137+CD154+CD4+ cells in the indicated FlowSOM clusters. Each bar represents the mean percentage for all COVID-19 convalescent individuals for the indicated SARS-CoV-2 peptide pools or CMV, related to Fig. S3 C. *, P < 0.05; **, P < 0.01; ***, P < 0.001; ****, P < 0.0001; ns, not significant.
Figure 4.
Figure 4.
SARS-CoV-2–specific CD4+ T cells responses in COVID-19–convalescent individuals. Longitudinal analysis of COVID-19–specific CD4+ T cell responses in paired samples obtained 1.3 mo and 6.1 mo after infection. Cytokine production (IL-2, IFN-γ, and TNF-α) by CD4+ T cells analyzed by intracellular cytokine staining. Spike (aggregation of responses to Spike peptide pool S1 and S2), NCAP, Memb, and nonstructural AP3a peptide pools responses by controls (n = 20) and COVID-19–convalescent individuals (n = 41). (A) Gating strategy for identification of SARS-CoV-2–specific CD4+ T cells. (B) Combined frequency of SARS-CoV-2–specific CD4+ T cells that produce IL-2, IFN-γ, and/or TNF-α. (C) Frequency of SARS-CoV-2–specific memory CD4+ T cells (CD45RACD27+) that produce IL-2, IFN-γ, and/or TNF-α. (D) Frequency of SARS-CoV-2–specific CD4+ T cells that produce three cytokines, two cytokines, or one cytokine. Each dot represents an individual with COVID-19 (n = 41) at 1.3 mo (dark blue) or 6.1 mo (light blue) or control individuals (n = 20; green). Significance was determined by paired t test for comparisons between time points within individuals and unpaired t test for comparison between controls and COVID-19 individuals. *, P < 0.05; **, P < 0.01; ***, P < 0.001; ****, P < 0.0001.
Figure S4.
Figure S4.
SARS-CoV-2–specific CD4+ T cell responses in COVID-19–convalescent individuals, related to Fig. 4. (A) Percentage of COVID-19 individuals (n = 41) who respond to Spike (responses to Spike peptide pool S1 and S2), NCAP, Memb, and nonstructural AP3a peptide pools at 1.3 or 6.1 mo. (B) Pie chart shows the frequency of recovered COVID-19 individuals (n = 41) who respond to one, two, three, four, or five peptide pools. (C) Frequency of cytokine-expressing cells among CD4+ T cells following stimulation with indicated peptide and all frequencies pooled, for indicated sex and time point. (D) Frequency of SARS-CoV-2–specific CD4+ T cells that produce IL-2, IFN-γ, or TNF-α. Each dot represents an individual with COVID-19 at 1.3 mo (dark blue) or 6.1 mo (light blue) or control individuals (green). (E) Normalized area under the curve for IgG anti-RBD plotted against the relative frequency of CD4+ T cells producing three cytokines (three functions). The r and P values were determined by two-tailed Spearman’s correlations. Significance (C and D) was determined by paired t test for comparisons between time points within individuals and unpaired t test for comparison between controls (n = 20) and COVID-19 individuals (n = 41). *, P < 0.05; **, P < 0.01; ***, P < 0.001; ****, P < 0.0001.
Figure 5.
Figure 5.
SARS-CoV-2–specific CD8+ T cells responses in COVID-19–convalescent individuals. Longitudinal analysis of COVID-19–specific CD8+ T cell responses in paired samples obtained from the same individual at 1.3 and 6.1 mo after infection. Cytokine production (MIP-1β, CD107a, IL-2, IFN-γ, and TNF-α) by CD8+ T cells analyzed by intracellular cytokine staining. Spike (aggregation of responses to Spike peptide pool S1 and S2), NCAP, Memb, and nonstructural AP3a peptide pools responses by controls (n = 20) and convalescent COVID-19 individuals (n = 41). (A) Gating strategy for identification of SARS-CoV-2–specific CD8+ T cells. (B) Frequency of SARS-CoV-2–specific CD8+ T cells that produce MIP-1β, CD107a, IL-2, IFN-γ, or TNF-α. (C) Frequency of SARS-CoV-2–specific CD8+ T cells that produce five cytokines, four cytokines, or three cytokines. Each dot represents an individual with COVID-19 (n = 41) at 1.3 mo (dark red) or 6.1 mo (orange) or control individuals (n = 20; green). Significance determined by paired t test for comparisons between time points within individuals and unpaired t test for comparison between controls and COVID-19 individuals. *, P < 0.05; **, P < 0.01; ***, P < 0.001; ****, P < 0.0001. (D) Frequency of CD154+ cytokine+ CD4+ T cells versus frequency of CD137+ cytokine+ CD8+ T cells after stimulation with indicated peptide. The r and P values were determined by two-tailed Spearman correlations.
Figure S5.
Figure S5.
SARS-CoV-2–specific CD8+ T cell responses in COVID-19–convalescent individuals, related to Fig. 5. (A) Percentage of COVID-19 individuals (n = 41) who respond to Spike (responses to Spike peptide pool S1 and S2), NCAP, Memb, and nonstructural AP3 peptide pools at 1.3 or 6.1 mo. (B) Pie chart shows the frequency of mild COVID-19 individuals who have CD8+ responses to one, two, three, four, or five peptide pools. (C) Frequency of SARS-CoV-2–specific CD8+ T cells that produce either MIP-1β, CD107a, IL-2, IFN-γ, or TNF-α. (D) Frequency of SARS-CoV-2–specific CD8+ T cells that produce five, four, or three cytokines. Each dot represents an individual with COVID-19 at 1.3 mo (dark red) or 6.1 mo (orange) or unexposed individuals (green). (E) Frequency of cytokine-expressing cells among CD8+ T cells following stimulation with indicated peptide and all frequencies pooled, for indicated sex and time point. (F) P values for correlations between age and antigen-specific CD4+ and CD8+ T cells. Significance was determined by paired t test for comparisons between time points within individuals and unpaired t test for comparison between controls (n = 20) and COVID-19 individuals (n = 41). *, P < 0.05; **, P < 0.01.

Update of

Comment in

References

    1. Betts, M.R., Nason M.C., West S.M., De Rosa S.C., Migueles S.A., Abraham J., Lederman M.M., Benito J.M., Goepfert P.A., Connors M., et al. . 2006. HIV nonprogressors preferentially maintain highly functional HIV-specific CD8+ T cells. Blood. 107:4781–4789. 10.1182/blood-2005-12-4818 - DOI - PMC - PubMed
    1. Braun, J., Loyal L., Frentsch M., Wendisch D., Georg P., Kurth F., Hippenstiel S., Dingeldey M., Kruse B., Fauchere F., et al. . 2020. SARS-CoV-2-reactive T cells in healthy donors and patients with COVID-19. Nature. 587:270–274. 10.1038/s41586-020-2598-9 - DOI - PubMed
    1. Breton, G., Chomont N., Takata H., Fromentin R., Ahlers J., Filali-Mouhim A., Riou C., Boulassel M.R., Routy J.P., Yassine-Diab B., and Sékaly R.P.. 2013. Programmed death-1 is a marker for abnormal distribution of naive/memory T cell subsets in HIV-1 infection. J. Immunol. 191:2194–2204. 10.4049/jimmunol.1200646 - DOI - PMC - PubMed
    1. Channappanavar, R., Fett C., Zhao J., Meyerholz D.K., and Perlman S.. 2014. Virus-specific memory CD8 T cells provide substantial protection from lethal severe acute respiratory syndrome coronavirus infection. J. Virol. 88:11034–11044. 10.1128/JVI.01505-14 - DOI - PMC - PubMed
    1. Chen, Z., and John Wherry E.. 2020. T cell responses in patients with COVID-19. Nat. Rev. Immunol. 20:529–536. 10.1038/s41577-020-0402-6 - DOI - PMC - PubMed

Publication types