. 2021 Apr 5;218(4):e20201387.
doi: 10.1084/jem.20201387.

SARS-CoV-2 induces human plasmacytoid predendritic cell diversification via UNC93B and IRAK4

Affiliations

SARS-CoV-2 induces human plasmacytoid predendritic cell diversification via UNC93B and IRAK4

Fanny Onodi et al. J Exp Med. .

Abstract

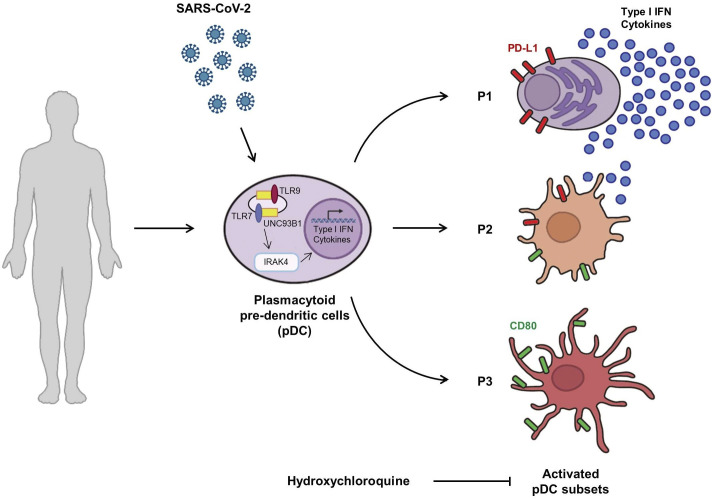
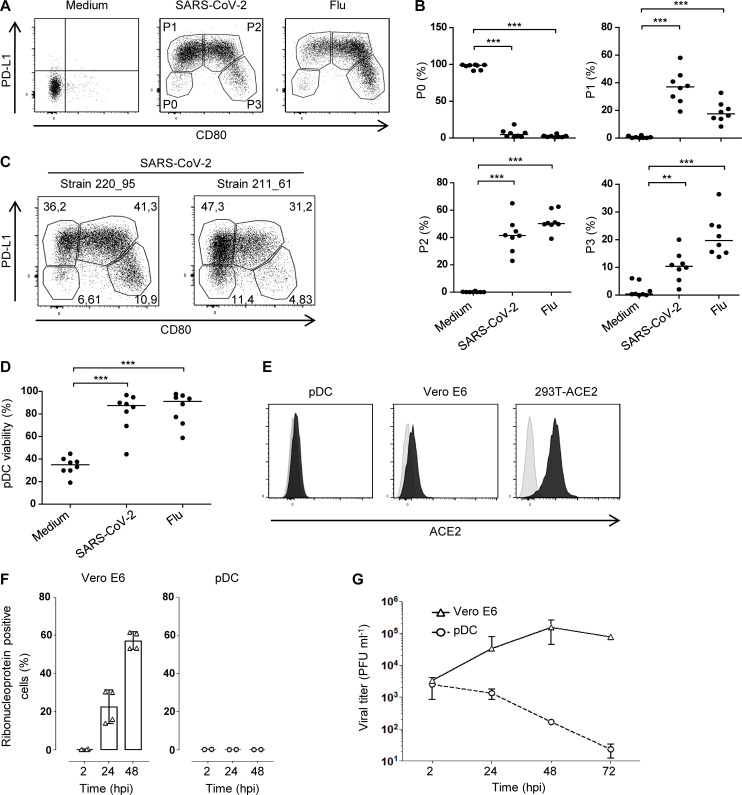
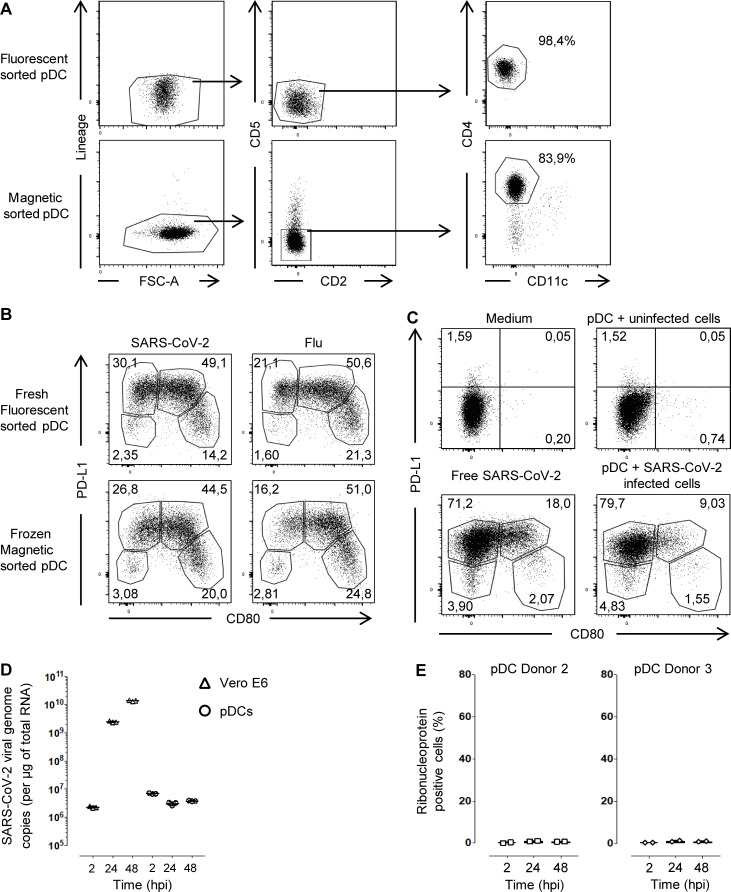
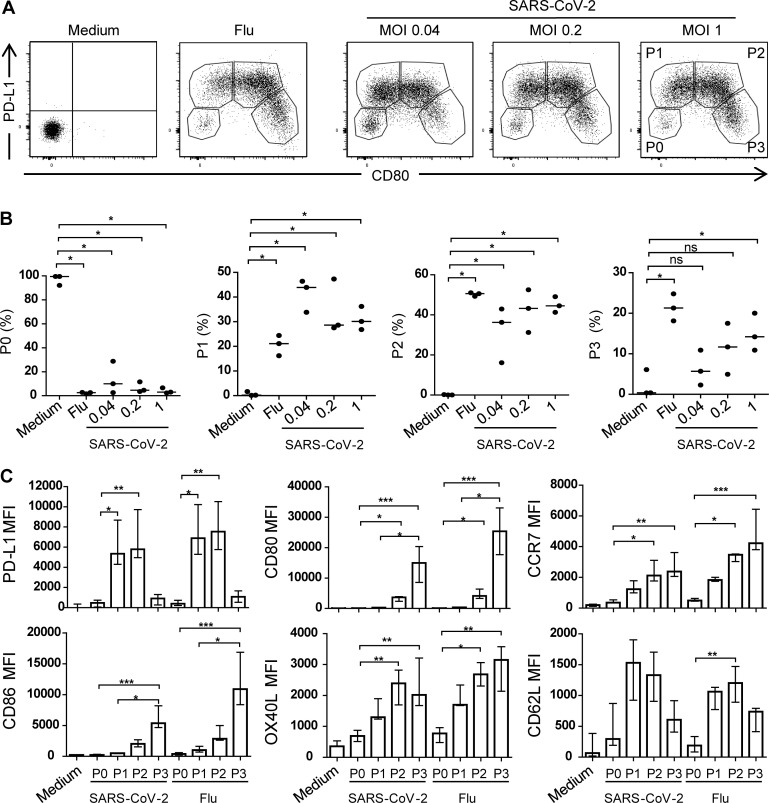
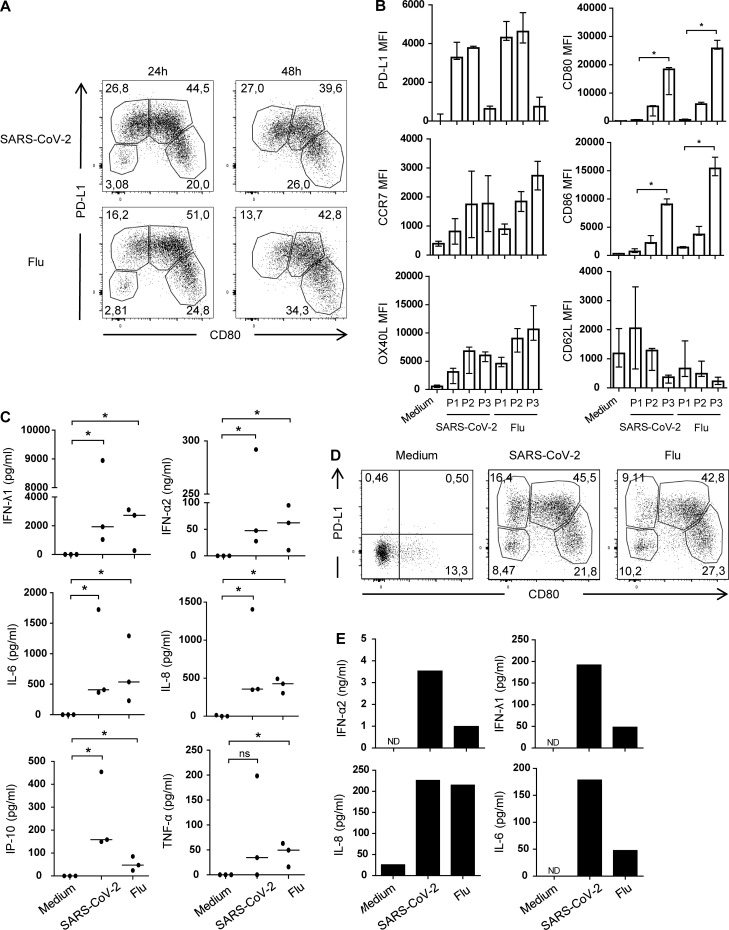
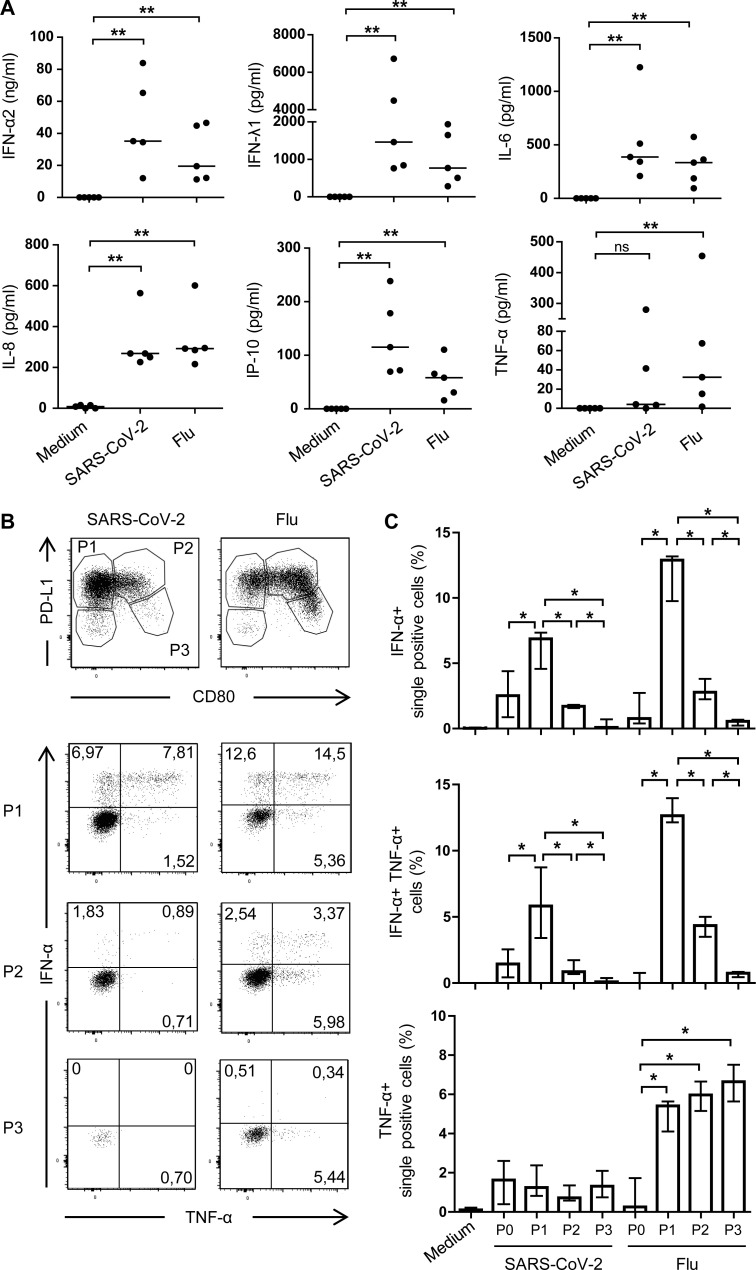
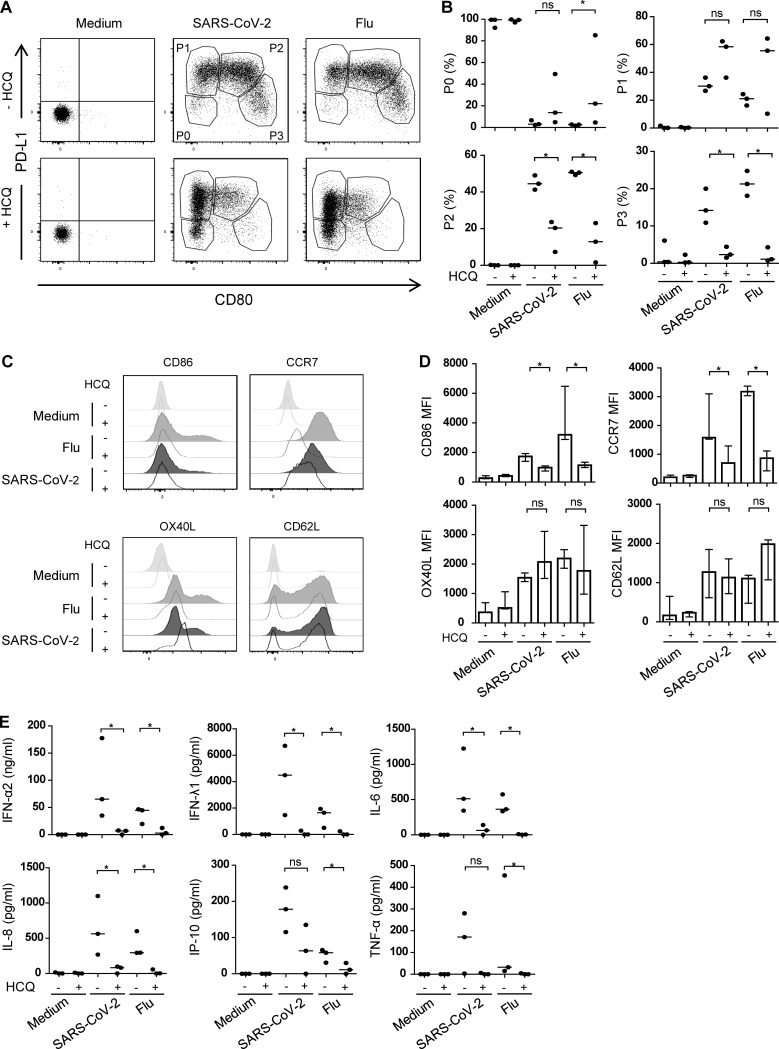
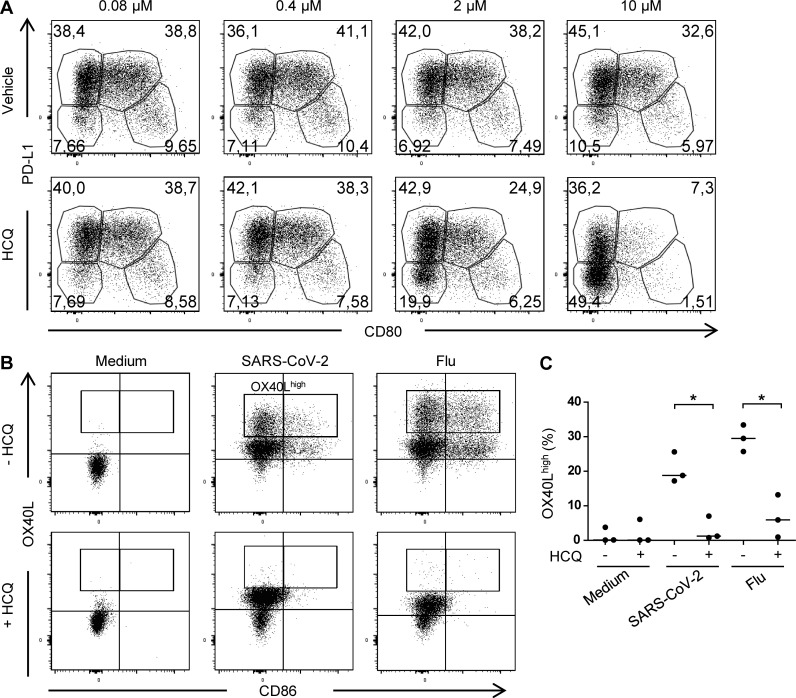
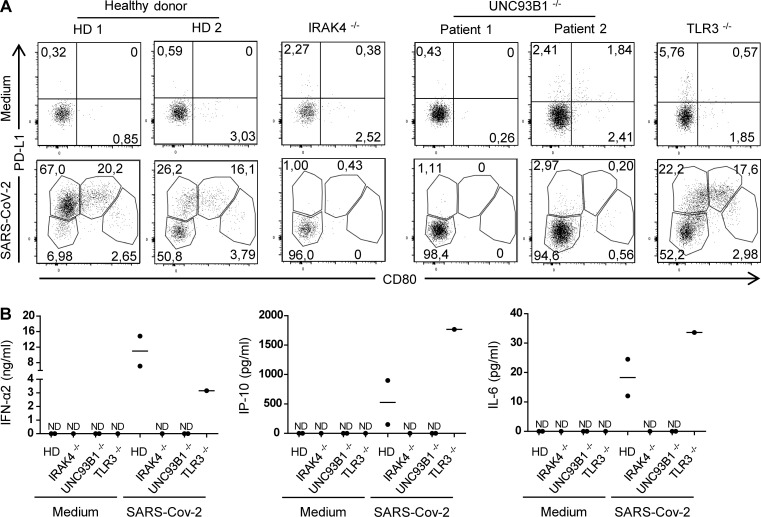
Several studies have analyzed antiviral immune pathways in late-stage severe COVID-19. However, the initial steps of SARS-CoV-2 antiviral immunity are poorly understood. Here we have isolated primary SARS-CoV-2 viral strains and studied their interaction with human plasmacytoid predendritic cells (pDCs), a key player in antiviral immunity. We show that pDCs are not productively infected by SARS-CoV-2. However, they efficiently diversified into activated P1-, P2-, and P3-pDC effector subsets in response to viral stimulation. They expressed CD80, CD86, CCR7, and OX40 ligand at levels similar to influenza virus-induced activation. They rapidly produced high levels of interferon-α, interferon-λ1, IL-6, IP-10, and IL-8. All major aspects of SARS-CoV-2-induced pDC activation were inhibited by hydroxychloroquine. Mechanistically, SARS-CoV-2-induced pDC activation critically depended on IRAK4 and UNC93B1, as established using pDC from genetically deficient patients. Overall, our data indicate that human pDC are efficiently activated by SARS-CoV-2 particles and may thus contribute to type I IFN-dependent immunity against SARS-CoV-2 infection.


Conflict of interest statement

Disclosures: J.-M. Molina reported grants from Gilead and personal fees from Merck, ViiV, and Janssen outside the submitted work. V. Soumelis reported grants from Sanofi and Roche, and personal fees from Leo Pharma, Gilead, Merck, and Sanofi outside the submitted work. No other disclosures were reported.

Figures

None
Graphical abstract
Figure 1.
Figure 1.
SARS-CoV-2 induces activation and diversification of primary human pDCs. Sorted blood pDCs from healthy donors were cultured for 24 h with medium, SARS-CoV-2, or Flu. (A) Dot plot showing pDC activation and diversification through the expression of PD-L1 and CD80 into P1, P2, and P3 subpopulations. Results from one healthy donor representative of n = 8. (B) Quantification of the three populations. Bars represent medians of n = 8 healthy donors from six independent experiments. (C) Dot plot showing pDC activation from different strains of SARS-CoV-2 isolated from two patients. Results from one healthy donor representative of n = 3. (D) Percentage of live pDCs after 24 h of culture with medium, SARS-CoV-2, or Flu. n = 8 healthy donors from six independent experiments. (E) Histogram of ACE2 expression on pDCs, Vero E6, and 293T-ACE2 (black) compared with the isotype (light gray). Results from one experiment representative of n = 3. (F) Intracellular production of SARS-CoV-2 ribonucleoprotein in Vero E6 and pDCs at 2, 24, or 48 h post-infection (hpi) with SARS-CoV-2. Results from one experiment representative of n = 3. (G) Infectious viral titers in the supernatants of SARS-CoV-2–infected Vero E6 and pDCs at 2, 24, 48, or 72 hpi. Results from one experiment representative of n = 3. **, P < 0.01; ***, P < 0.005; Mann–Whitney test.
Figure S1.
Figure S1.
SARS-CoV-2 induces pDC activation. Sorted blood pDCs from healthy donors were cultured for 24 h with medium, SARS-CoV-2, or Flu. (A) Percentage of pure pDCs among live cells through different sorting strategies. Results from two healthy donors representative of n = 8. (B) P1, P2, and P3 diversification of fresh, fluorescent-sorted pDCs versus frozen, magnetic-sorted pDCs with either SARS-CoV-2 or Flu for 24 h. Results from two healthy donors representative of n = 8. (C) Dot plot of pDC activation with either free SARS-CoV-2 or pDC co-culture with SARS-CoV-2–infected cells. Results from n = 1 healthy donors. (D) Viral RNA copy number of Vero E6 and pDCs 2, 24, and 48 h post-infection (hpi). Results from one experiment representative of n = 3. (E) Intracellular production of the nucleoprotein antigen (N) on pDCs of two healthy donors of n = 3. FSC-A, forward scatter area.
Figure 2.
Figure 2.
SARS-CoV-2 induces pDC activation in a dose-dependent manner. Sorted blood pDCs from healthy donors were cultured for 24 h with medium, Flu, or SARS-CoV-2 at an MOI of 0.04, 0.2, or 1. (A) Dot plot showing pDC activation through the expression of PD-L1 and CD80. Results from one healthy donor representative of n = 3. (B) Quantification of the three populations. Bars represent medians of n = 3 healthy donors from three independent experiments. (C) pDC geometric mean (mean fluorescence intensity [MFI]) of activation markers after 24 h of culture with medium, Flu, or SARS-CoV-2 at an MOI of 1. Histograms represent medians and bars interquartile ranges of n = 5 healthy donors from three independent experiments. *, P < 0.05; **, P < 0.01; ***, P < 0.001; Mann–Whitney test (B); Kruskal–Wallis with Dunn’s multiple comparisons posttest (C). ns, not significant.
Figure S2.
Figure S2.
SARS-CoV-2 induces activation and diversification of tonsilar pDCs. Sorted blood pDCs from healthy donors were cultured for 48 h with medium, SARS-CoV-2, or Flu. (A) Dot plot showing pDC activation and diversification through the expression of PD-L1 and CD80 at 24 h and 48 h. Results from one healthy donor representative of n = 3. (B) Geometric mean (mean fluorescence intensity [MFI]) of pDCs’ activation markers at 48 h. Histograms represent medians and bars interquartile ranges of n = 3 healthy donors from three independent experiments. (C) Quantification of secreted pro-inflammatory cytokines 48 h after culture. Bars represent medians of n = 3 healthy donors from three independent experiments. (D) Dot plot of tonsil pDC activation cultured for 24 h with medium, SARS-CoV-2, or Flu. Results from n = 1 healthy donors. (E) Quantification of pro-inflammatory cytokines of tonsilar pDCs at 24 h. Histograms represent medians of n = 1 healthy donor. *, P < 0.05; Kruskal–Wallis with Dunn’s multiple comparisons post-test (B); Mann–Whitney test (C). ND, not detectable; ns, not significant.
Figure 3.
Figure 3.
SARS-CoV-2–activated pDCs produce pro-inflammatory cytokines. Sorted blood pDCs from healthy donors were cultured for 24 h with medium, Flu, or SARS-CoV-2. (A) Quantification of secreted pro-inflammatory cytokines after 24 h of culture. Bars represent medians of n = 5 healthy donors from three independent experiments. (B) Dot plot showing pDC activation through the expression of PD-L1 and CD80 (upper plots), and intracellular IFN-α and TNF-α in P1, P2, or P3 populations (lower plots). Results from one healthy donor representative of n = 4. (C) Percentages of IFN-α single-positive, IFN-α+ TNF-α+ double-positive, and TNF-α single-positive cells in P0, P1, P2, or P3 populations. Histograms represent medians and bars interquartile ranges of n = 4 healthy donors from three independent experiments. *, P < 0.05; **, P < 0.01; Mann–Whitney test. ns, not significant.
Figure 4.
Figure 4.
SARS-CoV-2–induced pDC activation is inhibited by HCQ. Sorted blood pDCs from healthy donors were cultured for 24 h with medium, Flu, or SARS-CoV-2 at an MOI of 1 with or without the presence of HCQ. (A) Dot plot showing pDC diversification in P1, P2, and P3 subpopulations in the presence of HCQ. Results from one healthy donor representative of n = 3. (B) Quantification of the three populations. Bars represent medians of n = 3 healthy donors from three independent experiments. (C) Histograms of pDCs’ activation markers. Results from one healthy donor representative of n = 3. (D) Geometric mean (mean fluorescence intensity [MFI]) of activation markers. Histograms represent medians and bars interquartile ranges of n = 3 healthy donors from three independent experiments. (E) Quantification of pro-inflammatory cytokines production. Bars represent medians of n = 3 healthy donors from three independent experiments. *, P < 0.05; Mann–Whitney test. ns, not significant.
Figure S3.
Figure S3.
HCQ inhibits SARS-CoV-2–induced pDC activation in a dose-dependent manner. Sorted blood pDCs from healthy donors were cultured for 24 h with medium, Flu, or SARS-CoV-2 at an MOI of 1 with HCQ or vehicle. (A) Dot plot of pDC diversification with increasing concentration of HCQ or vehicle. Results from one healthy donor representative of n = 3. (B) Dot plot showing OX40L and CD86 in the presence or absence of HCQ. Results from one healthy donor representative of n = 3. (C) Percentage of OX40Lhigh population among pDCs. Bars represent medians of n = 3 healthy donors from three independent experiments. *, P < 0.05; Mann–Whitney test.
Figure 5.
Figure 5.
SARS-CoV-2–induced pDC activation requires IRAK4 and UNC93B1. Sorted blood pDCs from mutated patients and healthy donors were cultured for 24 h with either medium or SARS-CoV-2. (A) Dot plot showing pDC diversification in P1, P2, and P3 subpopulations from magnetically sorted blood pDCs from homozygous IRAK4−/− (n = 1), UNC93B1−/− (n = 2), and TLR3−/− (n = 1) donors, and sex- and age-matched healthy donors (n = 2), were cultured for 24 h with either medium or SARS-CoV-2 at an MOI of 1. (B) Quantification of pro-inflammatory cytokines in the supernatant of activated pDCs for 24 h in response to SARS-CoV-2 challenge. Bars represent medians. HD, healthy donor; ND, not detectable.

Update of

References

    1. Abe, M., and Thomson A.W.. 2006. Dexamethasone preferentially suppresses plasmacytoid dendritic cell differentiation and enhances their apoptotic death. Clin. Immunol. 118:300–306. 10.1016/j.clim.2005.09.019 - DOI - PubMed
    1. Acharya, D., Liu G., and Gack M.U.. 2020. Dysregulation of type I interferon responses in COVID-19. Nat. Rev. Immunol. 20:397–398. 10.1038/s41577-020-0346-x - DOI - PMC - PubMed
    1. Alculumbre, S.G., Saint-André V., Di Domizio J., Vargas P., Sirven P., Bost P., Maurin M., Maiuri P., Wery M., Roman M.S., et al. . 2018. Diversification of human plasmacytoid predendritic cells in response to a single stimulus. Nat. Immunol. 19:63–75. 10.1038/s41590-017-0012-z - DOI - PubMed
    1. Asselah, T., Durantel D., Pasmant E., Lau G., and Schinazi R.F.. 2020. COVID-19: discovery, diagnostics and drug development. J. Hepatol. 0. 10.1016/j.jhep.2020.09.031 - DOI - PMC - PubMed
    1. Bastard, P., Rosen L.B., Zhang Q., Michailidis E., Hoffmann H.-H., Zhang Y., Dorgham K., Philippot Q., Rosain J., Béziat V., et al. . 2020. Autoantibodies against type I IFNs in patients with life-threatening COVID-19. Science. 370:eabd4585. 10.1126/science.abd4585 - DOI - PMC - PubMed

Publication types

MeSH terms