. 2021 Mar 18;49(5):2488-2508.
doi: 10.1093/nar/gkab053.

Fra-1 regulates its target genes via binding to remote enhancers without exerting major control on chromatin architecture in triple negative breast cancers

Affiliations

Fra-1 regulates its target genes via binding to remote enhancers without exerting major control on chromatin architecture in triple negative breast cancers

Fabienne Bejjani et al. Nucleic Acids Res. .

Abstract

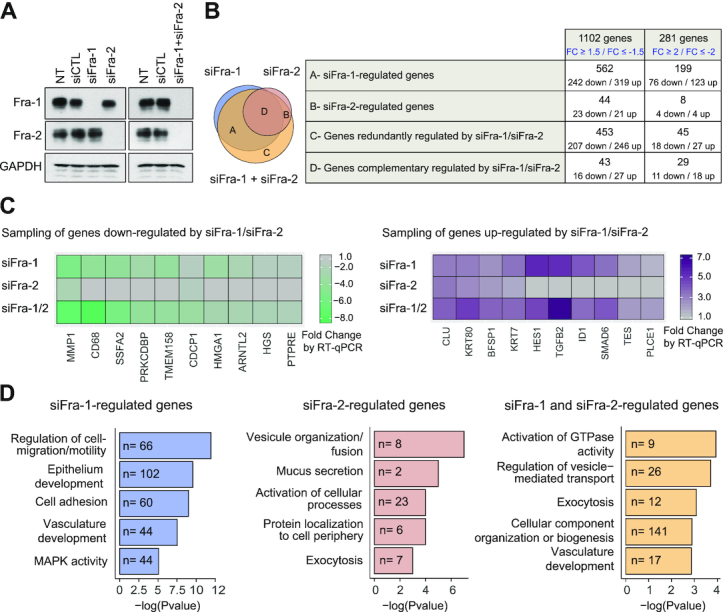
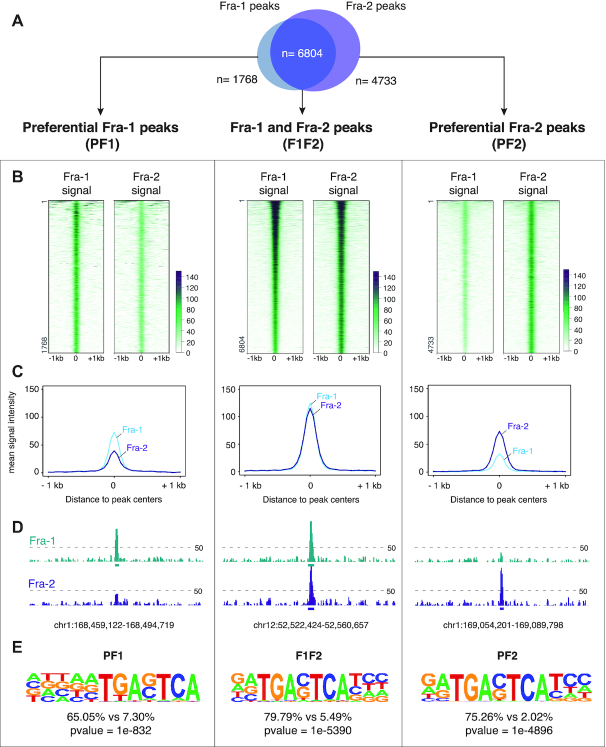
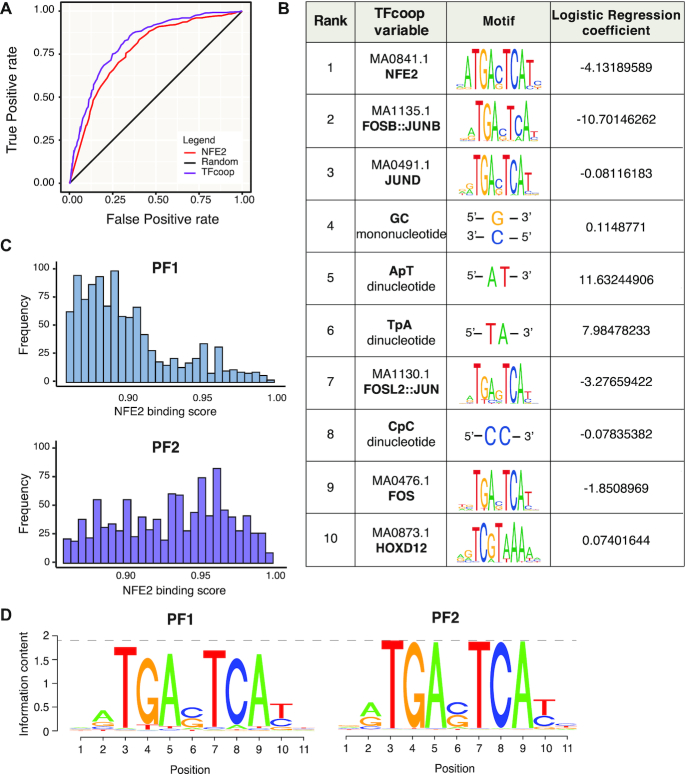
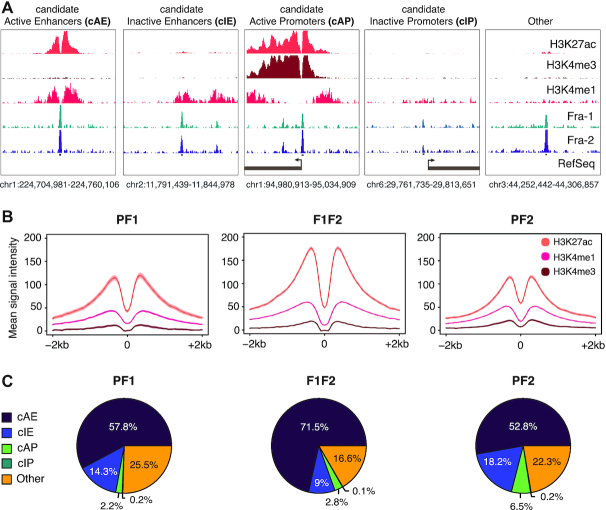
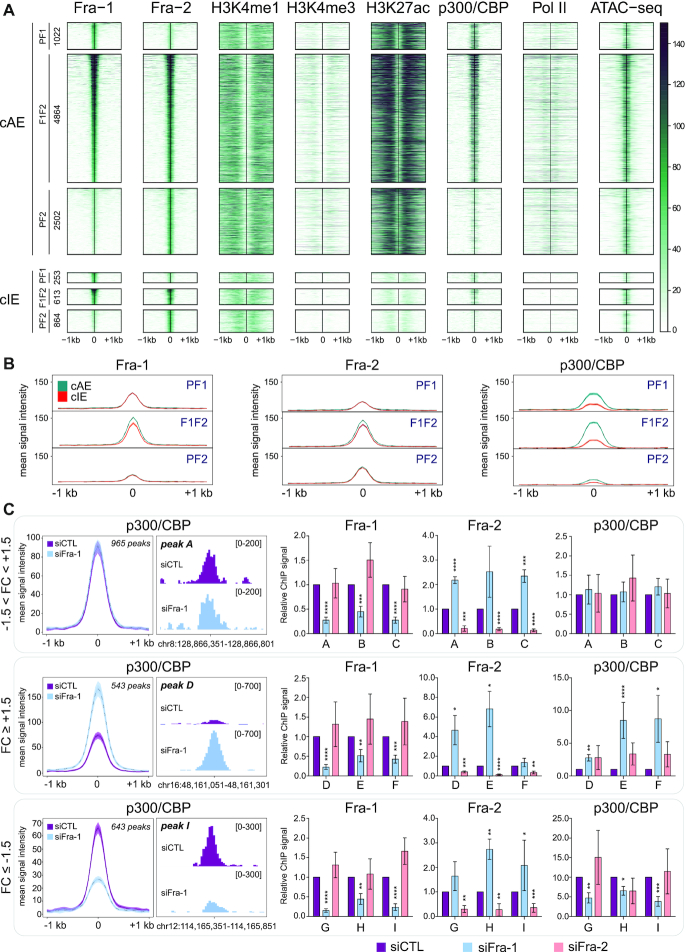
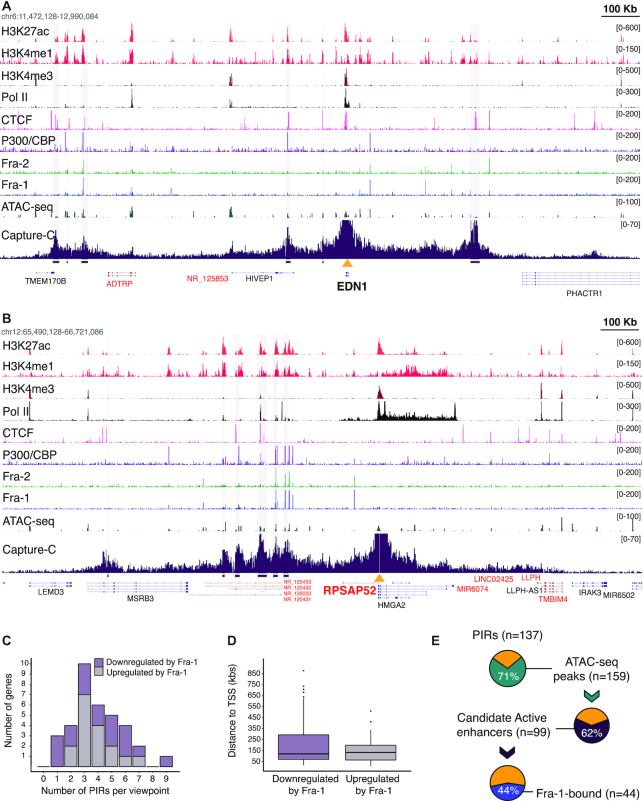
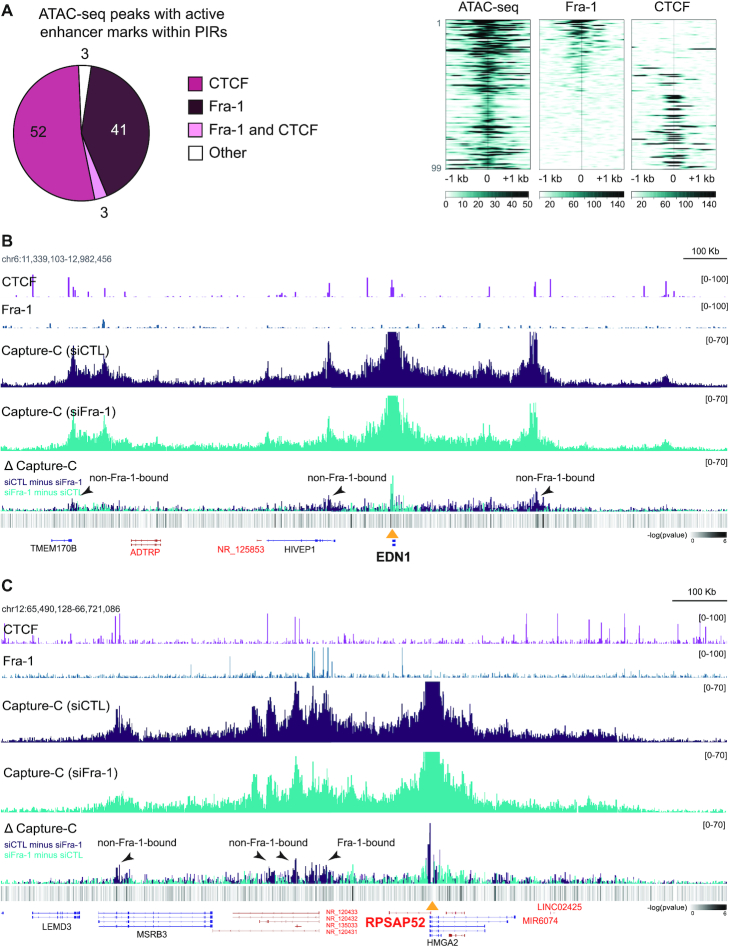
The ubiquitous family of dimeric transcription factors AP-1 is made up of Fos and Jun family proteins. It has long been thought to operate principally at gene promoters and how it controls transcription is still ill-understood. The Fos family protein Fra-1 is overexpressed in triple negative breast cancers (TNBCs) where it contributes to tumor aggressiveness. To address its transcriptional actions in TNBCs, we combined transcriptomics, ChIP-seqs, machine learning and NG Capture-C. Additionally, we studied its Fos family kin Fra-2 also expressed in TNBCs, albeit much less. Consistently with their pleiotropic effects, Fra-1 and Fra-2 up- and downregulate individually, together or redundantly many genes associated with a wide range of biological processes. Target gene regulation is principally due to binding of Fra-1 and Fra-2 at regulatory elements located distantly from cognate promoters where Fra-1 modulates the recruitment of the transcriptional co-regulator p300/CBP and where differences in AP-1 variant motif recognition can underlie preferential Fra-1- or Fra-2 bindings. Our work also shows no major role for Fra-1 in chromatin architecture control at target gene loci, but suggests collaboration between Fra-1-bound and -unbound enhancers within chromatin hubs sometimes including promoters for other Fra-1-regulated genes. Our work impacts our view of AP-1.


Figures

Figure 1.
Figure 1.
Transcriptomes controlled by Fra-1 and/or Fra-2 in MDA-MB-231 cells. (A) Downregulation of Fra-1 and Fra-2 proteins upon siRNA transfection. MDA-MB-231 cells were transfected with siCTL or siFra-1 and/or siFra-2 for 72 h. Cell extracts were analyzed by immunoblotting using antibodies specific for Fra-1 and Fra-2. GAPDH was taken as an invariant internal control. Left panels: single siRNA transfections. Right panels: double siRNA transfection. (B) Transcriptomes regulated by siFra-1 and/or siFra-2. siFra-1- and/or siFra-2-dependent transcriptomes were characterized using Affymetrix GeneChip Human genes 2.0ST array (see Supplementary Data S1A). The various groups of genes were defined as follows. For those preferentially regulated by siFra-1 (Group A), siFra-1 alone, but not siFra-2 alone, modulates transcript abundance. However, siFra-2 may strengthen the effect of siFra-1. For those regulated by siFra-2 (Group B), siFra-2 alone, but not siFra-1 alone, modulates transcript abundance. However, siFra-1 RNAi may strengthen the effect of siFra-2. For those redundantly regulated by siFra-1 and siFra-2 (Group C), siFra-2+siFra-1 modulates transcript abundance, whereas siFra-1 alone or siFra-2 alone do not. Finally, for those complementarily regulated by siFra-1 and siFra-2 (Group D), siFra-1 alone or siFra-2 alone modulates transcript abundance, but siFra-1+siFra-2 has stronger effects than individual siRNAs alone. Left panel: Venn diagram of genes regulated by siFra-1 and/or siFra-2. Right panel: numbers of up- and downregulated genes in each of the four classes of genes regulated by siFra-1 and/or siFra-2. The list of genes up- or downregulated by siFra-1 and/or siFra-2 is presented in Supplementary Table S1. (C) RT-qPCR validation of siFra-1- and/or siFra-2-regulated genes. A sampling of genes shown to be up- or downregulated by siFra-1 and/or siFra-2 in the Affymetrix array-based experiments was analyzed by RT-qPCR using RNAs prepared from MDA-MB-231 cells transfected as in A. Sequences of primers used for qPCR amplifications are given in Supplementary data S1B. (D) Gene ontology analysis of genes regulated by siFra-1 and/or siFra-2. Gene ontology analyses carried out using the GeneGo Metacore software are presented for the genes regulated by siFra-1, by siFra-2 or redundantly by siFra-1 and siFra-2 (FC ≥1.5 or ≤ −1.5). The top 5 informative non-redundant pathways in each category are listed along with their P-values and the number of regulated genes belonging to the pathway.
Figure 2.
Figure 2.
Fra-1- and Fra-2-binding sites in chromatin of MDA-MB-231 cells. MDA-MB-231 cells were cultured under standard conditions. (A) Overlap between Fra-1 and Fra-2 ChIP-seq peaks. Definitions of PF1, PF2 and F1F2 peaks are given in the text. (B) Heatmap representation of Fra-1 and Fra-2 signals at ±1 kb around PF1, F1F2 and PF2 peak centers. Regions were sorted according to Fra-1 decreasing signal intensity. (C) Fra-1 and Fra-2 metaprofiles at ±1 kb around PF1, F1F2 and PF2 peak centers. (D) Examples of PF1, F1F2 and PF2 peaks. The threshold for peak calling was set to 50 and is indicated by dotted lines (also see text). (E) De novo motif analysis using HOMER. The top-ranked motifs found in PF1, F1F2 and PF2 categories of sites are presented. Percentages indicate the fraction of peaks per group that contain the corresponding motif, as compared to a random set of genomic regions chosen as background.
Figure 3.
Figure 3.
Binding preferences of Fra-1 and Fra-2 in MDA-MB-231 cells. (A) Classification of PF1 and PF2 TFBSs by TFcoop. The ROC curves show the accuracy of the PF1 and PF2 peak classification based on all parameters of TFcoop (purple) or using NFE2 PWM alone (red). Random classification is shown in black. (B) Top10 variables selected by TFcoop to classify PF1 versus PF2 peaks. The corresponding JASPAR PWMs and the logistic regression coefficients calculated by TFcoop are shown. The negative regression coefficients refer to the PF2 class, whereas the positive ones refer to the PF1 class. (C) Distribution of maximal NFE2 PWM scores (0.85–1) in PF1- (top panel) and PF2 peaks (bottom panel). (D) PWM reconstruction for PF1 and PF2 ChIP-seq peaks. The information content of binding sites on nucleotide sequences (83) describes how different the sequences are from all those possible in the genome of the organism, in a manner clearly delineating the important nucleotides of the site. Letter height in a sequence logo ranges from 0 bit (no base preference) to 2 bits (only one base used). Simply stated, the higher the letter corresponding to a nucleotide at a given position, the larger the information content and higher the probability of getting that nucleotide at that position. Overall, the heights of PF2 logo letters are higher than those of PF1 (see dotted line).
Figure 4.
Figure 4.
Fra-1 and Fra-2 principally bind to candidate active enhancers in MDA-MB-231 cells. (A) Annotation of candidate regulatory elements in MDA-MB-231 cells cultured under standard conditions. The level and distribution of H3K4me1-, H3K4me3- and H3K27ac marks, together with Ref-Seq promoter annotations, were used to define candidate active and inactive promoters and enhancers as explained in the text. (B) Histone mark metaprofiles at ±1 kb around PF1, PF2 and F1F2 peak centers. (C) Overlap of PF1, PF2 and F1F2 peaks with the different candidate regulatory elements defined in (A).
Figure 5.
Figure 5.
Epigenomic heterogeneity of candidate enhancers bound by Fra-1 and/or Fra-2. (A) Heatmaps of ATAC-seq (3) and ChIP-seq signals in MDA-MB-231 cells cultured under standard conditions at ±1 kb around PF1, F1F2 and PF2 peak centers at candidate active enhancers (cAEs; upper panel) and candidate inactive enhancers (cIEs; lower panel). Regions were sorted according to Fra-1 decreasing signal intensity and the number of regions in each category is indicated on the left. (B) Comparison of ChIP-seq metaprofiles for Fra-1, Fra-2 and p300/CBP at PF1, F1F2 and PF2 peaks between cAEs (green) and cIEs (orange). (C) p300/CBP recruitment at F1F2 peaks in cAEs upon Fra-1 siRNA-mediated knockdown. The left panels represent the ChIP-seq metaprofiles of p300/CBP at ±1.5 kb around F1F2 peak centers in cAEs of MDA-MB-231 cells transfected with either siCTL or siFra-1 for 72h. Regions were sorted according to the p300/CBP signal-fold change in siFra-1- versus siCTL condition. The threshold was set up to ±1.5, defining three types of regions: regions with −1.5 < FC < 1.5, FC ≥ 1.5 and FC ≤ −1.5. Middle panels represent screen captures of the ChIP-seq profiles of peaks representative of each category of regions using the IGV software. The screen captures correspond to peaks A, D and I, which were analyzed by ChIP-qPCR, as presented in the right panels. These ChIP-qPCR experiments were carried out on MDA-MB-231 cells transfected with either siCTL, siFra-1 or siFra-2 (right panels). Three regions per category were tested: A, B and C are regions with −1.5 < FC <1.5; D, E and F are regions with FC ≥ +1.5 and G, H and I are regions with FC ≤ −0.5. Signals were normalized to inputs and to the siCTL condition set to 1 for each amplicon. Results are the mean of five independent experiments. P-values were calculated using a two-tailed unpaired t-test (Prism5 software). (*), (**), (***) and (****) correspond to P-values of ≤0.05, ≤ 0.01, ≤ 0.005 and ≤ 0.0001, respectively. Coordinates of the regions analyzed and sequences of the primers used are given in Supplementary Data S1H.
Figure 6.
Figure 6.
NG Capture-C analysis of Fra-1-regulated genes. (A and B) NG Capture-C profiles obtained at EDN1 (A) and RPSAP52 (B) gene loci. EDN1 is upregulated by siFra-1 whereas RPSAP52 is downregulated. The figures combine ChIP-seq, ATAC-seq and NG Capture-C data as indicated on the left. For NG Capture-C data on MDA-MB-231 cells transfected for 72 h with siCTL (see Figure 7B), the y-axis represents the normalized number of unique interactions per restriction fragment. PIRs identified using the PeakC R package are highlighted in light purple vertical lines. The scale (100 kb) is indicated at the top right edge of each figure. The yellow triangles indicate viewpoints. For better clarity, signals were strongly truncated at viewpoints. Genes encoded by the forward strand are shown in black and those encoded by the reverse strand are shown in red. (C) Distribution of PIR Numbers for the Fra-1 up- and downregulated genes. (D) Median distance between PIRs and viewpoints for Fra-1-up- and -downregulated genes. (E) Association of PIRs, candidate active enhancers and Fra-1. The fraction of PIRs containing ATAC-seq peaks is shown in green. The fraction of ATAC-seq peaks in PIRs with active enhancer marks is shown in purple. The fraction of the latter bound by Fra-1 is shown in blue.
Figure 7.
Figure 7.
Limited effect of Fra-1 on overall 3D chromatin structure control at Fra-1-regulated gene loci. (A) Fra-1 and CTCF binding at PIRs with active enhancer marks and ATAC-seq peaks in MDA-MB-231 cells cultured under standard conditions. The left panel shows the distribution of the Fra-1 and CTCF ChIP-seq peaks and the right panel shows their heatmaps at the studied regions. For the heatmaps, the regions were sorted according to Fra-1 decreasing signal intensity. (B and C) Modulation of chromatin interactions by Fra-1 at the EDN1 (B) and RPSAP52 (C) loci. MDA-MB-231 cells were transfected for 72 h using siCTL or siFra-1 before NG Capture-C analysis. ΔCapture-C represents the differences in NG Capture-C signals between Fra-1-proficient (purple) and Fra-1-depleted (blue) conditions. CTCF and Fra-1 ChIP-seq data are presented above NG Capture-C data. DESeq2 analysis of the differential enrichment (minus log10 adjusted P-values) mapped across the loci is shown in the heatmap at the lower panels.

References

    1. Bejjani F., Evanno E., Zibara K., Piechaczyk M., Jariel-Encontre I.. The AP-1 transcriptional complex: local switch or remote command?. Biochim. Biophys. Acta Rev. Cancer. 2019; 1872:11–23. - PubMed
    1. Eferl R., Wagner E.F.. AP-1: a double-edged sword in tumorigenesis. Nat. Rev. Cancer. 2003; 3:859–868. - PubMed
    1. Hess J. AP-1 subunits: quarrel and harmony among siblings. J. Cell Sci. 2004; 117:5965–5973. - PubMed
    1. Shaulian E., Karin M.. AP-1 as a regulator of cell life and death. Nat. Cell Biol. 2002; 4:E131–E136. - PubMed
    1. Basbous J., Chalbos D., Hipskind R., Jariel-Encontre I., Piechaczyk M.. Ubiquitin-independent proteasomal degradation of Fra-1 is antagonized by Erk1/2 pathway-mediated phosphorylation of a unique C-terminal destabilizer. Mol. Cell. Biol. 2007; 27:3936–3950. - PMC - PubMed

Publication types

MeSH terms