. 2021 Apr 5;220(4):e202006081.
doi: 10.1083/jcb.202006081.

Dendritic cell actin dynamics control contact duration and priming efficiency at the immunological synapse

Affiliations

Dendritic cell actin dynamics control contact duration and priming efficiency at the immunological synapse

Alexander Leithner et al. J Cell Biol. .

Abstract

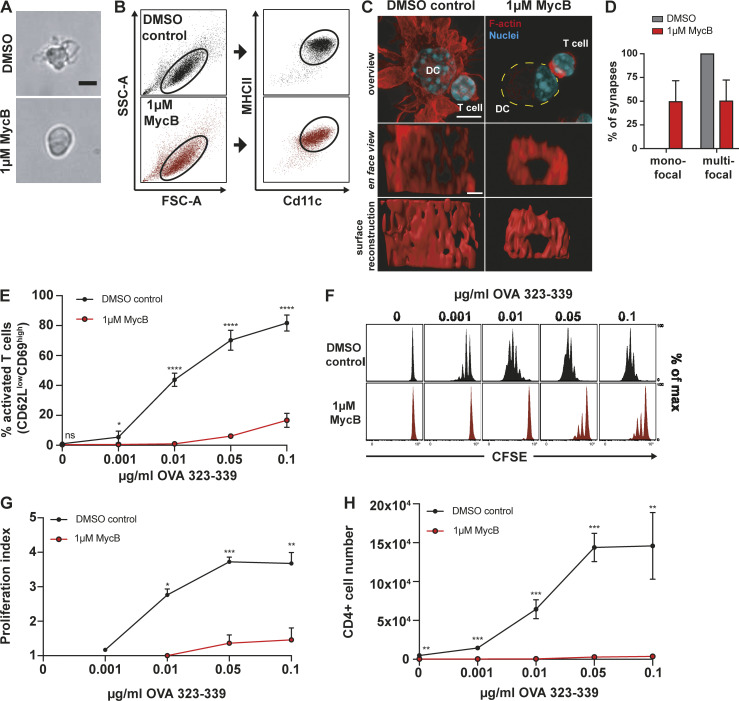
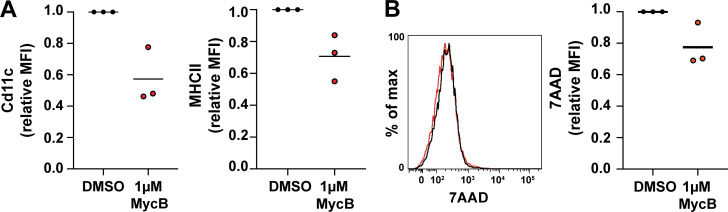
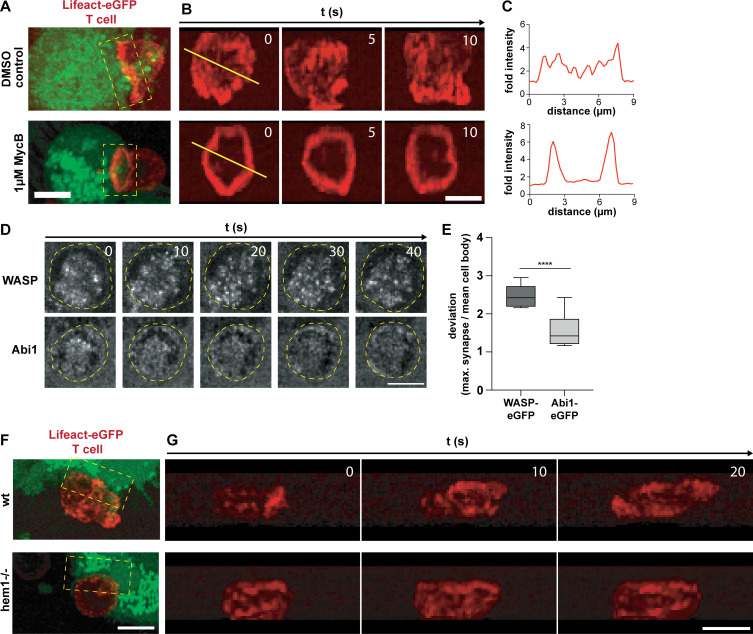
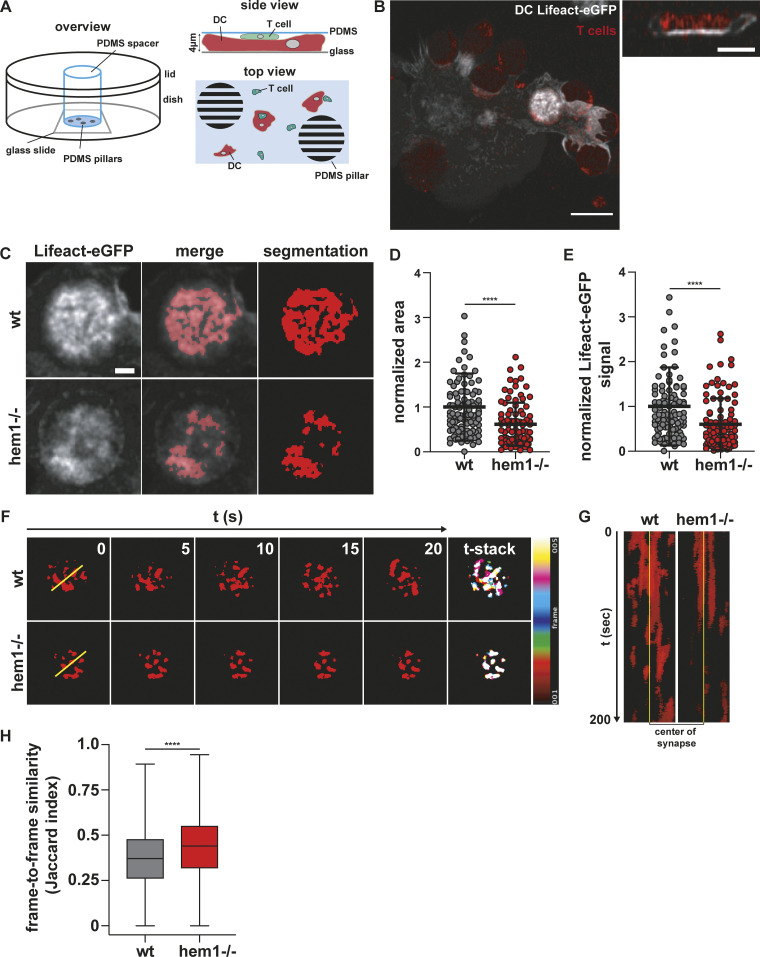
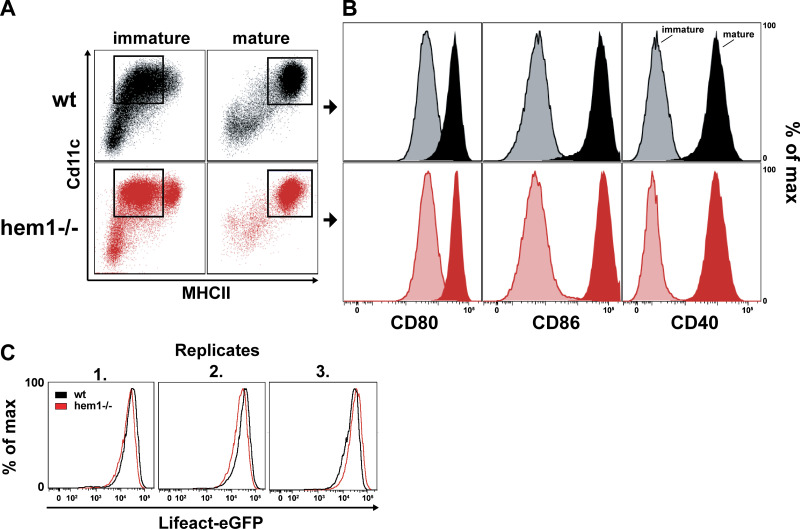
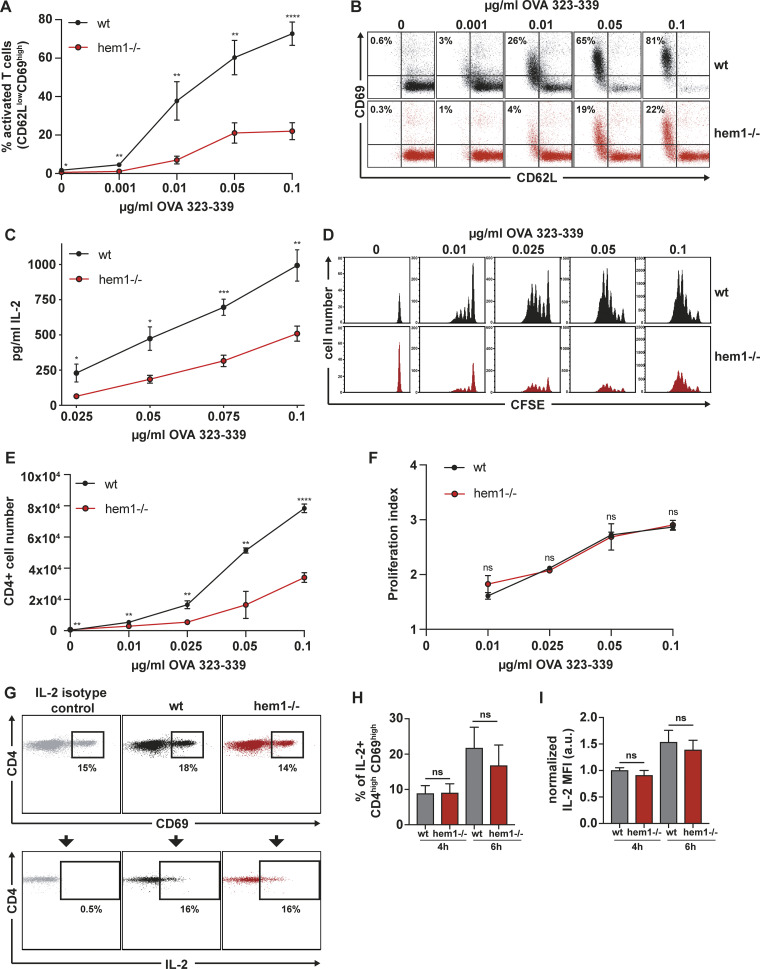
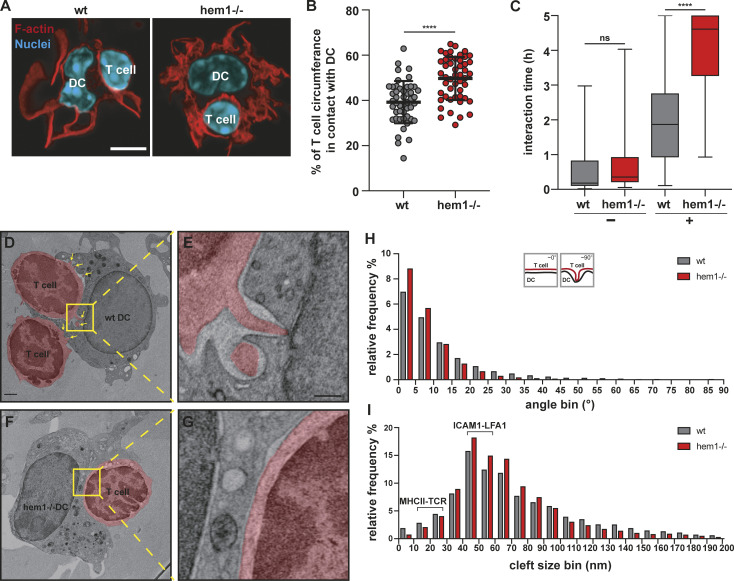
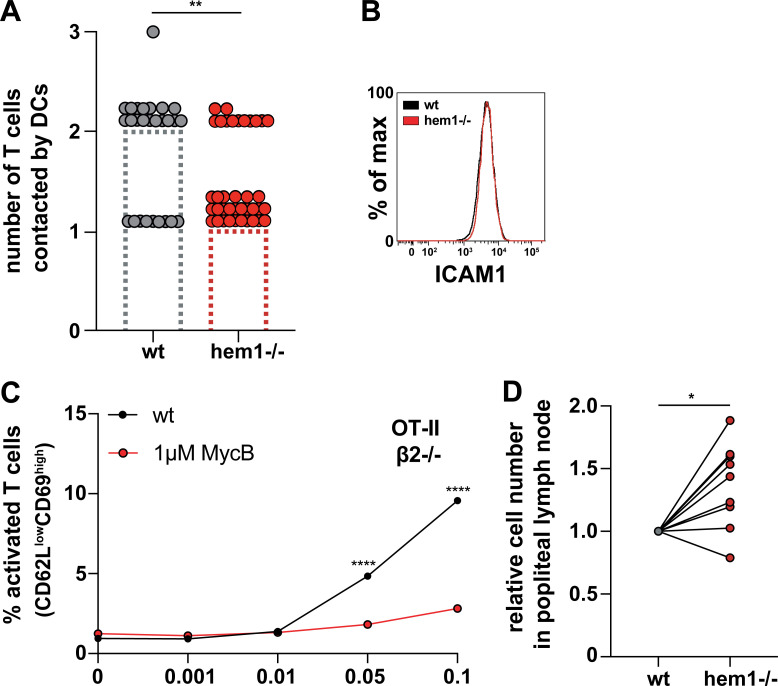
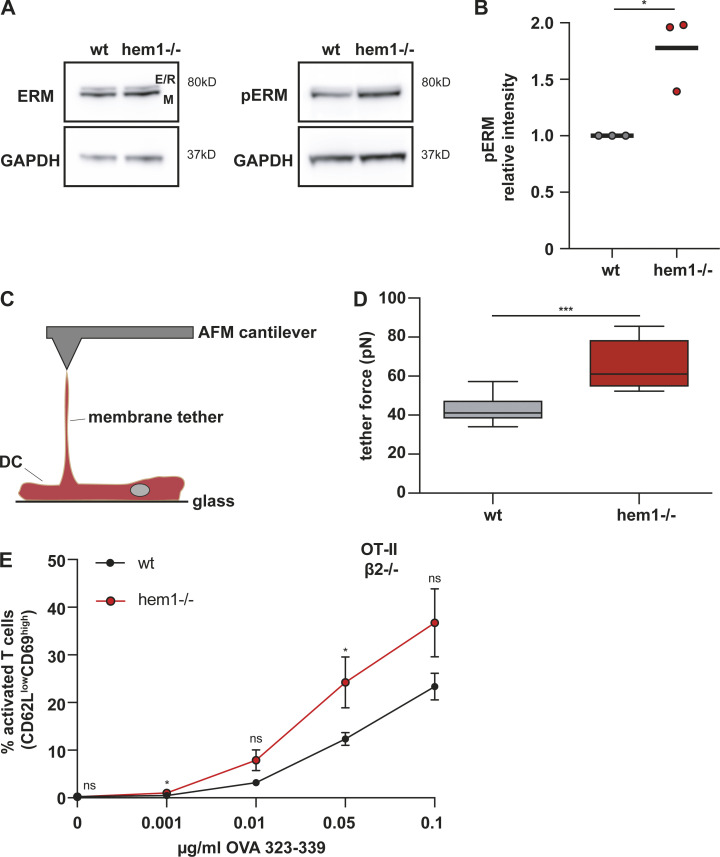
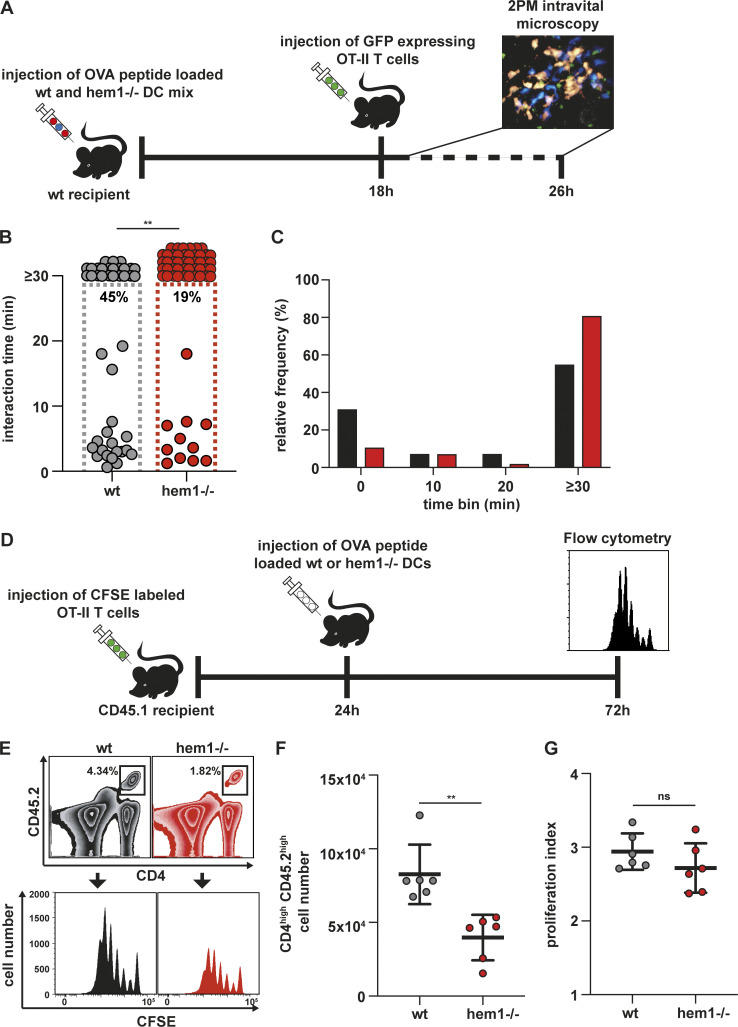
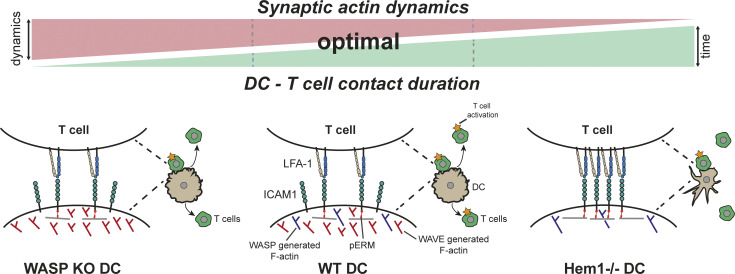
Dendritic cells (DCs) are crucial for the priming of naive T cells and the initiation of adaptive immunity. Priming is initiated at a heterologous cell-cell contact, the immunological synapse (IS). While it is established that F-actin dynamics regulates signaling at the T cell side of the contact, little is known about the cytoskeletal contribution on the DC side. Here, we show that the DC actin cytoskeleton is decisive for the formation of a multifocal synaptic structure, which correlates with T cell priming efficiency. DC actin at the IS appears in transient foci that are dynamized by the WAVE regulatory complex (WRC). The absence of the WRC in DCs leads to stabilized contacts with T cells, caused by an increase in ICAM1-integrin-mediated cell-cell adhesion. This results in lower numbers of activated and proliferating T cells, demonstrating an important role for DC actin in the regulation of immune synapse functionality.


Figures

Figure 1.
Figure 1.
DC F-actin depolymerization affects immune synapse structure and T cell priming efficiency. (A) Bright field images of mature DCs treated with 1 µM MycB (right) or DMSO (left). Scale bar: 10 µm. (B) Flow cytometry profiles of DMSO and 1 µM MycB-treated mature DCs. Cd11c/MHC II plots are pregated on FSC-A/SSC-A population defined by black oval on the left, representative example of three biological replicates. (C) Immunofluorescence images of synapses formed between DMSO or 1 µM MycB-treated mature DCs and T cells. Upper panel: overview pictures, yellow dotted line outlines DC. Scale bar: 5 µm. Middle panel: en face view on the synaptic interface. Scale bar: 1 µm. Lower panel: surface reconstruction of the synaptic interface. (D) Percentages of mono- and multifocal synapses formed between T cells and 1 µM MycB-treated mature DCs, n = 20 cell duplets for each condition, three biological replicates, mean ± SD. (E) Percentages of activated T cells assessed by CD62L/CD69 surface expression after 16 h of coculture with DMSO or 1 µM MycB-treated mature DCs at indicated OVA323-339 peptide concentrations, three biological replicates, mean ± SD. (F) CFSE dilution profile of T cells after 96 h of coculture with DMSO or 1 µM MycB-treated mature DCs at indicated OVA323-339 peptide concentrations, representative example of three biological replicates. (G) Proliferation indices of CFSE-labeled T cells after 96 h of coculture with DMSO or 1 µM MycB-treated mature DCs at indicated OVA323-339 peptide concentrations, three biological replicates, mean ± SD. (H) Absolute T cell numbers after 96 h of coincubation with DMSO or 1 µM MycB-treated mature DCs at indicated OVA323-339 peptide concentrations, three biological replicates, mean ± SD. Data in E, G, and H were tested for normal distribution, transformed if necessary, and tested by using Student’s t test. FSC-A, forward scatter–A; ns, not significant; SSC-A, side scatter–A. *, P ≤ 0.05; **, P ≤ 0.01; ***, P ≤ 0.001.
Figure S1.
Figure S1.
Further characterization of MycB treated DCs. (A) Flow cytometry experiment displaying relative mean fluorescence intensities (MFIs) for Cd11c (left) and MHC II (right) of DMSO- or 1 µM MycB–treated mature DCs, three biological replicates. (B) 7–Actinomycin D (7-AAD) life/dead stain flow cytometry histograms (left) and relative mean fluorescence intensities (right) of DMSO- or 1 µM MycB–treated mature DCs, three biological replicates.
Figure S2.
Figure S2.
Characterization of the structure and dynamics of the DC and T cell actin cytoskeleton at the immunological synapse. (A) 3D projection of Lifeact-eGFP–expressing OT-II T cells (red), interacting with DMSO control (upper) or 1 µM MycB–treated (lower) and 5-Carboxytetramethylrhodamine (TAMRA)-stained mature DC (green). (B) En face time-lapse reconstruction of T cell synapses shown in A (yellow boxes). (C) Relative Lifeact-eGFP intensities along yellow lines shown in B. (D) Time-lapse series of synapses formed between WASP-eGFP (upper) or eGFP-Abi1 (lower) expressing mature WT DCs and OT-II T cells in confiner setup. Yellow ovals demarcate the outline of the T cell. Scale bar: 5 µm. (E) Deviation of maximum WASP-eGFP or Abi1-eGFP signal at the synapse from mean intensity in the cell body, n = 7 synapses for each reporter construct, t test. (F) 3D projection of Lifeact-eGFP–expressing OT-II T cells (red) interacting with WT (top) or hem1−/− (bottom) TAMRA-stained mature DCs (green). (G) En face time-lapse reconstruction of T cell synapses shown in F (yellow boxes). All scale bars: 5 µm. ****, P ≤ 0.0001.
Figure 2.
Figure 2.
Dynamic F-actin foci at the DC immune synapse. (A) Schematic overview of PDMS confiner setup. (B) Left: Maximum intensity projection of Lifeact-eGFP–expressing mature WT DC interacting with TAMRA-stained T cells. Scale bar: 10 µm. Right: Z-stack of bright Lifeact-eGFP signal region on the left. Scale bar: 5 µm. (C) Examples of mature WT and hem1−/− DC–T cell immune synapses and machine learning–based segmentation of synaptic DC Lifeact-eGFP signal. Scale bar: 2 µm. (D) Normalized area of synaptic DC Lifeact-eGFP signal, n = 100 synapses each, Mann-Whitney test, mean ± SD, three biological replicates. (E) Normalized synaptic DC Lifeact-eGFP signal, n = 100 synapses each, Mann-Whitney test, mean ± SD, three biological replicates. (F) Left: Time-lapse series of synaptic DC Lifeact-eGFP signal. Right: Stack through time-lapse series. (G) Kymograph of yellow line in F. (H) Frame-to-frame similarity of synaptic DC Lifeact-eGFP signal, n ≪ 6,000 frame comparisons each, Mann-Whitney test, mean ± min/max, two biological replicates. ****, P ≤ 0.0001.
Figure S3.
Figure S3.
Flow cytometry analysis of immature and mature wt and hem1−/− DCs. (A) Flow cytometry profiles of MHC II– and Cd11c-stained immature (left) or mature (right) WT or hem1−/− DCs. (B) Flow cytometry histograms of immature (light colors) and mature (dark colors) of WT (top) or hem1−/− (bottom) DCs stained for CD80, CD86, or CD40, respectively. (C) Flow cytometry histograms of three biological replicates for Lifeact-eGFP–expressing mature WT and hem1−/− DCs.
Figure 3.
Figure 3.
Hem1−/− DCs are impaired in T cell activation. (A) Percentage of activated T cells assessed by CD62L/CD69 surface expression at indicated OVA323-339 peptide concentrations, three biological replicates, mean ± SD. (B) Exemplary CD62L/CD69 flow cytometry profile of T cells after 16 h of coculture with mature WT or hem1−/− DCs. (C) IL-2 ELISA after 16 h of T cell mature WT or hem1−/− DC coculture at indicated OVA323-339 peptide concentrations, three biological replicates, mean ± SD. (D) CFSE dilution profile of T cells after 96 h of coculture with mature WT or hem1−/− DCs at indicated OVA323-339 peptide concentrations, representative example of three biological replicates. (E) Absolute T cell numbers after 96 h of coincubation with mature WT or hem1−/− DCs at indicated OVA323-339 peptide concentrations, three biological replicates, mean ± SD. (F) Proliferation indices of CFSE-labeled T cells after 96 h of coculture with mature WT or hem1−/− DCs at indicated OVA323-339 peptide concentrations, three biological replicates, mean ± SD. (G) Exemplary CD4/CD69 (top) and CD4/IL-2 (bottom) flow cytometry profile of T cells after 6 h coculture with WT or hem1−/− DCs. (H) Fraction of IL-2–positive T cells after 4 or 6 h of coculture with mature WT or hem1−/− DCs, pregated on CD4high/CD69high, two biological replicates, one-way ANOVA, mean + SD. (I) Normalized IL-2 mean fluorescence intensity (MFI) of CD4high T cells after 4 or 6 h of coculture with mature WT or hem1−/− DCs, two biological replicates, one-way ANOVA, mean + SD. Data were normalized to WT 4 h. 10 µg/ml brefeldin A was added for the last 3 h of the cocultures in G, H, and I. Data in A, C, E, and F were tested for normal distribution, transformed if necessary, and tested by using Student’s t test. ns, not significant. *, P ≤ 0.05; **, P ≤ 0.01; ***, P ≤ 0.001; ****, P ≤ 0.0001.
Figure 4.
Figure 4.
Hem1−/− DCs alter synapse structure and dynamics. (A) Fluorescence microscopy images of synapses formed between mature WT or hem1−/− DCs and T cells stained with phalloidin and DAPI. Scale bar: 5 µm. (B) Percentages of T cell surface area in contact with DC, ∼50 cells each, t test, mean ± SD, three biological replicates. (C) Interaction times of mature WT or hem1−/− DCs with T cells in the absence (−) or presence (+) of OVA323-339 peptide, n = 50 contacts each for (+) or n = 30 contacts each for (−), Mann-Whitney test, mean ± min/max, three biological replicates. (D and E) EM of WT DC–T cell synapse, T cells are colored in red, yellow box and dotted lines denote region magnified in E, yellow arrows highlight T cell protrusions. (F and G) EM of hem1−/− DC–T cell synapse, T cell is colored in red, yellow box and dotted lines denote region magnified in G. Scale bars: 1 µm in D and F, 300 nm in E and G. (H) Frequency histograms in percent of the angles found between DC and T cell membranes, n = 4 synapses each, two biological replicates, Kolmogorov-Smirnov test, P ≤ 0.0001. (I) Frequency histograms in percent of the cleft size found between DC and T cell membranes from H, Kolmogorov-Smirnov test, P ≤ 0.0001. ns, not significant. ****, P ≤ 0.0001.
Figure S4.
Figure S4.
The dependency of T cell priming defects on the pERM-ICAM1-LFA-1 axis are specific to hem1−/− DCs. (A) Quantification of the number of T cells contacted by mature WT and hem1−/− DCs. Bars represent the median. Mann-Whitney test, three biological replicates. (B) Flow cytometry histogram for ICAM1 in mature WT and hem1−/− DCs. (C) Percentages of WT or 1 µM MycB–treated mature DCs activating β2-integrin–deficient T cells, as assessed by CD62L/CD69 surface expression at indicated OVA323-339 peptide concentrations. (D) Normalized relative number of WT and hem1−/− DCs in the popliteal lymph node 24 h after coinjection in a 1:2 ratio. t test. Data are pooled from nine different mice. *, P ≤ 0.05; **, P ≤ 0.01; ****, P ≤ 0.0001.
Figure 5.
Figure 5.
The hem1−/− DC–T cell priming defect is mediated by the pERM–ICAM1–LFA-1 axis. (A) Western blots for ERM, pERM, and GAPDH in mature WT and hem1−/− DCs, representative example of three biological replicates. (B) Relative intensity of pERM signal in mature WT and hem1−/− DCs, t test, three biological replicates. (C) Schematic overview of AFM setup for tether pulling. (D) Static tether force for mature WT and hem1−/− DCs, two biological replicates, t test. (E) Percentages of activated β2-integrindeficient T cells assessed by CD62L/CD69 surface expression at indicated OVA323-339 peptide concentrations, three biological replicates, mean ± SD. Data were tested for normal distribution, transformed if necessary, and tested by using Student’s t test. ns, not significant. *, P ≤ 0.05; ***, P ≤ 0.001.
Figure 6.
Figure 6.
Hem1−/− DCs have T cell priming defects in vivo. (A) Schematic overview of experimental setup for two-photon intravital microscopy. (B) In vivo interaction times of mature WT or hem1−/− DCs and T cells, n = 45 cell–cell interactions each, Mann-Whitney test. Percentages refer to cell–cell interactions that start and end within the 30-min time window, two biological replicates. (C) Frequency histograms in percent of DC–T cell interaction times from B. (D) Schematic overview of experimental setup for in vivo T cell proliferation assays. (E) Gating strategy to determine the CFSE proliferation profiles of CD45.2/CD4 T cells in CD45.1 mice after WT or hem1−/− DC T cell priming. (F) Absolute CD45.2/CD4 T cell numbers in the popliteal lymph nodes of CD45.1 mice 72 h after DC injections, n = 6 lymph nodes each, Mann-Whitney test, two biological replicates. (G) Proliferation indices of CFSE-labeled T cells from F, t test. ns, not significant. **, P ≤ 0.01.
Figure 7.
Figure 7.
Working model showing how DC actin dynamics regulates DCT cell contact time and priming efficiency. Center: Actin dynamics in WT DCs is regulated by WAVE and WASP in a way that allows for transiently stable DC–T cell contacts, mediated by the pERM–ICAM1–LFA-1 axis, which leads to the activation of a large number of T cells. Right: In the absence of DC WAVE, lateral actin dynamics is reduced, and the altered actin network serves as an ideal substrate for ERM proteins. This leads to an increase in pERM/ICAM1/LFA-1–mediated cell–cell adhesion and allows for the activation of only few T cells compared with WT. Left: in the absence of WASP, actin dynamics at the synapse increases, leading to destabilization of the cell–cell contact and a decrease in interaction time that results in insufficient T cell activation. KO, knockout.

References

    1. Abraham, C., Griffith J., and Miller J.. 1999. The dependence for leukocyte function-associated antigen-1/ICAM-1 interactions in T cell activation cannot be overcome by expression of high density TCR ligand. J. Immunol. 162:4399–4405. - PubMed
    1. Al-Alwan, M., and Rowden G.. 2001. Cutting edge: the dendritic cell cytoskeleton is critical for the formation of the immunological synapse. J. Immunol. 166:1452–1456. 10.4049/jimmunol.166.3.1452 - DOI - PubMed
    1. Alekhina, O., Burstein E., and Billadeau D.D.. 2017. Cellular functions of WASP family proteins at a glance. J. Cell Sci. 130:2235–2241. 10.1242/jcs.199570 - DOI - PMC - PubMed
    1. Babich, A., Li S., O’Connor R.S., Milone M.C., Freedman B.D., and Burkhardt J.K.. 2012. F-actin polymerization and retrograde flow drive sustained PLCγ1 signaling during T cell activation. J. Cell Biol. 197:775–787. 10.1083/jcb.201201018 - DOI - PMC - PubMed
    1. Balkow, S., Heinz S., Schmidbauer P., Kolanus W., Holzmann B., Grabbe S., and Laschinger M.. 2010. LFA-1 activity state on dendritic cells regulates contact duration with T cells and promotes T-cell priming. Blood. 116:1885–1894. 10.1182/blood-2009-05-224428 - DOI - PubMed

Publication types