. 2021 Aug;36(4):692-705.
doi: 10.1007/s12250-020-00343-x. Epub 2021 Feb 3.

Rearrangement of Actin Cytoskeleton by Zika Virus Infection Facilitates Blood-Testis Barrier Hyperpermeability

Affiliations

Rearrangement of Actin Cytoskeleton by Zika Virus Infection Facilitates Blood-Testis Barrier Hyperpermeability

Yiwen Nie et al. Virol Sin. 2021 Aug.

Abstract

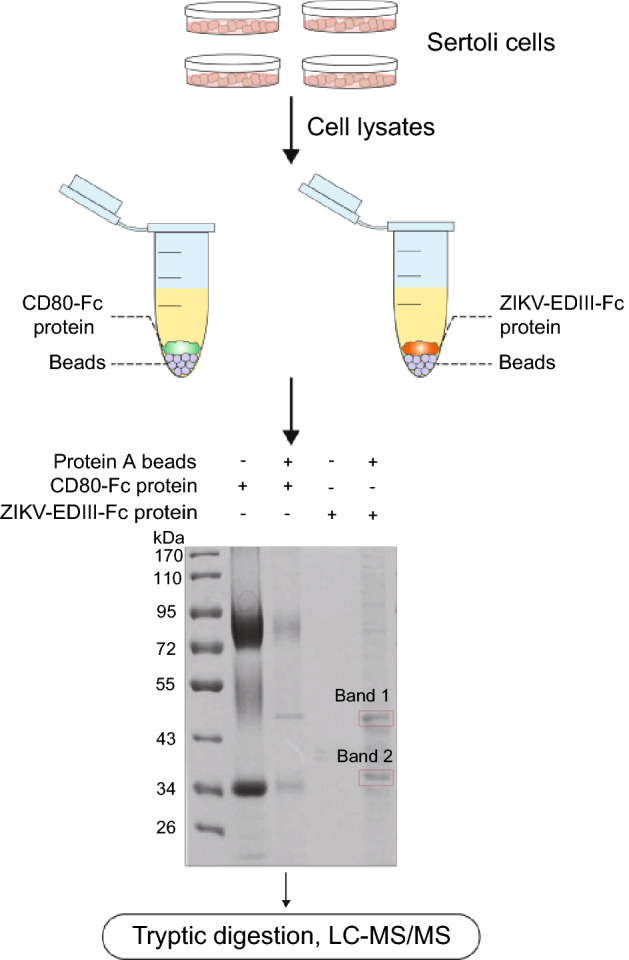
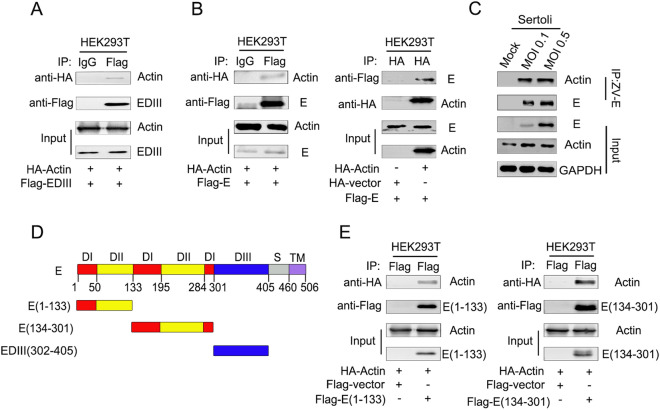
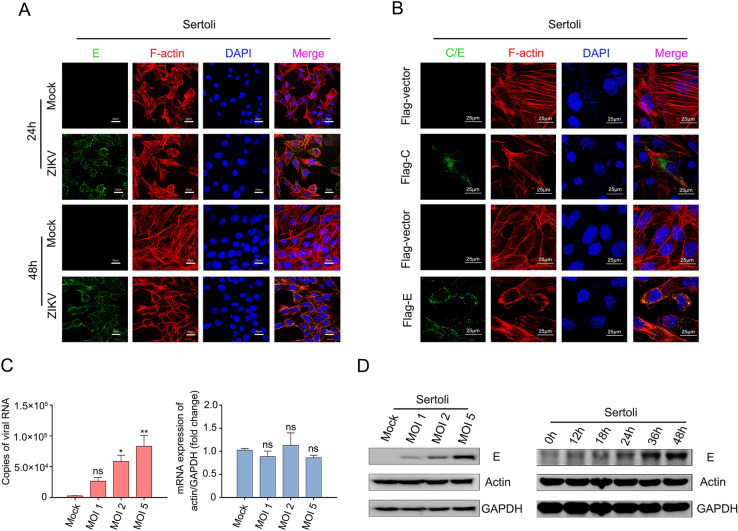
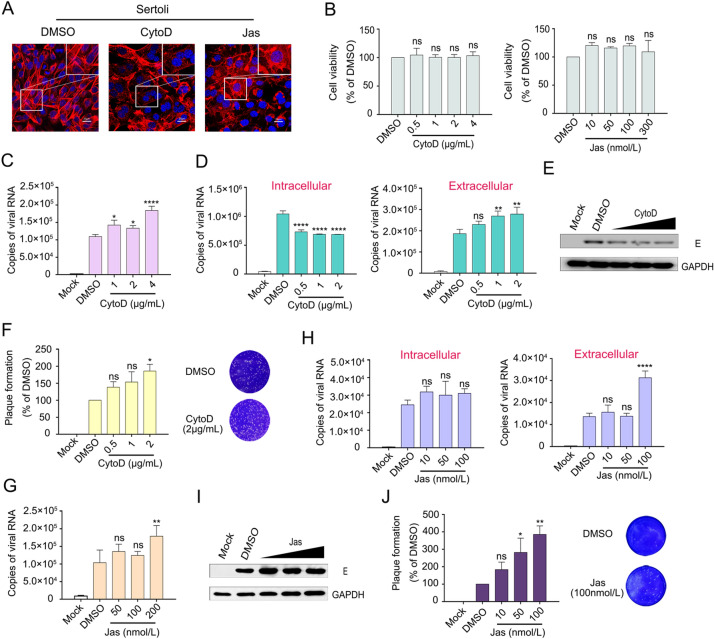
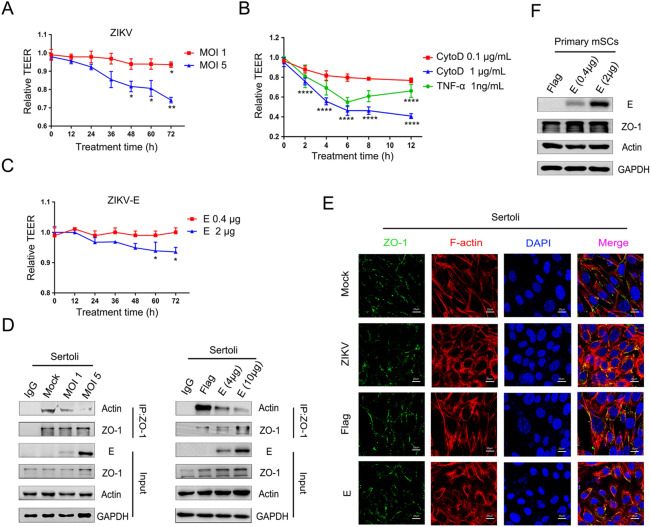
In recent years, various serious diseases caused by Zika virus (ZIKV) have made it impossible to be ignored. Confirmed existence of ZIKV in semen and sexually transmission of ZIKV suggested that it can break the blood-testis barrier (BTB), or Sertoli cell barrier (SCB). However, little is known about the underlying mechanism. In this study, interaction between actin, an important component of the SCB, and ZIKV envelope (E) protein domain III (EDIII) was inferred from co-immunoprecipitation (Co-IP) liquid chromatography-tandem mass spectrometry (LC-MS/MS) analysis. Confocal microscopy confirmed the role of actin filaments (F-actin) in ZIKV infection, during which part of the stress fibers, the bundles that constituted by paralleled actin filaments, were disrupted and presented in the cell periphery. Colocalization of E and reorganized actin filaments in the cell periphery of transfected Sertoli cells suggests a participation of ZIKV E protein in ZIKV-induced F-actin rearrangement. Perturbation of F-actin by cytochalasin D (CytoD) or Jasplakinolide (Jas) enhanced the infection of ZIKV. More importantly, the transepithelial electrical resistance (TEER) of an in vitro mouse SCB (mSCB) model declined with the progression of ZIKV infection or overexpression of E protein. Co-IP and confocal microscopy analyses revealed that the interaction between F-actin and tight junction protein ZO-1 was reduced after ZIKV infection or E protein overexpression, highlighting the role of E protein in ZIKV-induced disruption of the BTB. We conclude that the interaction between ZIKV E and F-actin leads to the reorganization of F-actin network, thereby compromising BTB integrity.

Keywords: Actin filaments; Blood-testis barrier (BTB); Envelope protein; Sertoli cell barrier (SCB); Zika virus (ZIKV).


Conflict of interest statement

The authors declare that they have no conflict of interest.

Figures

Fig. 1
Fig. 1
Flow chart of identification of ZIKV-EDIII protein interacting proteins. Sertoli cells lysates were incubated with CD80-Fc and protein A-sepharose beads or EDIII-Fc and protein A-sepharose beads, respectively. Samples of CD80-Fc and ZIKV-EDIII-Fc affinity-isolated proteins from Sertoli cell lysates were subjected to gel and performed coomassie blue staining. Band 1 and Band 2 excised from the gel and the whole affinity-isolated proteins eluted from protein A-sepharose beads were all subjected to LC–MS/MS analysis. By performing a sequence alignment with the Uniprot database, we obtained a number of potential interacting proteins, including actin and actin related proteins (Table 1).
Fig. 2
Fig. 2
ZIKV E interacts with actin. A Co-IP of ZIKV EDIII protein and actin in vitro. Plasmid pcDNA3.1(+)-Flag-EDIII and pcaggs-HA-actin were co-transfected into HEK293T cells, the samples were collected at 48 h post transfection. Cell lysates were immunoprecipitated with anti-mouse immunoglobulin G (IgG) and anti-Flag antibodies, followed by SDS-PAGE and immunoblotting with anti-HA antibody. B Co-IP of ZIKV E protein and actin in vitro. Plasmid pcDNA3.1(+)-Flag-E and pcaggs-HA-actin were co-transfected into HEK293T cells, the samples were collected at 48 h post transfection. Cell lysates were immunoprecipitated with anti-mouse immunoglobulin G (IgG) and anti-Flag antibodies, followed by SDS-PAGE and immunoblotting with anti-HA antibody. HEK293T cells were co-transfected with empty vector, pcDNA3.1(+)-Flag-E and pcaggs-HA-actin, cells lysates were immunoprecipitated with anti-HA antibody followed by SDS-PAGE and immunoblotting with anti-Flag antibody. C Co-IP of ZIKV E protein and actin after viral infection. Sertoli cells were un-infected (mock) or infected with ZIKV at an MOI of 0.1 and 0.5, the samples were collected at 48 hpi. Cell lysate was immunoprecipitated with anti-ZIKV E antibodies followed by SDS-PAGE and immunoblotting with anti-actin antibody. D Diagrammatic representation of ZIKV E protein and three truncated constructs generated in this study. E Co-IP analysis of ZIKV E protein's actin interaction region. HEK293T cells were cotransfected with pcDNA3.1(+)-Flag-E(1–133) and pcaggs-HA-actin or pcDNA3.1(+)-Flag-E(134–301) and pcaggs-HA-actin. Cells lysates were immunoprecipitated with anti-Flag antibodies followed by SDS-PAGE and immunoblotting with anti-HA antibody.
Fig. 3
Fig. 3
ZIKV infection induces actin filaments rearrangement in Sertoli cells. A Confocal microscopy analysis of Sertoli cells actin filaments skeleton under continuous ZIKV infection. Sertoli cells were un-infected (mock) or infected with ZIKV (MOI = 1). The cells were fixed in 4% paraformaldehyde at indicated time points, permeabilized, and stained with DAPI to label nuclei (blue), TRITC-phalloidin to label F-actin (red), and ZIKV (green) were detected by FITC-Z6 antibodies. The results are representative of three separate experiments. The scale bar indicates 25 μm. B Confocal microscopy analysis of Sertoli cells actin filaments skeleton after transfected with pcDNA3.1(+)-Flag-E plasmid. Sertoli cells were transfected with 2 μg empty vector, 2 μg pcDNA3.1(+)-Flag-C plasmid or 2 μg empty vector, 2 μg pcDNA3.1(+)-Flag-E plasmid, and fixed at 48 h post transfection. Then cells were stained with DAPI to label nuclei (blue), TRITC-phalloidin to label F-actin (red), Flag antibodies (green) to label capside protein and ZIKV-E (green) were detected by FITC-Z6 antibodies. The results are representative of three separate experiments. The scale bar indicates 25 μm. C Measurements of actin mRNA levels after ZIKV infection. Sertoli cells were un-infected (Mock) or infected with ZIKV at an MOI of 1, 2 and 5, and samples were collected at 30 hpi. Total RNA were extracted, copies of viral RNA and actin were measured by qRT-PCR. The results are representative of three separate experiments. Each value represents the mean ± SD of 3 separate replicates. *, P < 0.05; **, P < 0.01; ns, not significant (one-way ANOVA). D Measurements of actin protein levels after ZIKV infection. Sertoli cells were infected with ZIKV (MOI = 1) and collected at indicated time points, actin protein levels were examined by WB. 0 h: un-infected cells.
Fig. 4
Fig. 4
ZIKV infection was promoted by CytoD or Jas treatment. A Effects of CytoD and Jas on F-actin. Sertoli cells were treated with 2 μg/mL of CytoD or 200 nmol/L Jas for 26 h. Then cells were stained with DAPI to label nuclei (blue), TRITC-phalloidin to label F-actin (red). Control: DMSO treated cells. The scale bar indicates 25 μm. B Cytotoxicities of CytoD and Jas on Sertoli cells. Sertoli cells were incubated with CytoD or Jas at different concentrations for 48 h, and the cell viability was determined by CCK8 assay. Control: DMSO treated cells. The cell viabilities were expressed as the relative values to control, the results are representative of three separate experiments. Each value represents the mean ± SD of 4 separate replicates. ns, not significant (one-way ANOVA). C Effects of CytoD on ZIKV invasion of Sertoli cells. Sertoli cells were pretreated with DMEM containing 0.4% DMSO (control) or CytoD at 1, 2, 4 μg/mL for 3 h and after that infected with ZIKV (MOI = 1) in the absence of drugs for 2 h, discard the supernatants and wash three times with PBS, the cell samples were collected with TRIzol and measured by qRT-PCR. The results are representative of three separate experiments. Each value represents the mean ± SD of 3 separate replicates. *, P < 0.05; ****, P < 0.0001 (one-way ANOVA). D–F Effects of CytoD on ZIKV post entry step. Sertoli cells were incubated with ZIKV (MOI = 1) for 2 h and the supernatants were discarded, washed three times with PBS, then incubated with CytoD at the corresponding concentration. The cell and supernatant samples were collected at 30 hpi. Measured by qRT-PCR, WB and plaque assay. The results are representative of three separate experiments. Each value represents the mean ± SD of 3 separate replicates. *, P < 0.05; **, P < 0.01; ****, P < 0.0001; ns, not significant (one-way ANOVA). G Effects of Jas on ZIKV invasion of Sertoli cells. Sertoli cells were pretreated with DMEM containing 0.2% DMSO (control) or Jas at 50, 100, 200 nmol/L for 3 h and after that infected with ZIKV (MOI = 1) in the absence of drugs for 2 h, discard the supernatants and wash three times with PBS, the cell samples were collected with TRIzol and measured by qRT-PCR. The results are representative of three separate experiments. Each value represents the mean ± SD of 3 separate replicates. **, P < 0.01; ns, not significant (one-way ANOVA). H-J Effects of Jas on ZIKV post entry step. Sertoli cells were incubated with ZIKV (MOI = 1) for 2 h and the supernatants were discarded, washed three times with PBS, then incubated with Jas at the corresponding concentration. The cell and supernatant samples were collected at 30 hpi. Measured by qRT-PCR, WB and plaque assay. The results are representative of three separate experiments. Each value represents the mean ± SD of 3 separate replicates. *, P < 0.05; **, P < 0.01; ****, P < 0.0001; ns, not significant (one-way ANOVA).
Fig. 5
Fig. 5
ZIKV E participates in the hyperpermeability of the in vitro mSCB model. A Effects of ZIKV infection on in vitro mSCB model. Primary mSCs were cultured on Transwell semipermeable membranes (0.4 μm pore size). Un-treated (mock) or treated with ZIKV at different MOIs when TEER values exceeds 50 Ω • cm2 and remains unchanged, detected TEER values at indicated time. Relative TEER: (Ωexperimental condition − Ωmedium alone)/(Ωmock − Ωmedium alone). The results are representative of three separate experiments. Each value represents the mean ± SD of 3 separate replicates. *, P < 0.05; **, P < 0.01 (two-way ANOVA). B Effects of the CytoD and TNF-α on in vitro mSCB model. CytoD (Control: DMEM containing 0.1% DMSO-treated) and TNF-α (Control: DMEM-treated) were treated on in vitro mSCB model and detected TEER values at indicated time. Relative TEER: (Ωexperimental condition − Ωmedium alone)/(Ωmock − Ωmedium alone). Each value represents the mean ± SD of 3 separate replicates. P values were analysed by comparing with the corresponding controls of 1 μg/mL CytoD and 1 ng/mL TNF-α respectively. ****, P < 0.0001 (two-way ANOVA). C Effects of ZIKV E overexprssion on in vitro mSCB model. Empty vector (mock) or pcDNA3.1(+)-Flag-E plasmid at different concentrations was transfected into mSCs, and TEER values were detected at different time points as indicated. Relative TEER: (Ωexperimental condition − Ωmedium alone)/(Ωmock − Ωmedium alone). The results are representative of three separate experiments. Each value represents the mean ± SD of 3 separate replicates. *, P < 0.05 (two-way ANOVA). D Co-IP of actin and ZO-1 after ZIKV infection and ZIKV E overexprssion. Sertoli cells were cultured overnight in 10 cm dishes, then un-treated (mock) or treated with ZIKV and transfected with empty vector or pcDNA3.1(+)-Flag-E plasmid at different concentrations, samples were collected after 48 h treatment. Cell lysate was immunoprecipitated with anti-ZO-1 or anti-mouse immunoglobulin G (IgG) antibody followed by SDS–PAGE and immunoblotting with anti-actin antibody. E Confocal microscopy analysis of the localization of ZO-1 after ZIKV infection and ZIKV E overexpression. Sertoli cells were un-treated (mock) or treated with ZIKV (MOI = 1) and transfected with 2 μg empty vector or 2 μg pcDNA3.1(+)-Flag-E plasmid. Then cells were fixed after 48 h treatment and stained with DAPI to label nuclei (blue), TRITC-phalloidin to label F-actin (red), and ZO-1 (green) were detected by anti-ZO-1 antibodies. The results are representative of three separate experiments. The scale bar indicates 25 μm. F Identification of E transfection efficiency in primary mSCs. Primary mSCs were transfected with empty vector or pcDNA3.1(+)-Flag-E plasmid and collected at 48 h after transfection, the expression of E, actin and ZO-1 was measured by WB.

Similar articles

Cited by

References

    1. Al-Obaidi MMJ, Bahadoran A, Wang SM, Manikam R, Raju CS, Sekaran SD. Disruption of the blood brain barrier is vital property of neurotropic viral infection of the central nervous system. Acta Virol. 2018;62:16–27. doi: 10.4149/av_2018_102. - DOI - PubMed
    1. Atkinson B, Thorburn F, Petridou C, Bailey D, Hewson R, Simpson AJ, Brooks TJ, Aarons EJ. Presence and persistence of Zika virus RNA in semen, United Kingdom, 2016. Emerg Infect Dis. 2017;23:611–615. doi: 10.3201/eid2304.161692. - DOI - PMC - PubMed
    1. Bass DM, Baylor M, Chen C, Upadhyayula U. Dansylcadaverine and cytochalasin D enhance rotavirus infection of murine L cells. Virology. 1995;212:429–437. doi: 10.1006/viro.1995.1500. - DOI - PubMed
    1. Campbell EM, Nunez R, Hope TJ. Disruption of the actin cytoskeleton can complement the ability of Nef to enhance human immunodeficiency virus type 1 infectivity. J Virol. 2004;78:5745–5755. doi: 10.1128/JVI.78.11.5745-5755.2004. - DOI - PMC - PubMed
    1. Cheng CY, Mruk DD. The blood–testis barrier and its implications for male contraception. Pharmacol Rev. 2012;64:16–64. doi: 10.1124/pr.110.002790. - DOI - PMC - PubMed

LinkOut - more resources