Comparative Study
. 2021 Feb 1;98(2):150-158.
doi: 10.1097/OPX.0000000000001643.

High- and Low-contrast Letter Acuity during Image Motion in Normal Observers and Observers with Infantile Nystagmus Syndrome

Affiliations
Comparative Study

High- and Low-contrast Letter Acuity during Image Motion in Normal Observers and Observers with Infantile Nystagmus Syndrome

Harold E Bedell et al. Optom Vis Sci. .

Abstract

Significance: High-contrast acuity in individuals with infantile nystagmus syndrome (INS) is poorer than expected from their ongoing retinal image motion, indicating a sensory loss. Conversely, acuity for larger low-contrast letters in these observers may be limited by image motion alone.

Purpose: The aim of this study was to assess visual acuity for letters of different contrast in normal observers and individuals with idiopathic INS under conditions of comparable retinal image motion.

Methods: Visual acuity was measured using projected Landolt C charts in 3 normal observers and 11 observers with presumed idiopathic INS. Normal observers viewed each chart after reflection from a front-surface mirror that underwent continuous 4-Hz ramp motion with amplitudes ranging from 4 to 9.6° and simulated foveation durations of 20 to 80 milliseconds. Observers with INS viewed the charts directly. By reciprocally varying the luminance of the projected charts and a superimposed veiling source, Landolt C's were presented on a background luminance of 43 cd/m2 with Weber contrasts between -12 and -89%.

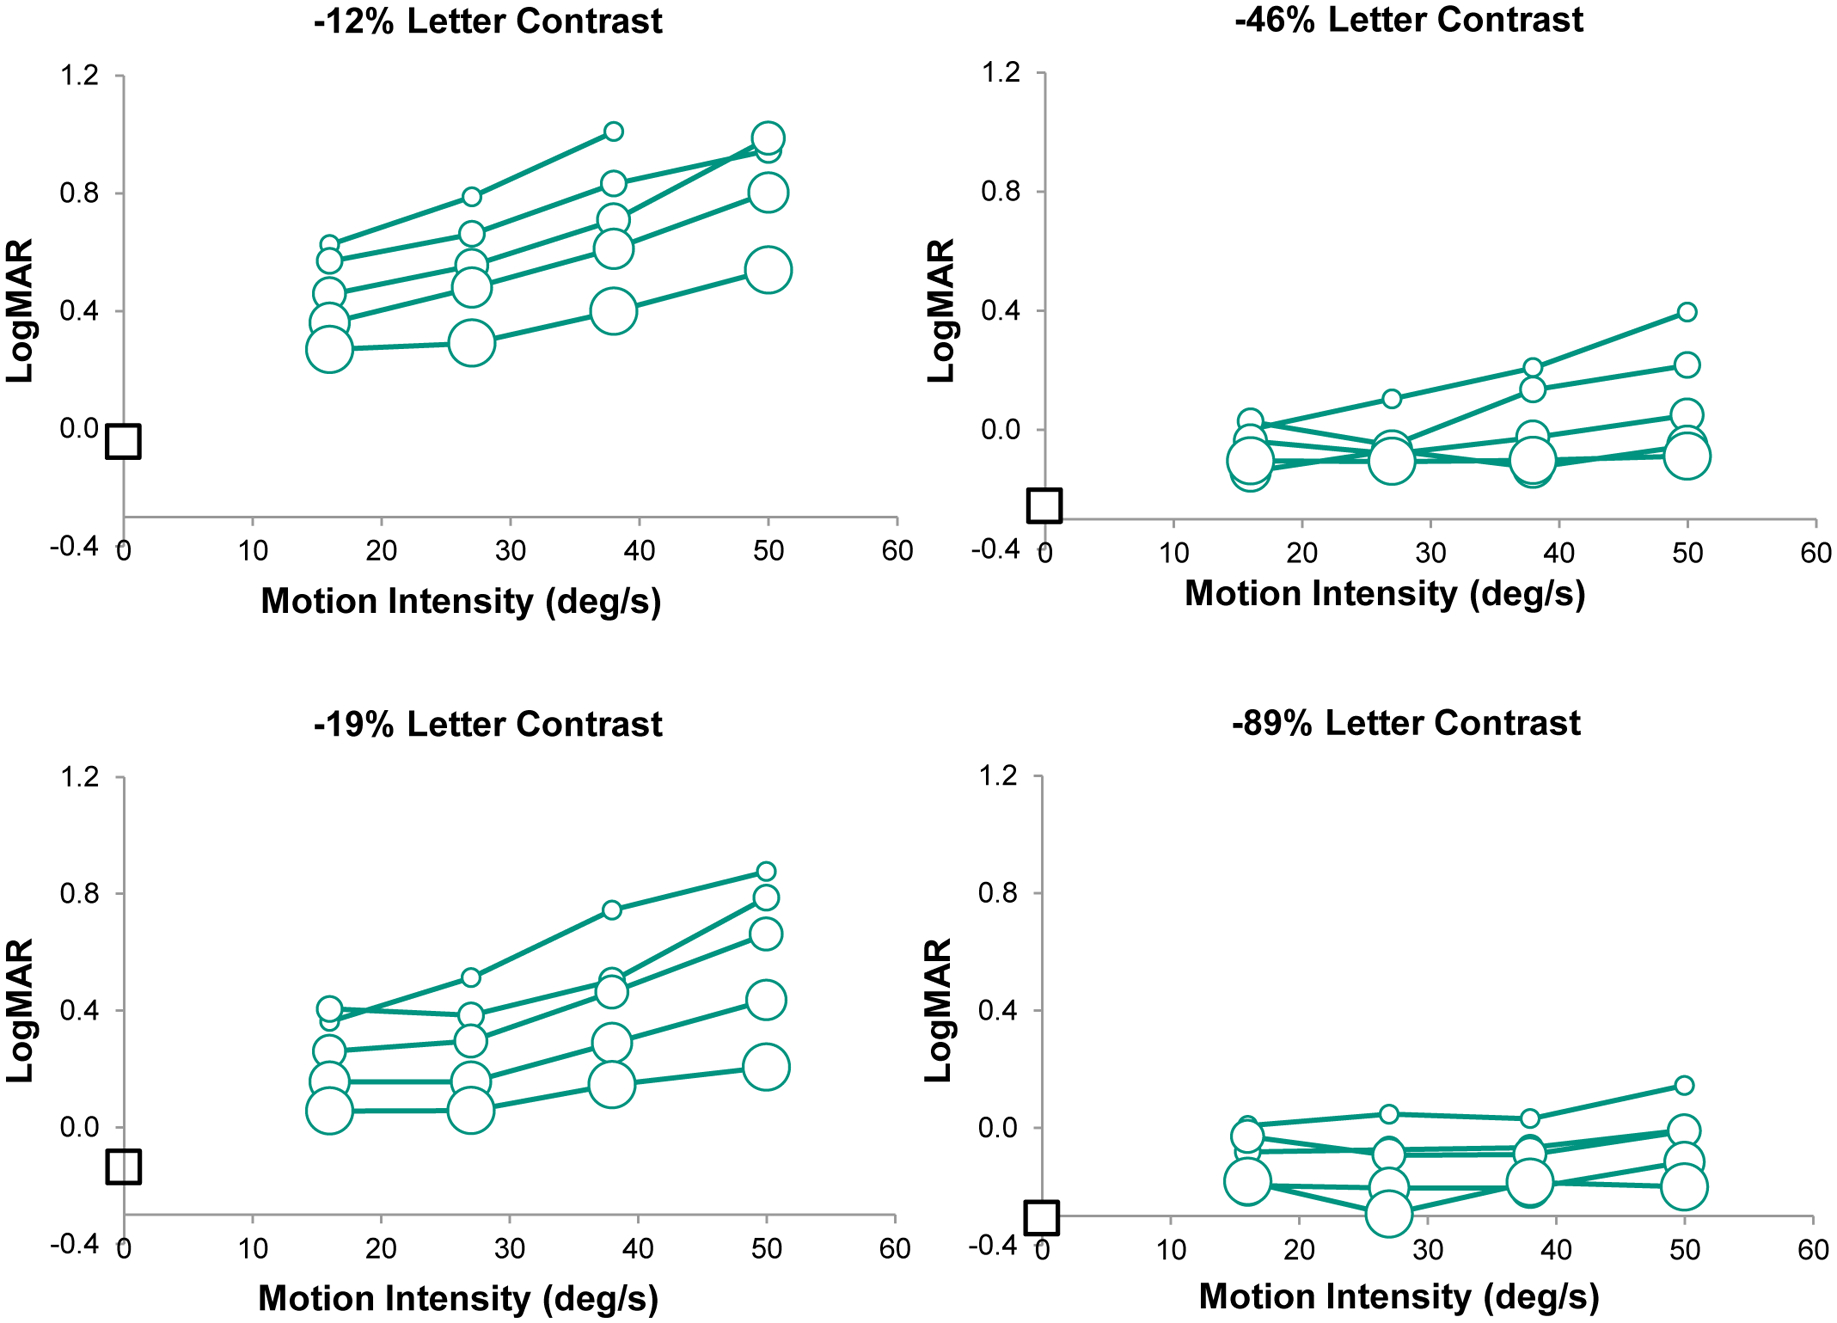
Results: Whereas normal observers' high-contrast acuity during imposed image motion depends only on the duration of the simulated foveation periods, acuity for low-contrast optotypes also worsens systematically as motion intensity (frequency × amplitude) increases. For comparable parameters of retinal image motion, high-contrast acuity in all but one of the observers with INS was poorer than in normal observers. On the other hand, low-contrast acuity in the two groups of observers was similar when the retinal image motion was comparable.

Conclusions: Reduced high-contrast acuity in observers with INS appears to be attributable primarily to a sensory deficit. On the other hand, the reduction of low-contrast acuity in observers with INS may be accounted for on the basis of retinal image motion.


Conflict of interest statement

Conflict of Interest Disclosure: Neither author reports any conflict of interest.

Figures

Figure 1.
Figure 1.
Average LogMAR visual acuity of 3 normal observers is plotted against the intensity of imposed image motion for 4 contrasts of the Landolt C targets. Data for the different target contrasts are shown in separate panels. Within each panel, results are shown for 5 simulated foveation durations (20, 30, 40, 50 and 80 ms), indicated by symbols of increasing size. LogMAR acuity in the absence of imposed motion is represented by the square symbol on the left hand axis of each plot. To prevent clutter, error bars are not included. The mean standard error across all conditions is 0.05 logMAR.
Figure 2.
Figure 2.
Average logMAR visual acuity of 3 normal observers is plotted against the log of the temporally integrated contrast (TIC), defined as the target contrast × the simulated foveation duration. The plot includes data for all of the conditions of imposed motion shown in Figure 1. Different intensities of imposed motion are represented by different unfilled symbols: 16 deg/s = triangles; 26.8 deg/s = diamonds; 38 deg/s = squares; 50.4 deg/s = circles. Straight lines fit to the data for each intensity of motion for log(TIC) < 1.25 show a systematic increase in (negative) slope: 16 deg/s = −0.755; 26.8 deg/s = −0.951; 38 deg/s = −1.128; 50.4 deg/s = −1.272, with coefficients of determination (r2) between 0.86 and 0.96. The solid black line fit to the logMAR data for all intensities of motion for log(TIC) > 1.25 has a slope of −0.311, with a coefficient of determination equal to 0.574. Average normal data for the condition with no imposed motion are indicated by filled black triangles and are described by the dashed line with slope = −0.301 (r2 = 0.97). The data points for the no-motion condition are placed on the log(TIC) axis assuming that visual-target information is integrated for a duration of 116 ms (see text).
Figure 3.
Figure 3.
LogMAR visual acuity for 11 observers with INS is plotted against the absolute value of Landolt-C contrast on a logarithmically scaled axis. The data for different observers with INS are superimposed on the average results of the 3 normal observers, in separate panels corresponding to different intensities of imposed motion: 16 (top panel), 26.8 (middle panel) and 50.4 deg/s (bottom panel). The data for each observer with INS (connected by heavy solid lines) are located on the panel that contains data from normal observers with the most similar intensity of image motion. Normal data are shown as thin dashed lines of different color to represent different simulated foveation durations: 20 ms (purple), 30 ms (blue), 40 ms (blue green), 50 ms (orange) and 80 ms (dark red). The results of the observers with INS are color coded similarly, according to the mean duration of their foveation periods. The symbols for the different observers are: (top panel) GE: blue green circles, CNU: orange triangles, MIS: red squares, SME: red triangles, CNI: red diamonds, JH: red circles; (middle panel) FR: blue green triangles, DV: blue green diamonds, MSG: orange circles; (bottom panel) SMA: blue green diamonds, AJ: red circles. The dashed black line near the bottom of each panel shows average normal results in the absence of imposed image motion.
Figure 4.
Figure 4.
LogMAR acuities of the normal observers (unfilled triangles) and individuals with INS (filled circles) are presented as a function of the simulated/measured foveation duration. The top and bottom panels show results for acuity targets of −89 and −12% contrast, respectively. In each panel, the solid line represents an exponential of the form logMAR = a + b × exp(−c × Duration) that bests fit the normal data. Fitted parameters are a = −0.308, b = 0.600, and c = −0.0259) in the top panel and a = −0.045, b = 1.123, and c = −0.0121 in the bottom panel. Time constants of the fitted exponential curves are −1/c, corresponding to 38.6 ms in the top panel and 83.0 ms in the bottom panel.

References

    1. Abadi RV, Bjerre A. Motor and Sensory Characteristics of Infantile Nystagmus. Br J Ophthalmol 2002;86:1152–60. - PMC - PubMed
    1. Hanson KS, Bedell HE, White JM, Ukwade MT. Distance and Near Visual Acuity in Infantile Nystagmus. Optom Vis Sci 2006;83:823–9. - PubMed
    1. McLean R, Proudlock F, Thomas S, Degg C. et al. Congenital Nystagmus: Randomized, Controlled, Double-masked Trial of Memantine/Gabapentin. Ann Neurol 2007:61:130–8. - PubMed
    1. Dell’Osso LF, Daroff RB. Congenital Nystagmus Waveforms and Foveation Strategy. Doc Ophthalmol 1975;39:155–82. - PubMed
    1. Abadi RV, Worfolk R. Retinal Slip Velocities in Congenital Nystagmus. Vision Res 1989;29:195–205. - PubMed

Publication types

Supplementary concepts