. 2021 Apr 19;32(9):995-1005.
doi: 10.1091/mbc.E20-12-0784. Epub 2021 Feb 3.

Predicting cell health phenotypes using image-based morphology profiling

Affiliations

Predicting cell health phenotypes using image-based morphology profiling

Gregory P Way et al. Mol Biol Cell. .

Abstract

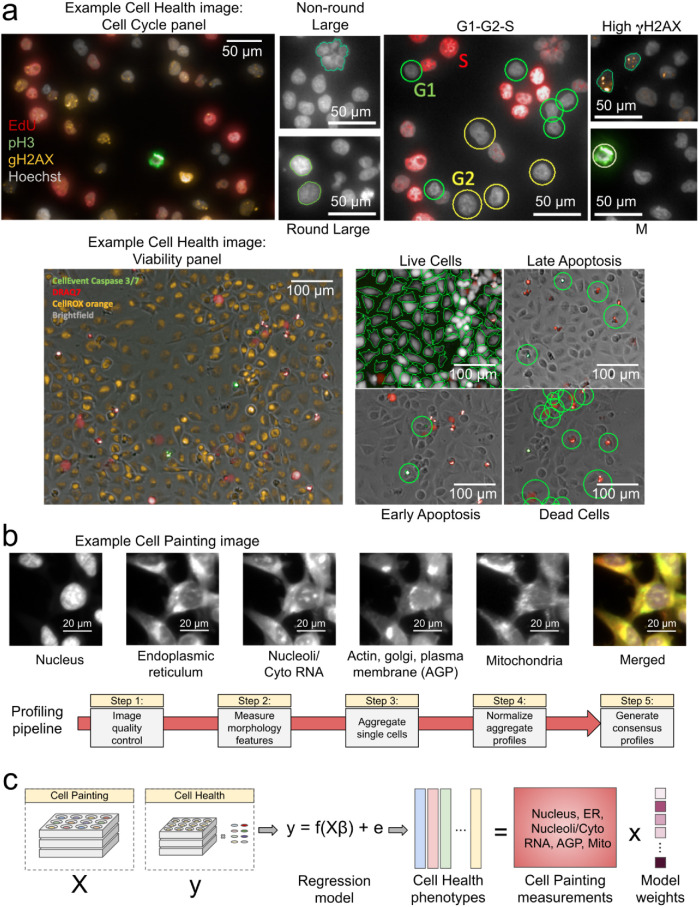
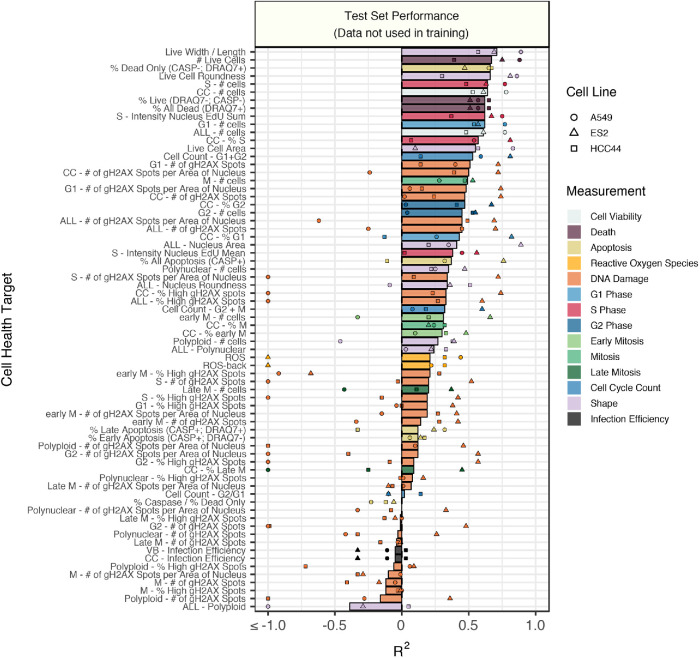
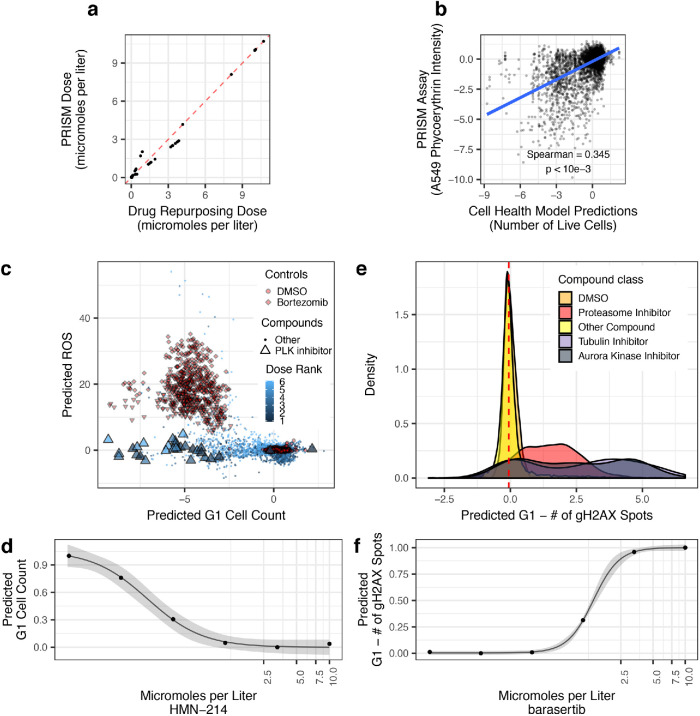
Genetic and chemical perturbations impact diverse cellular phenotypes, including multiple indicators of cell health. These readouts reveal toxicity and antitumorigenic effects relevant to drug discovery and personalized medicine. We developed two customized microscopy assays, one using four targeted reagents and the other three targeted reagents, to collectively measure 70 specific cell health phenotypes including proliferation, apoptosis, reactive oxygen species, DNA damage, and cell cycle stage. We then tested an approach to predict multiple cell health phenotypes using Cell Painting, an inexpensive and scalable image-based morphology assay. In matched CRISPR perturbations of three cancer cell lines, we collected both Cell Painting and cell health data. We found that simple machine learning algorithms can predict many cell health readouts directly from Cell Painting images, at less than half the cost. We hypothesized that these models can be applied to accurately predict cell health assay outcomes for any future or existing Cell Painting dataset. For Cell Painting images from a set of 1500+ compound perturbations across multiple doses, we validated predictions by orthogonal assay readouts. We provide a web app to browse predictions: http://broad.io/cell-health-app. Our approach can be used to add cell health annotations to Cell Painting datasets.


Figures

FIGURE 1:
FIGURE 1:
Data processing and modeling approach. (a) Example images and workflow from the Cell Health assays. We apply a series of manual gating strategies (see Materials and Methods) to isolate cell subpopulations and to generate cell health readouts for each perturbation. (Top) In the “Cell Cycle” panel, in each nucleus we measure Hoechst, EdU, PH3, and gH2AX. (Bottom) In the “Viability” panel, we capture DPC images, measure Caspase 3/7, DRAQ7, and CellROX. (b) Example Cell Painting image across five channels, plus a merged representation across channels. The image is cropped from a larger image and shows ES2 cells. Scale bars are 20 µm. Below are the steps applied in an image-based profiling pipeline, after features have been extracted from each cell’s image. (c) Modeling approach where we fit 70 different regression models using CellProfiler features derived from Cell Painting images to predict Cell Health readouts. Model weights refer to the coefficients derived from each regression model.
FIGURE 2:
FIGURE 2:
Test set model performance of predicting 70 Cell Health readouts with independent regression models. Performance for each phenotype is shown, sorted by decreasing R2 performance. The bars are colored based on the primary measurement metadata (see Supplemental Table S3), and they represent performance aggregated across the three cell lines. The points represent cell line specific performance. Points falling below –1 are truncated to –1 on the x-axis. See Supplemental Figure S4 for a full depiction.
FIGURE 3:
FIGURE 3:
The importance of each class of Cell Painting features in predicting 70 Cell Health readouts. Each square represents the mean absolute value of model coefficients weighted by test set R2 across every model. The features are broken down by compartment (Cells, Cytoplasm, and Nuclei), channel (AGP, Nucleus, ER, Mito, Nucleolus/Cyto RNA), and feature group (AreaShape, Neighbors, Channel Colocalization, Texture, Radial Distribution, Intensity, and Granularity). The number of features in each group, across all channels, is indicated. For a complete description of all features, see the handbook: http://cellprofiler-manual.s3.amazonaws.com/CellProfiler-3.0.0/index.html. Dark gray squares indicate “not applicable,” meaning either that there are no features in the class or that the features did not survive an initial preprocessing step. Note that for improved visualization we multiplied the actual model coefficient value by 100.
FIGURE 4:
FIGURE 4:
Validating Cell Health models to Cell Painting data from The Drug Repurposing Hub. The models were not trained using the Drug Repurposing Hub data. (a) The results of the dose alignment between the PRISM assay and the Drug Repurposing Hub data. This view indicates that there was not a one-to-one matching between perturbation doses. (b) Comparing viability estimates from the PRISM assay to the predicted number of live cells in the Drug Repurposing Hub. The PRISM assay estimates viability by measuring barcoded A549 cells after an incubation period. (c) Drug Repurposing Hub profiles stratified by G1 cell count and ROS predictions. Bortezomib and MG-132 are proteasome inhibitors and are used as positive controls in the Drug Repurposing Hub set; DMSO is a negative control. We also highlight all PLK inhibitors in the dataset. (d) HMN-214 is an example of a PLK inhibitor that shows strong dose response for G1 cell count predictions. (e) Tubulin and aurora kinase inhibitors are predicted to have a high number of gH2AX spots in G1 cells compared to other compounds and controls. (f) Barasertib (AZD1152) is an aurora kinase inhibitor that is predicted to have a strong dose response for the number of gH2AX spots in G1 cells predictions.

References

    1. Aguirre AJ, Meyers RM, Weir BA, Vazquez F, Zhang C-Z, Ben-David U, Cook A, Ha G, Harrington WF, Doshi MB, et al. (2016). Genomic Copy Number Dictates a Gene-Independent Cell Response to CRISPR/Cas9 Targeting. Cancer Discov 6, 914–929. - PMC - PubMed
    1. Bray M-A, Singh S, Han H, Davis CT, Borgeson B, Hartland C, Kost-Alimova M, Gustafsdottir SM, Gibson CC, Carpenter AE (2016). Cell Painting, a high-content image-based assay for morphological profiling using multiplexed fluorescent dyes. Nat Protoc 11, 1757–1774. - PMC - PubMed
    1. Caicedo JC, Cooper S, Heigwer F, Warchal S, Qiu P, Molnar C, Vasilevich AS, Barry JD, Bansal HS, Kraus O, et al. (2017). Data-analysis strategies for image-based cell profiling. Nat Methods 14, 849–863. - PMC - PubMed
    1. Caicedo JC, McQuin C, Goodman A, Singh S, Carpenter AE (2018). Weakly Supervised Learning of Single-Cell Feature Embeddings. Proc IEEE Comput Soc Conf Comput Vis Pattern Recognit 2018, 9309–9318. - PMC - PubMed
    1. Caicedo JC, Singh S, Carpenter AE (2016). Applications in image-based profiling of perturbations. Curr Opin Biotechnol 39, 134–142. - PubMed

Publication types

LinkOut - more resources