. 2021 Feb 3;16(2):e0246647.
doi: 10.1371/journal.pone.0246647. eCollection 2021.

Open-source RNA extraction and RT-qPCR methods for SARS-CoV-2 detection

Affiliations

Open-source RNA extraction and RT-qPCR methods for SARS-CoV-2 detection

Thomas G W Graham et al. PLoS One. .

Abstract

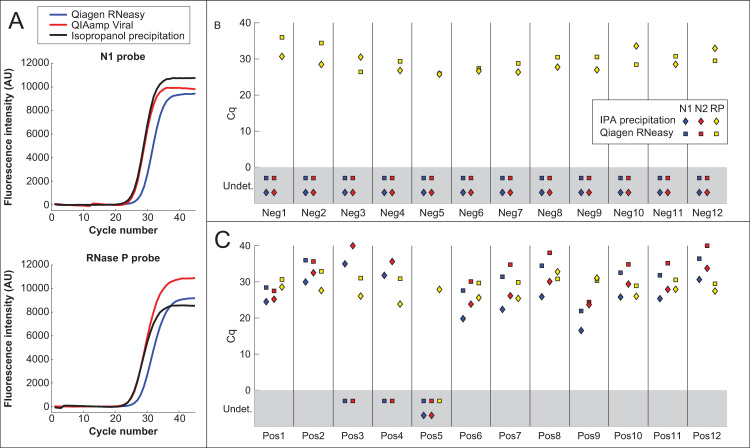
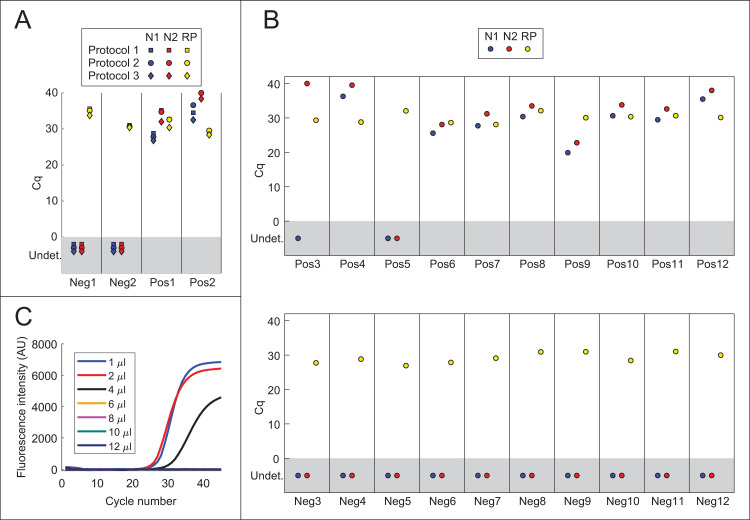
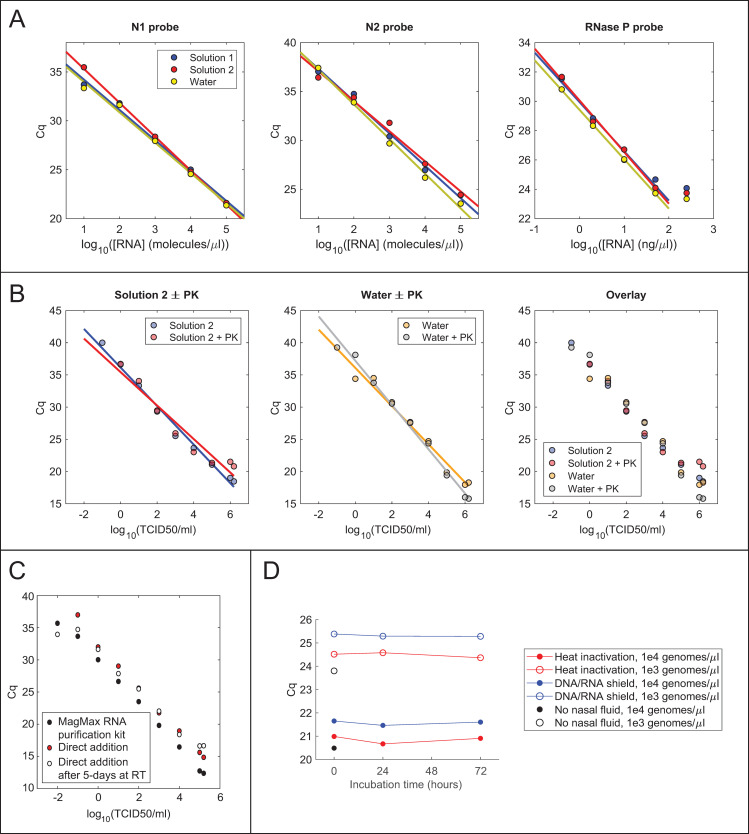
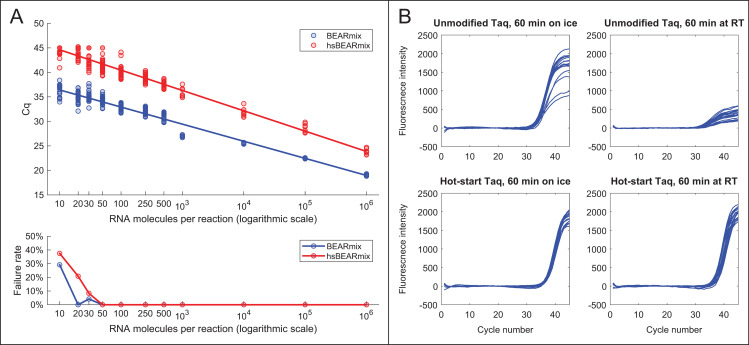
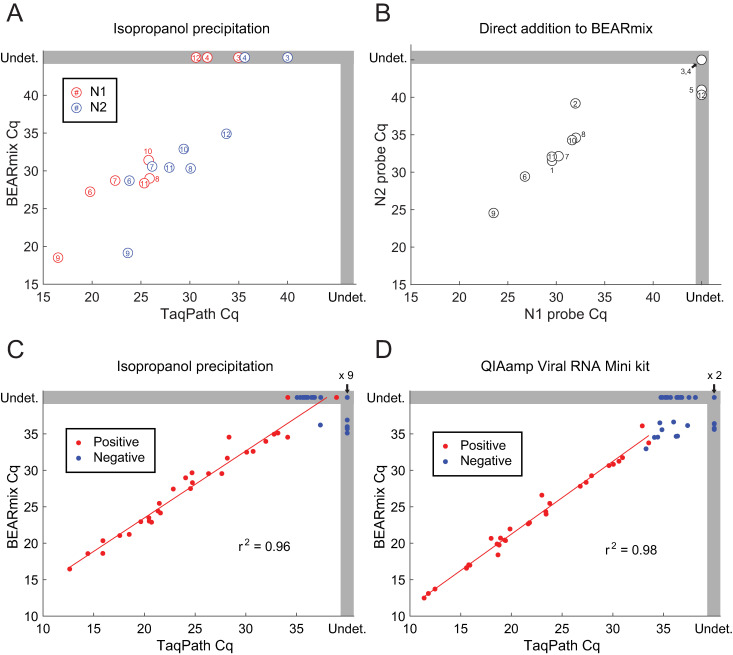
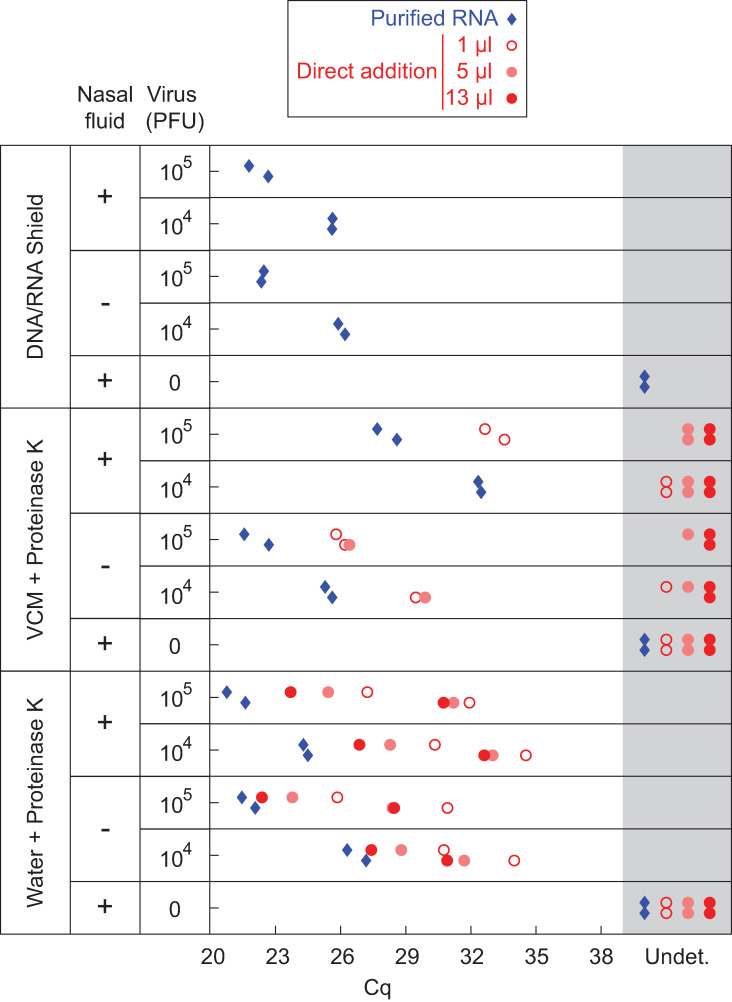
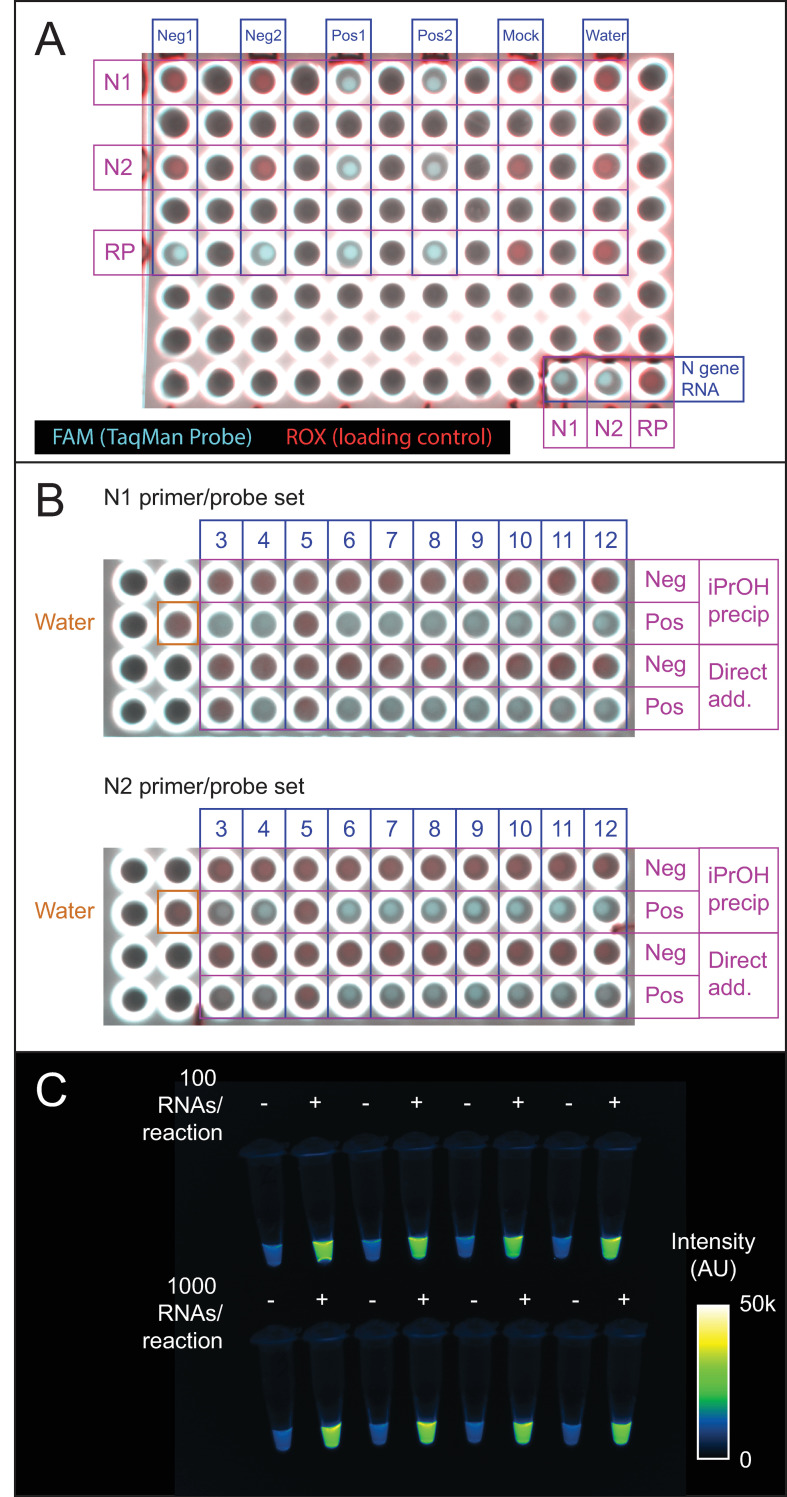
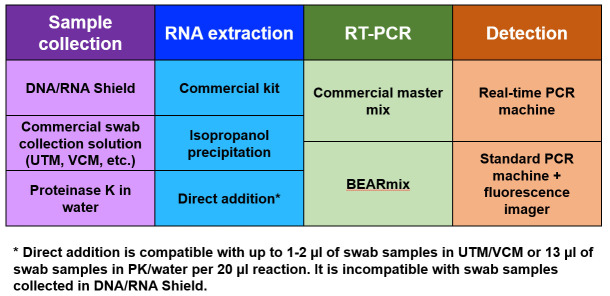
Re-opening of communities in the midst of the ongoing COVID-19 pandemic has ignited new waves of infections in many places around the world. Mitigating the risk of reopening will require widespread SARS-CoV-2 testing, which would be greatly facilitated by simple, rapid, and inexpensive testing methods. This study evaluates several protocols for RNA extraction and RT-qPCR that are simpler and less expensive than prevailing methods. First, isopropanol precipitation is shown to provide an effective means of RNA extraction from nasopharyngeal (NP) swab samples. Second, direct addition of NP swab samples to RT-qPCRs is evaluated without an RNA extraction step. A simple, inexpensive swab collection solution suitable for direct addition is validated using contrived swab samples. Third, an open-source master mix for RT-qPCR is described that permits detection of viral RNA in NP swab samples with a limit of detection of approximately 50 RNA copies per reaction. Quantification cycle (Cq) values for purified RNA from 30 known positive clinical samples showed a strong correlation (r2 = 0.98) between this homemade master mix and commercial TaqPath master mix. Lastly, end-point fluorescence imaging is found to provide an accurate diagnostic readout without requiring a qPCR thermocycler. Adoption of these simple, open-source methods has the potential to reduce the time and expense of COVID-19 testing.


Conflict of interest statement

The authors have declared that no competing interests exist.

Figures

Fig 1
Fig 1. RNA extraction by isopropanol precipitation.
(A) TaqPath amplification curves of a mixture of human cell RNA and in vitro-transcribed SARS-CoV-2 N gene RNA purified using the Qiagen RNeasy Mini kit, QIAamp Viral RNA Mini kit, or isopropanol precipitation. Isopropanol precipitation gives RNA recovery better than the RNeasy kit and comparable to the QIAamp Viral kit. (B-C) Cq values of RNA from positive (Pos) and negative (Neg) NP swab samples in UTM, purified using either the Qiagen RNeasy Mini kit (squares) or isopropanol precipitation (diamonds). Reactions were performed using TaqPath master mix with the CDC SARS-CoV-2 N1 and N2 probes (blue and red points) and the human RNAse P (RP) control probe (yellow points). For points in the gray rectangle, no amplification was observed and Cq values were "undetermined" (Undet).
Fig 2
Fig 2. Direct addition of swab samples to RT-PCRs.
(A) Direct addition of 1 μL of swab sample to 20 μL TaqPath reactions containing N1 (blue), N2 (red), or RNase P (RP; yellow) primer/probe mixtures. Samples were heat-inactivated using one of three protocols: 1) 75°C for 30 min, 2) 95°C for 5 min, followed by 75°C for 30 min, 3) 37°C for 30 min in the presence of 0.4 mg/mL proteinase K, followed by 95°C for 5 min and 75°C for 30 min. (B) Detection of SARS-CoV-2 in positive (Pos) and negative (Neg) NP swab samples by direct addition. Proteinase K was added to each sample to a final concentration of 0.4 mg/mL, and samples were incubated at 37°C for 30 min, 95°C for 5 min and 75°C for 30 min. 1 μL of swab sample was added to 20 μL TaqPath reactions containing N1 (blue), N2 (red), and RNase P (RP; yellow) primer/probe mixtures. (C) Direct addition of different quantities of heat-inactivated swab samples in UTM to TaqPath master mix. The indicated amounts of positive swab sample Pos1 were added to 20 μL TaqPath reactions containing probe N1. See also S1B Fig.
Fig 3
Fig 3. Swab collection solutions optimized for direct addition.
(A) RT-qPCR of N gene RNA or human cell RNA in swab collection solutions. RNA was diluted to the indicated concentration in Solution 1 (10 mM Tris, pH 8, 1 mM EDTA, 0.2% Tween 20, 0.2 mM DTT), Solution 2 (10 mM Tris, pH 8, 1 mM EDTA, 0.5% Tween 20, 0.5 mM DTT), or water, and 10 μL of each dilution were analyzed in 20 μL TaqPath reactions containing the indicated probes. (B) Direct addition to RT-qPCR of cultured SARS-CoV-2 heat-inactivated with or without proteinase K treatment in either water or Solution 2 (10 mM Tris, pH 8, 1 mM EDTA, 0.5% Tween 20, 0.5 mM DTT). 13.5 μL of each sample was added to a 20 μL TaqPath reaction. (C) Comparison of viral detection by direct addition or RNA extraction with the MagMax Viral RNA isolation kit (Thermo Fisher). Cultured SARS-CoV-2 was diluted to the indicated number of infectious units into 0.4 mg/mL proteinase K in water. RNA was analyzed using TaqPath master mix and the N1 primer/probe mixture, either by direct addition of 13.5 μL of heat-inactivated sample to a 20 μL reaction or by addition of 5 μL of purified RNA to a 20 μL reaction. (D) Stability of viral RNA in contrived swab samples in PK collection solution. Cq values from TaqPath RT-qPCRs with the N1 probe for virus alone in 1x DNA/RNA Shield (black points) or virus mixed with human nasal fluid, diluted into proteinase K solution, and allowed to incubate for different amounts of time at room temperature prior to heat-inactivation (red points) or inactivation with an equal volume of 2x DNA/RNA Shield (blue points). Results for two different concentrations of virus are shown.
Fig 4
Fig 4. “BEARmix”: An open-source, one-step RT-qPCR master mix.
(A) Top panel: Standard curves of BEARmix with unmodified Taq polymerase (blue) and formaldehyde-crosslinked hot-start Taq polymerase (red). Linear fit for non-hot-start BEARmix: Cq = 39.9–3.489x (amplification factor 1.93), where x is the logarithm with base 10 of the number of RNAs per reaction. Linear fit for hot-start BEARmix: Cq = 48.8–4.15x (amplification factor = 1.74). Bottom panel: Fraction of reactions that did not show amplification (failure rate) for each RNA concentration. N = 24 reactions for 10 to 500 copies of RNA, N = 8 reactions for 1000 to 106 copies. (B) Homemade hot-start Taq polymerase permits reaction setup at room temperature. BEARmix reactions were set up using unmodified and hot-start (crosslinked) Taq polymerase with 20 molecules of N gene RNA per reaction. Reactions were performed in a qPCR thermocycler after incubation for 60 min either on ice or at room temperature. In contrast to regular Taq polymerase, amplification by hot-start Taq polymerase is not inhibited by incubating reactions for 60 min at room temperature prior to running the RT-qPCR cycle.
Fig 5
Fig 5. Analysis of clinical samples using BEARmix.
(A) Scatterplot of Cq values from RT-qPCR of isopropanol-precipitated NP swab samples using BEARmix and TaqPath. Each circle represents the average of two replicates for an individual positive specimen, with the same numbering as in previous figures. TaqPath Cq values are re-plotted from Fig 1B and 1C. Undet., Undetermined Cq value (no amplification observed). (B) Scatterplot of Cq values for N1 and N2 probes from direct addition of 0.5 μL of clinical swab samples in UTM to 10 μL BEARmix reactions. Each point is the average of a pair of qPCR duplicates. C,D) Cq values of RNA from positive (red points) and negative (blue points) clinical NP swab samples purified using isopropanol precipitation (C) or the QIAamp Viral RNA Mini kit (D) and assayed using the N1 probe with BEARmix or TaqPath.
Fig 6
Fig 6. RT-qPCR of contrived swab samples.
Indicated quantities of in vitro-cultured SARS-CoV-2 were mixed with the swab collection solutions listed in the leftmost column, either alone or in combination with human nasal fluid. Samples were analyzed by RT-qPCR using BEARmix with the N1 primer/probe set either after RNA extraction with the QIAmp Viral RNA purification kit (blue diamonds) or by direct addition (red circles). Two qPCR replicates are shown in separate vertical rows for each condition.
Fig 7
Fig 7. Endpoint fluorescence detection.
(A) Endpoint fluorescence image of the qPCR plate used for the first two clinical samples in Fig 1B and 1C. Shown is a 2-channel overlay in which the ROX control dye in TaqPath master mix appears in the rhodamine channel (red) and dequenched FAM product from the TaqMan probe appears in the fluorescein (cyan) channel. An N gene RNA positive control is in the lower right-hand corner. Positive and negative samples are clearly distinguishable based on fluorescence in the FAM channel. Note that leaving empty spaces between samples was an arbitrary choice. B) BioRad Chemidoc fluorescence image of the qPCR plate used for the IPA precipitation and direct addition reactions in Fig 1B, 1C and 2B. Positive and negative samples distinguishable by qPCR are also distinguishable by endpoint fluorescence imaging. Red, rhodamine (0.5 s exposure). Cyan, fluorescein (0.05 s exposure). Scale is set from 0 to 55000 counts for each channel. C) Endpoint detection using the N2 probe set and BEARmix. Reactions were set up in alternating tubes with water (negative control) or in vitro-transcribed N gene RNA at 100 or 1000 copies per reaction. An image taken with a 0.1 s exposure time in the fluorescein channel of a ChemiDoc imager (BioRad) is displayed using the Fiji "Green Fire Blue" colormap with lower and upper limits set to 0 and 50000.
Fig 8
Fig 8. Summary of testing options.
Working protocols can be assembled from various combinations of sample collection, RNA extraction, RT-PCR, and detection methods. Economical alternatives are available at each step.

Similar articles

Cited by

References

    1. Mervosh S, Fernandez M. ‘It’s Like Having No Testing’: Coronavirus Test Results Are Still Delayed. New York Times. 7 August 2020. Available: https://www.nytimes.com/2020/08/04/us/virus-testing-delays.html
    1. Larremore DB, Wilder B, Lester E, Shehata S, Burke JM, Hay JA, et al. Test sensitivity is secondary to frequency and turnaround time for COVID-19 surveillance. medRxiv Prepr Serv Heal Sci. 2020. 10.1101/2020.06.22.20136309 - DOI - PMC - PubMed
    1. Centers for Disease Control and Prevention. CDC 2019-novel coronavirus (2019-nCoV) real-time RT-PCR diagnostic panel for emergency use only instructions for use. Atlanta; 2020.
    1. Akst J. RNA Extraction Kits for COVID-19 Tests Are in Short Supply in US. Sci. 2020. Available: https://www.the-scientist.com/news-opinion/rna-extraction-kits-for-covid...
    1. Won J, Lee S, Park M, Kim TY, Park MG, Choi BY, et al. Development of a Laboratory-safe and Low-cost Detection Protocol for SARS-CoV-2 of the Coronavirus Disease 2019 (COVID-19). Exp Neurobiol. 2020;29: 107–119. 10.5607/en20009 - DOI - PMC - PubMed

Publication types

MeSH terms

Substances