. 2021 Feb 3;223(2):197-205.
doi: 10.1093/infdis/jiaa618.

Dynamics of Neutralizing Antibody Titers in the Months After Severe Acute Respiratory Syndrome Coronavirus 2 Infection

Affiliations

Dynamics of Neutralizing Antibody Titers in the Months After Severe Acute Respiratory Syndrome Coronavirus 2 Infection

Katharine H D Crawford et al. J Infect Dis. .

Abstract

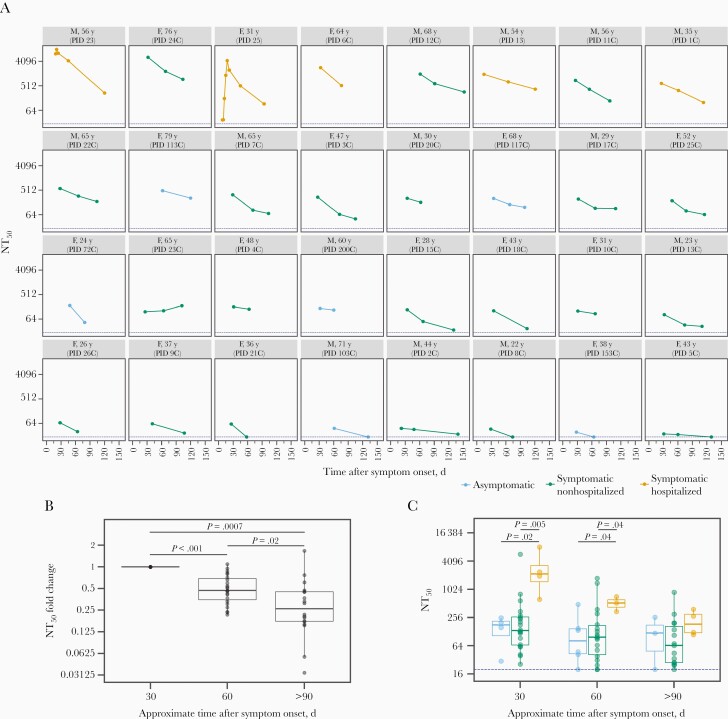
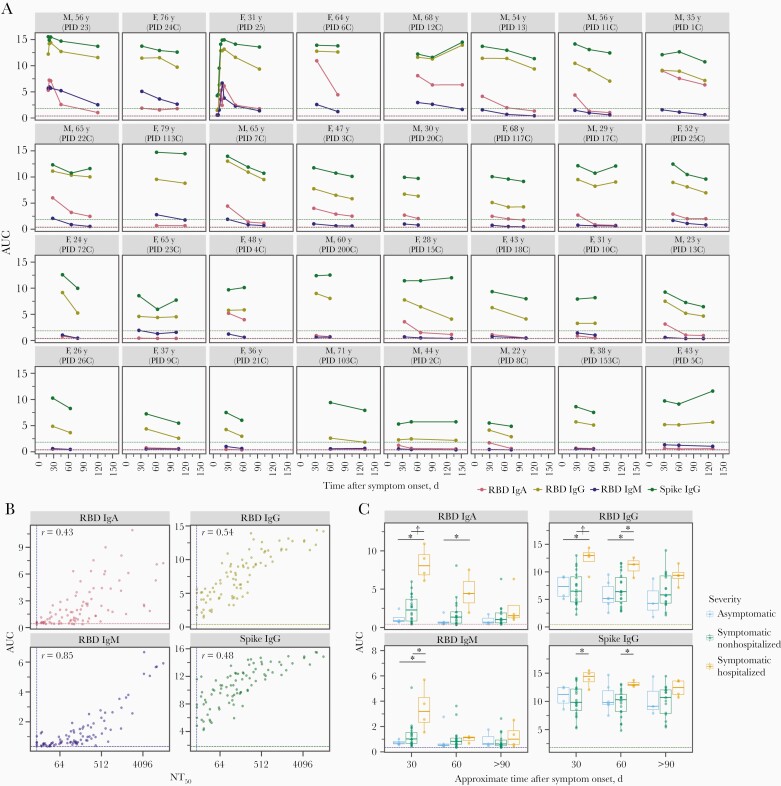
Most individuals infected with severe acute respiratory syndrome coronavirus 2 (SARS-CoV-2) develop neutralizing antibodies that target the viral spike protein. In this study, we quantified how levels of these antibodies change in the months after SARS-CoV-2 infection by examining longitudinal samples collected approximately 30-152 days after symptom onset from a prospective cohort of 32 recovered individuals with asymptomatic, mild, or moderate-severe disease. Neutralizing antibody titers declined an average of about 4-fold from 1 to 4 months after symptom onset. This decline in neutralizing antibody titers was accompanied by a decline in total antibodies capable of binding the viral spike protein or its receptor-binding domain. Importantly, our data are consistent with the expected early immune response to viral infection, where an initial peak in antibody levels is followed by a decline to a lower plateau. Additional studies of long-lived B cells and antibody titers over longer time frames are necessary to determine the durability of immunity to SARS-CoV-2.

Keywords: COVID-19; RBD; SARS-CoV-2; antibody dynamics; neutralizing antibodies; spike.


Figures

Figure 1.
Figure 1.
Change in neutralizing antibody titer over time. A, Neutralizing antibody titer at 50% inhibition (NT50) for each individual in the study, with facets colored according to disease severity (see key below plot). Facet titles indicate sex (F, female; M, male), age, and participant identifier (PID). Dashed blue line indicates the limit of detection for our assay (NT50 = 20). B, Fold change in NT50 compared with 30-day time point, including only individuals with a neutralizing sample at day 30. P values were calculated using the Wilcoxon signed rank test. C, Distribution of NT50 values at the 3 time points, with box plots colored by disease severity and the blue dashed line indicating the limit of detection as in panel A. P values are indicated when there is a significant difference (P ≤0.05) between NT50 values for different disease severity categories at a time point and were calculated using the Wilcoxon rank sum test.
Figure 2.
Figure 2.
Immunoglobulin (Ig) A, IgM, and IgG antibody binding titers over time. A, Longitudinal binding antibody titers for each individual as quantified by area under the curve (AUC) of enzyme-linked immunosorbent assays (ELISAs). Facets are arranged by maximal neutralizing antibody titer at 50% inhibition (NT50) from top left to bottom right, as in Figure 1A. Dashed lines indicate the AUC value for the negative control sample (2017–2018 serum sample pool) for each assay, colored by assay. Abbreviations: F, female; M, male; PID, participant identifier; RBD, receptor-binding domain. B, Correlation plots between AUC for each ELISA and neutralization titer (NT50) for all samples. Vertical dashed line indicates the limit of detection for the neutralization assay; horizontal dashed lines, the AUC values for the negative control sample (2017–2018 serum sample pool) for each assay, colored based on the assay as in A. C, For each antibody type measured, individuals who were symptomatic and required hospitalization as part of their care had significantly higher antibody levels during the first 1–2 months after symptom onset. *P ≤ .05; †P ≤ .01. P values were calculated using the Wilcoxon rank sum test. As in A and B, the dashed line in each facet indicates the AUC value for the negative control sample for each assay, colored by assay.

References

    1. Wang X, Guo X, Xin Q, et al. Neutralizing antibodies responses to SARS-CoV-2 in COVID-19 inpatients and convalescent patients. Clin Infect Dis doi:org/10.1093/cid/ciaa721. - PMC - PubMed
    1. Wu F, Wang A, Liu M, et al. Neutralizing antibody responses to SARS-CoV-2 in a COVID-19 recovered patient cohort and their implications.medRxiv [Preprint]. 20 April 2020. Available from: 10.1101/2020.03.30.20047365. Accessed 20 July 2020. - DOI
    1. Lei Q, Li Y, Hou H‐y, et al. Antibody dynamics to SARS‐CoV‐2 in asymptomatic COVID‐19 infections [Accepted Author Manuscript]. Allergy 2020; doi: 10.1111/all.14622. - DOI - PMC - PubMed
    1. Long QX, Liu BZ, Deng HJ, et al. Antibody responses to SARS-CoV-2 in patients with COVID-19. Nat Med 2020; 26:845–8. - PubMed
    1. Seow J, Graham C, Merrick B, et al. Longitudinal evaluation and decline of antibody responses in SARS-CoV-2 infection. medRxiv [Preprint]. 11 July 2020. Available from: https://www.medrxiv.org/content/10.1101/2020.07.09.20148429v1. - DOI

Publication types

Substances