. 2021 Feb 1;11(2):213.
doi: 10.3390/diagnostics11020213.

USH2A-Related Retinitis Pigmentosa: Staging of Disease Severity and Morpho-Functional Studies

Affiliations

USH2A-Related Retinitis Pigmentosa: Staging of Disease Severity and Morpho-Functional Studies

Benedetto Falsini et al. Diagnostics (Basel). .

Abstract

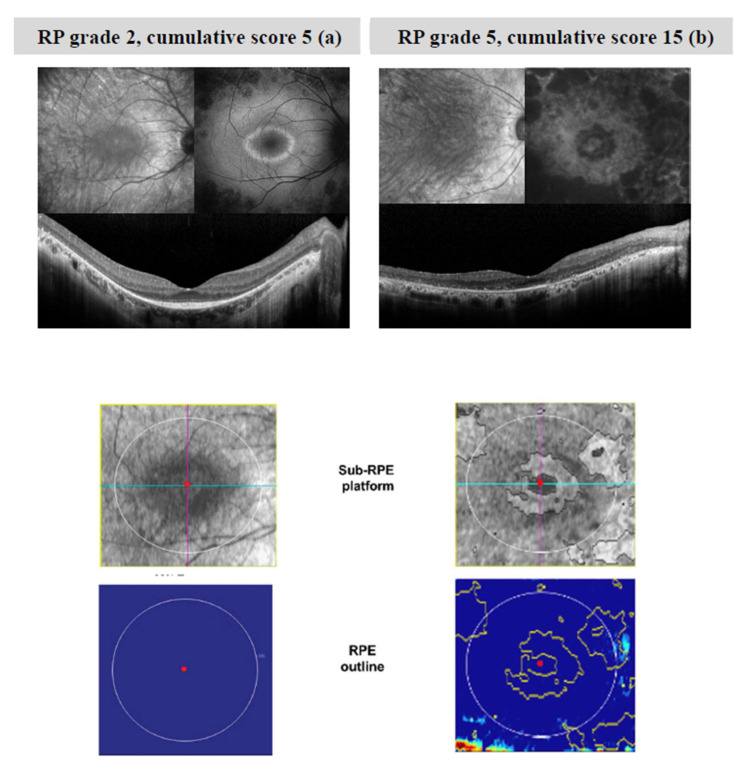
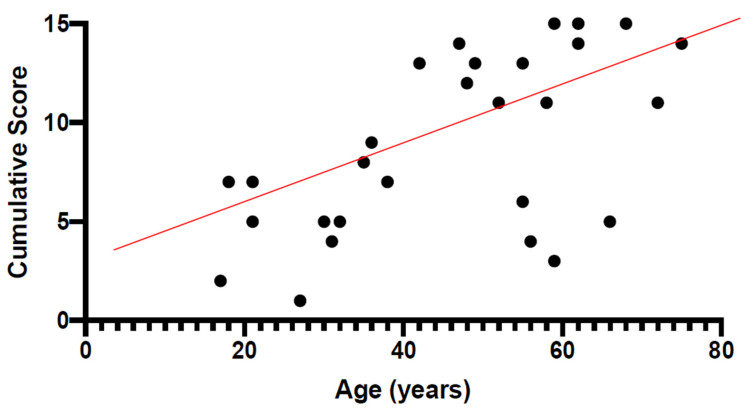
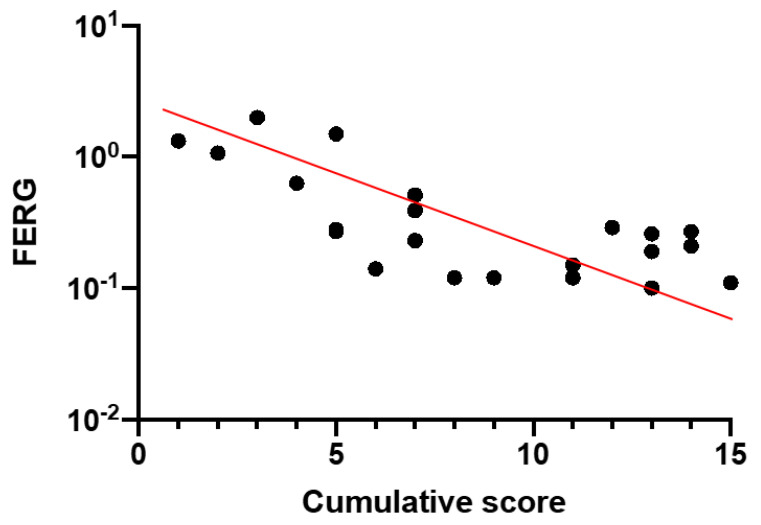
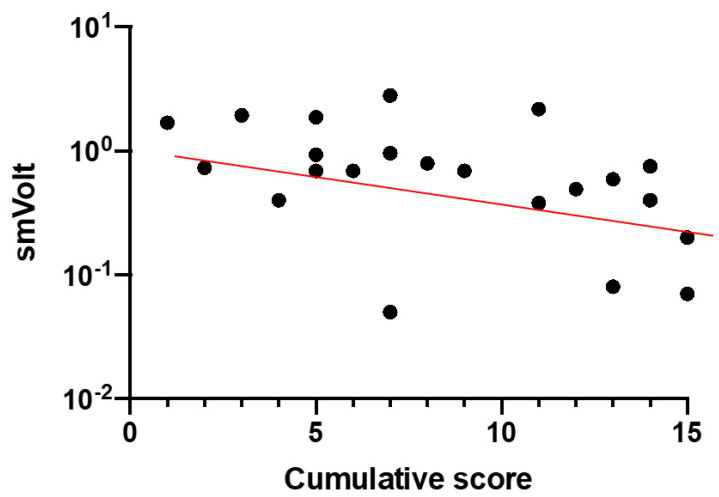
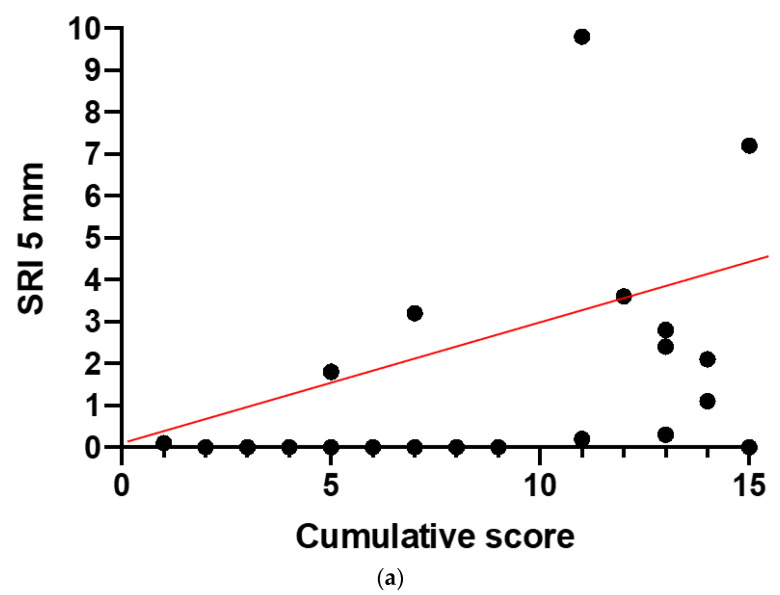
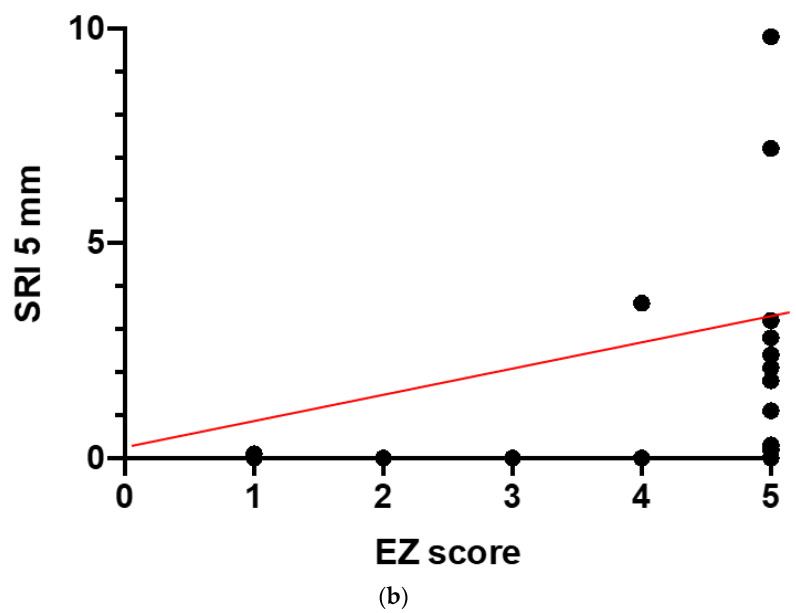
Usher syndrome type 2A (USH2A) is a genetic disease characterized by bilateral neuro-sensory hypoacusia and retinitis pigmentosa (RP). While several methods, including electroretinogram (ERG), describe retinal function in USH2A patients, structural alterations can be assessed by optical coherence tomography (OCT). According to a recent collaborative study, RP can be staged considering visual acuity, visual field area and ellipsoid zone (EZ) width. The aim of this study was to retrospectively determine RP stage in a cohort of patients with USH2A gene variants and to correlate the results with age, as well as additional functional and morphological parameters. In 26 patients with established USH2A genotype, RP was staged according to recent international standards. The cumulative staging score was correlated with patients' age, amplitude of full-field and focal flicker ERGs, and the OCT-measured area of sub-Retinal Pigment Epithelium (RPE) illumination (SRI). RP cumulative score (CS) was positively correlated (r = 0.6) with age. CS was also negatively correlated (rho = -0.7) with log10 ERG amplitudes and positively correlated (r = 0.5) with SRI. In USH2A patients, RP severity score is correlated with age and additional morpho-functional parameters not included in the international staging system and can reliably predict their abnormality at different stages of disease.

Keywords: Usher 2A gene; Usher syndrome; electroretinogram; retinal pigment epithelium (RPE) and outer retina atrophy (RORA); retinitis pigmentosa; staging; sub-RPE illumination (SRI).


Conflict of interest statement

The authors declare no conflict of interest. The funders had no role in the design of the study; in the collection, analyses, or interpretation of data; in the writing of the manuscript, or in the decision to publish the results.

Figures

Figure 1
Figure 1
Images of infrared (IR), fundus autofluorescence (FAF), OCT B scan, sub-RPE platform and RPE outline of two patients with mild RP (a) and severe (b) RP. In mild RP (a), central preservation of the ellipsoid zone corresponds to the internal edges of the hyper-autofluorescent ring visible on FAF. In severe RP (b), the B scan image shows a profound loss of photoreceptor outer segments, with central loss of the RPE, corresponding to hypo-autofluorescent areas on FAF. This picture is associated with changes in the sub-RPE platform (areas of increased SRI) within the 5 mm circle outlined in white. The software provides an automated measure of the SRI area (the sum of areas outlined in yellow in the RPE outline). Patient (a) is 30 years old with a BCVA of 87 ETDRS letters (score 0 for BCVA), while patient (b) is 48 years old with a BCVA of 54 ETDRS letters (score 5 for BCVA). In patient (a), EZ extends for 9.21 degrees, whereas in patient (b), EZ is not recognizable on OCT scans. Thus, scores of 3 and 5 have been assigned to the EZ, respectively.
Figure 2
Figure 2
Cumulative score (CS) from the right eye of each USH2A patient plotted as a function of age. It can be noted that the score increases linearly with age, with a slope of 0.18/year. The r value is 0.65 (p < 0.01).
Figure 3
Figure 3
Focal Electroretinogram (FERG) Log 10 amplitudes plotted as a function of the CS (rho = −0.72, p < 0.0001).
Figure 4
Figure 4
Log10 1F cone flicker microvolt ERG amplitude as a function of CS (rho = −0.58; p = 0.004).
Figure 5
Figure 5
Results of correlation analysis between Sub-RPE Illumination (SRI) and CS (a) and Ellipsoid Zone (EZ) score (b). SRI showed a positive correlation with CS (p = 0.01) and the EZ score (p = 0.007).
Figure 5
Figure 5
Results of correlation analysis between Sub-RPE Illumination (SRI) and CS (a) and Ellipsoid Zone (EZ) score (b). SRI showed a positive correlation with CS (p = 0.01) and the EZ score (p = 0.007).

References

    1. Boughman J.A., Vernon M., Shaver K.A. Usher syndrome: Definition and estimate of prevalence from two high-risk populations. J. Chronic Dis. 1983;36:595–603. doi: 10.1016/0021-9681(83)90147-9. - DOI - PubMed
    1. Grøndahl J. Estimation of prognosis and prevalence of retinitis pigmentosa and Usher syndrome in Norway. Clin. Genet. 2008;31:255–264. doi: 10.1111/j.1399-0004.1987.tb02804.x. - DOI - PubMed
    1. Hope C.I., Bundey S., Proops D., Fielder A.R. Usher syndrome in the city of Birmingham–prevalence and clinical classification. Br. J. Ophthalmol. 1997;81:46–53. doi: 10.1136/bjo.81.1.46. - DOI - PMC - PubMed
    1. Rosenberg T., Haim M., Parving A., Hauch A.-M. The prevalence of Usher syndrome and other retinal dystrophy-hearing impairment associations. Clin. Genet. 1997;51:314–321. doi: 10.1111/j.1399-0004.1997.tb02480.x. - DOI - PubMed
    1. Spandau U.H., Rohrschneider K. Prevalence and geographical distribution of Usher syndrome in Germany. Graefes Arch. Clin. Exp. Ophthalmol. 2002;240:495–498. doi: 10.1007/s00417-002-0485-8. - DOI - PubMed

LinkOut - more resources