. 2021 Feb 1;22(3):1452.
doi: 10.3390/ijms22031452.

Phosphatidic Acid Stimulates Myoblast Proliferation through Interaction with LPA1 and LPA2 Receptors

Affiliations

Phosphatidic Acid Stimulates Myoblast Proliferation through Interaction with LPA1 and LPA2 Receptors

Ana Gomez-Larrauri et al. Int J Mol Sci. .

Abstract

Phosphatidic acid (PA) is a bioactive phospholipid capable of regulating key biological functions, including neutrophil respiratory burst, chemotaxis, or cell growth and differentiation. However, the mechanisms whereby PA exerts these actions are not completely understood. In this work, we show that PA stimulates myoblast proliferation, as determined by measuring the incorporation of [3H]thymidine into DNA and by staining the cells with crystal violet. PA induced the rapid phosphorylation of Akt and ERK1/2, and pretreatment of the cells with specific small interferin RNA (siRNA) to silence the genes encoding these kinases, or with selective pharmacologic inhibitors, blocked PA-stimulated myoblast proliferation. The mitogenic effects of PA were abolished by the preincubation of the myoblasts with pertussis toxin, a Gi protein inhibitor, suggesting the implication of Gi protein-coupled receptors in this action. Although some of the effects of PA have been associated with its possible conversion to lysoPA (LPA), treatment of the myoblasts with PA for up to 60 min did not produce any significant amount of LPA in these cells. Of interest, pharmacological blockade of the LPA receptors 1 and 2, or specific siRNA to silence the genes encoding these receptors, abolished PA-stimulated myoblast proliferation. Moreover, PA was able to compete with LPA for binding to LPA receptors, suggesting that PA can act as a ligand of LPA receptors. It can be concluded that PA stimulates myoblast proliferation through interaction with LPA1 and LPA2 receptors and the subsequent activation of the PI3K/Akt and MEK/ERK1-2 pathways, independently of LPA formation.

Keywords: lysophosphatidic acid; lysophosphatidic acid receptors; myoblast proliferation; phosphatidic acid.


Conflict of interest statement

The authors declare no conflict of interest.

Figures

Figure 1
Figure 1
Phosphatidic acid (PA) stimulates C2C12 myoblast proliferation. Approximately 40% confluent C2C12 myoblasts were serum-starved for 24 h in Dulbecco’s modified eagle’s medium (DMEM) supplemented with 0.1% bovine serum albumin (BSA). (A) Cells were treated for 16 h with PA at the indicated concentrations. [3H]Thymidine incorporation into DNA was measured as described in the Materials and Methods section. Data are expressed relative to the control (Ctrl) value without agonist and are the means ± SEM of 3 independent experiments performed in triplicate. (*** p < 0.001). (B) Cells were treated for 16 h with 15 μM PA or with exogenous phospholipase D (exPLD) (1 unit/mL). [3H]Thymidine incorporation into DNA was measured as indicated in the Materials and Methods section. Data are expressed relative to the control value (Ctrl) without agonist and are the means ± SEM of 4 independent experiments performed in triplicate. (** p < 0.01; *** p < 0.001). (C) Cells were treated for 24 h with PA at the indicated concentrations. Cell proliferation was determined by staining the myoblasts with crystal violet as described in the Materials and Methods section. Data are expressed relative to the control value without agonist and are the means ± SEM of 6 independent experiments performed in triplicate. (* p < 0.05; *** p < 0.001).
Figure 2
Figure 2
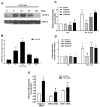
Involvement of the PI3-K/Akt pathway in PA-stimulated myoblast proliferation. Myoblasts were serum-starved for 24 h in DMEM supplemented with 0.1% BSA. (A) The cells were challenged with 15 μM PA at the indicated times. Cell lysates were analyzed by western blotting as described in the Materials and Methods section. Phosphorylation of Akt was determined with an antibody specific to phospho-Akt (Ser 473). Equal loading of protein was monitored using a specific antibody to total Akt. Panel A corresponds to a representative blot of three independent experiments. (B) Results of scanning densitometry of the exposed film showing the p-Akt/total Akt ratio. Data are expressed relative to the control value without agonist and are the mean ± SEM of 3 independent experiments performed in triplicate. (** p < 0.01; *** p < 0.001). (C) C2C12 myoblasts were preincubated for 30 min with 1 μM LY 294002 and then treated with 15 μM PA for 16 h. [3H]Thymidine incorporation was measured as described in the Materials and Methods section. Results are expressed relative to the control value without agonist and are the mean ± SEM of 3 independent experiments performed in triplicate. (** p < 0.01, control versus PA-treated cells, # p < 0.05; PA-treated cells versus PA-treated cells in the presence of the inhibitor). (D) Cells were treated as in panel C. Cell proliferation was determined by staining the myoblasts with crystal violet as described in the Materials and Methods section. Results are expressed relative to the control value without agonist and are the mean ± SEM of 3 independent experiments performed in triplicate. (* p < 0.05, control versus PA-treated cells, # p < 0.05; PA-treated cells versus PA-treated cells in the presence of the inhibitor). (E) C2C12 cells were preincubated for 30 min with 1 μM 10-DEBC and then treated with 15 μM PA for 16 h. [3H]Thymidine incorporation was measured as described in the Materials and Methods section. Results are expressed relative to the control value without agonist and are the mean ± SEM of 3 independent experiments performed in triplicates. (** p < 0.01, control versus PA-treated cells, # p < 0.05; PA-treated cells versus PA-treated cells in the presence of the inhibitor). (F) Cells were treated as in E. Cell proliferation was determined by staining the myoblasts with crystal violet as described in the Materials and Methods section. Results are expressed relative to the control value without agonist and are the mean ± SEM of 3 independent experiments performed in triplicate. (* p < 0.05, control versus PA-treated cells, # p < 0.05; PA-treated cells versus PA-treated cells in the presence of the inhibitor). (G) C2C12 cells were preincubated for 5 h with negative (scrambled) siRNA, or with specific PI3K, Akt1, Akt2, or Akt3 siRNA (40 nM in all cases), prior to stimulation with 15 μM PA, as indicated. [3H]Thymidine incorporation was measured as described in the Materials and Methods section. Results are expressed relative to the control value without agonist and are the mean ± SEM of 3 independent experiments performed in triplicate. (* p < 0.05 control versus PA-treated cells, # p < 0.05; PA-treated cells versus PA-treated cells in the presence of the corresponding siRNA).
Figure 3
Figure 3
Involvement of MEK/ERK 1/2, but not p38 or JNK in PA-stimulated myoblast proliferation. Myoblasts were serum starved and maintained in DMEM supplemented with 0.1% BSA for 24 h before addition of agonists. (A) The cells were challenged with 15 μM PA at the indicated time points. Cell lysates were analyzed by western blotting as described in the Materials and Methods section. Phosphorylation of ERK1/2 was determined with an antibody specific to phospho-ERK1/2. Equal loading of protein was monitored using a specific antibody to total ERK1/2. Panel A shows a representative blot of three independent experiments. (B) Results of scanning densitometry of the exposed film showing the p-ERK/total ERK ratio. Data are expressed relative to the control value without agonist and are the mean ± SEM of 3 independent experiments performed in triplicate. (*** p < 0.001). (C) C2C12 cells were preincubated for 30 min with 10 μM PD98059 to inhibit MEK, 5 μM SB239063 to inhibit p38 or 1 μM SP600125 to inhibit JNK, and were then treated with 15 μM PA, or vehicle for 16 h. [3H]Thymidine incorporation was measured as described in the Materials and Methods section. Results are expressed relative to the control value without agonist and are the mean ± SEM of 3 independent experiments performed in triplicate. (* p < 0.05, control versus PA-treated cells, # p < 0.05; PA-treated cells versus PA-treated cells in the presence of the inhibitor). (D) Cells were treated as in panel C. Cell proliferation was determined by staining the myoblasts with crystal violet as described in the Materials and Methods section. Results are expressed relative to the control value without agonist and are the mean ± SEM of 3 independent experiments performed in triplicate. (* p < 0.05, control versus PA-treated cells, # p < 0.05; PA-treated cells versus PA-treated cells in the presence of the inhibitor); ** p < 0.01, control versus PA-treated cells in the presence of SP600126; p < 0.05, control versus PA-treated cells in the presence of SB202190. (E) C2C12 cells were pre-treated for 5 h with negative (scrambled) siRNA, or with specific ERK1 or ERK2 siRNA (40 nM in all cases), prior to stimulation with 15 μM PA, as indicated. [3H]Thymidine incorporation was measured as described in the Materials and Methods section. Results are expressed relative to the control value without agonist and are the mean ± SEM of 3 independent experiments performed in triplicate. (* p < 0.05, control versus PA-treated cells, # p < 0.05; PA-treated cells versus PA-treated cells in the presence of the corresponding siRNA).
Figure 4
Figure 4
Pertussis toxin inhibits PA-stimulated myoblast proliferation and Akt and ERK1/2 phosphorylation. Myoblasts were serum-starved in DMEM supplemented with 0.1% BSA for 24 h. (A) Cells were preincubated for 16 h with 0.5 μg/mL pertussis toxin (Ptx) and then further treated with 15 μM PA or vehicle for 16 h, as indicated. [3H]Thymidine incorporation was measured as described in the Materials and Methods section. Results are expressed relative to the control value without agonist and are the mean ± SEM of 3 independent experiments performed in triplicate. (** p < 0.01, control versus PA-treated cells, ## p < 0.01; PA-treated cells versus PA-treated cells in the presence of Ptx). (B) Cells were treated as in panel A. Cell proliferation was determined by staining the myoblasts with crystal violet as described in the Materials and Methods section. Results are expressed relative to the control value without agonist and are the mean ± SEM of 3 independent experiments performed in triplicate. (* p < 0.05, control versus PA-treated cells, # p < 0.05; PA-treated cells versus PA-treated cells in the presence of Ptx). (C) C2C12 cells were preincubated for 16 h with 0.5 μg/mL Ptx. The myoblasts were then challenged with 15 μM PA or vehicle for 5 min, as indicated. Cell lysates were analyzed by western blotting as described in the Materials and Methods section. Phosphorylation of Akt (Ser473) and ERK were determined using specific antibodies to phospho-Akt (P-Akt), or phospho-ERK1/2 (P-ERK1/2). Equal loading of protein was monitored using specific antibodies to total Akt and ERK1/2. Panel C shows a representative blot of three independent experiments. (D,E) Results of scanning densitometry of the exposed films. Data are expressed as arbitrary units of intensity relative to the control values in the absence of agonist or Ptx (Ctrl) and are the mean ± SEM of 3 replicate experiments. (* p < 0.05; ** p < 0.01; control versus PA-treated cells, # p < 0.05, ## p < 0.01; PA-treated cells versus PA-treated cells in the presence of Ptx, as indicated).
Figure 5
Figure 5
Inhibition of PA-stimulated myoblast proliferation and Akt and ERK1/2 phosphorylation by the lysoPA (LPA) receptor antagonist VPC32183. Myoblasts were serum-starved in DMEM supplemented with 0.1% BSA for 24 h. (A) The cells were preincubated for 30 min with 5 μM VPC32183 and were then challenged with 15 μM PA or 15 μM LPA for 16 h, as indicated. [3H]Thymidine incorporation was measured as described in the Materials and Methods section. Results are expressed relative to the control value without agonist and are the mean ± SEM of 3 independent experiments performed in triplicate. (* p < 0.05, control versus PA or LPA-treated cells, # p < 0.05; PA or LPA-treated cells versus PA or LPA-treated cells in the presence of VPC32183). (B) Cells were treated as in panel A. Cell proliferation was determined by staining the myoblasts with crystal violet as described in the Materials and Methods section. Results are expressed relative to the control value without agonist and are the mean ± SEM of 3 independent experiments performed. Control versus PA-treated cells; ** p < 0.01, control versus LPA-treated cells; # p < 0.05; PA- or LPA-treated cells versus PA- or LPA-treated cells in the presence of VPC32183). (C) Cells were preincubated with 5 μM VPC32183 for 30 min and then treated with 15 μM PA for 5 min. Cell lysates were analyzed by western blotting as described in the Materials and Methods section. Phosphorylation of Akt and ERK1/2 was determined using specific antibodies against phospho-Akt (P-Akt) or phospho-ERK1/2 (P-ERK1/2). Equal loading of protein was monitored using specific antibodies to total Akt and total ERK1/2. Panel C shows a representative blot of three independent experiments. (D,E) Results of scanning densitometry of the exposed films. Data are expressed as arbitrary units of intensity relative to the control siRNA values in the absence of agonist or inhibitor (Ctrl) and are the mean ± SEM of 3 replicate experiments. (* p < 0.05; ** p < 0.01; control versus PA-treated cells, # p < 0.05, ### p < 0.001; PA-treated cells versus PA-treated cells in the presence of VPC32183, as indicated).
Figure 6
Figure 6
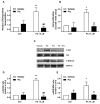
Implication of LPA1 and LPA2 receptors in PA-induced DNA synthesis and Akt and ERK phosphorylation. Myoblasts were preincubated for 5 h with negative (scrambled) siRNA (Neg siRNA) or with specific LPA1 or LPA2 siRNA (40 nM in all cases), as indicated. Transfected cells were maintained in DMEM with 10% fetal bovine serum (FBS) for 48 h and were then serum-starved in DMEM supplemented with 0.1% BSA for 24 h. (A) Cells were treated with 15 μM PA or vehicle for 16 h, as indicated. [3H]Thymidine incorporation was measured as described in the Materials and Methods section. Results are expressed relative to the control value without agonist and are the mean ± SEM of 3 independent experiments performed in triplicate. (* p < 0.05, control versus PA-treated cells, # p < 0.05; PA-treated cells versus PA-treated cells in the presence of siRNA). (B) Cells were treated as above and then stimulated for 5 min with 15 μM PA or vehicle as indicated. Cell lysates were analyzed by western blotting as described in the Materials and Methods section. Phosphorylation of Akt and ERK1/2 was determined using specific antibodies to phospho-Akt (P-Akt) or phospho-ERK1/2 (P-ERK1/2). Equal loading of protein was monitored using specific antibodies to total Akt or ERK1/2. Panel B shows a representative blot of three independent experiments. (C,D) Results of scanning densitometry of the exposed films. Data are expressed as arbitrary units of intensity relative to the control siRNA values in the absence of agonist (Ctrl) and are the mean ± SEM of 3 replicate experiments. (* p < 0.05; ** p < 0.01; control versus PA-treated cells, # p < 0.05, ## p < 0.01, ### p < 0.001; PA-treated cells versus PA-treated cells in the presence of the corresponding siRNA, as indicated).
Figure 7
Figure 7
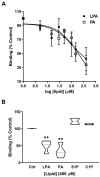
PA competes with LPA for binding to LPA receptors. (A) Myoblast membranes were incubated with 10 µM [3H]LPA in the presence of the indicated concentrations of unlabeled PA or LPA, as indicated. Non-specific binding was measured in the absence cell of membranes. Results are the mean ± SEM of three independent experiments performed in triplicate. Radioactivity of filter-bound radionuclide was quantified by liquid scintillation counting, as indicated in the Materials and Methods section. (B) The competition binding assays were performed with 10 µM [3H]LPA in the presence of 400 µM PA, 400 µM LPA, 400 µM S1P or 400 µM C1P, as indicated. Non-specific binding was measured in the absence of myoblast membranes. Results are the mean ± SEM of three independent experiments performed in triplicate. (** p < 0.01). Radioactivity of filter-bound radionuclide was quantified by liquid scintillation counting.
Figure 8
Figure 8
PA-stimulated myoblast proliferation does not depend on conversion of PA to LPA. Myoblasts were serum-starved in DMEM supplemented with 0.1% BSA for 24 h. (A) The cells were preincubated with 20 µM PACOCF3, 20 µM AACOCF3 or with 1 µM of the cPLA2 α inhibitor pyrrophenone (N-{(2S,4R)-4-(Biphenyl-2-ylmethyl-isobutyl-amino)-1-[2-(2,4-difluorobenzoyl)-benzoyl]-pyrrolidin-2-ylmethyl}-3-[4-(2,4-dioxothiazolidin-5-ylidenemethyl)-phenyl] acrylamide) for 30 min before they were challenged with 15 μM PA for 16 h. [3H]Thymidine incorporation into DNA was measured as described in the Materials and Methods section. Results are expressed relative to the control value without agonist and are the mean ± SEM of 3 independent experiments performed in triplicate (** p < 0.01, control versus PA-treated cells; * p < 0.05, control versus PA-treated cells in the presence of the indicated inhibitors. (B) Cells were treated as in panel A. Cell proliferation was determined by staining the myoblasts with crystal violet as described in the Materials and Methods section. Results are expressed relative to the control value without agonist and are the mean ± SEM of 3 independent experiments performed in triplicate. (* p < 0.05, control versus PA-treated cells in the absence or in the presence of the indicated inhibitors). (C) Cells were labelled with 15 μM [14C]PA (0.05 μCi/mL) for the indicated time points. PA and LPA levels were determined as described in the Materials and Methods section. Results are expressed as percentage of the radioactivity present in the PA and LPA thin-layer chromatography (TLC) spots compared to that in total lipids and are the mean ± SEM of 3 independent experiments performed in duplicate. (D) The cells were preincubated with 300 nM HA-130 or 300 nM PF-8380 for 30 min before they were treated with 15 μM PA for 16 h. Cell proliferation was determined by staining the myoblasts with crystal violet as described in the Materials and Methods section. Results are expressed relative to the control value without agonist and are the mean ± SEM of 3 independent experiments performed in triplicate. (** p < 0.01, control versus PA-treated cells; * p < 0.05, control versus PA-treated cells in the presence of HA-130, or PF-8380 treated cells versus PA-treated cells in the presence of this inhibitor; # p < 0.05, control versus cells incubated with PF-8380). (E) Cells were treated with PA or LPA for 16 h at the indicated concentrations. [3H]Thymidine incorporation into DNA was measured as described in the Materials and Methods section. Data are expressed relative to the control value without agonist and are the means ± SEM of 3 independent experiments performed in triplicate (*** p < 0.001, control versus PA- or LPA-treated cells). (F) Cells treated with PA from egg yolk or with different PA species (at 15 µM), as indicated. Results are expressed relative to the control value without agonist and are the mean ± SEM of 6 independent experiments performed in triplicate. (** p < 0.01, control versus PA from egg yolk; * p < 0.05, control versus 16:0-PA or 16:0-18:1-PA, as indicated).

Similar articles

Cited by

References

    1. Brindley D.N. Intracellular translocation of phosphatidate phosphohydrolase and its possible role in the control of glycerolipid synthesis. Prog. Lipid Res. 1984;23:115–133. doi: 10.1016/0163-7827(84)90001-8. - DOI - PubMed
    1. Vance J.E., Vance D.E. Phospholipid biosynthesis in mammalian cells. Biochem. Cell Biol. 2004;82:113–128. doi: 10.1139/o03-073. - DOI - PubMed
    1. Wang X., Devaiah S.P., Zhang W., Welti R. Signaling functions of phosphatidic acid. Prog. Lipid Res. 2006;45:250–278. doi: 10.1016/j.plipres.2006.01.005. - DOI - PubMed
    1. Bargmann B.O., Munnik T. The role of phospholipase D in plant stress responses. Curr. Opin. Plant Biol. 2006;9:515–522. doi: 10.1016/j.pbi.2006.07.011. - DOI - PubMed
    1. Cazzolli R., Shemon A.N., Fang M.Q., Hughes W.E. Phospholipid signalling through phospholipase D and phosphatidic acid. IUBMB Life. 2006;58:457–461. doi: 10.1080/15216540600871142. - DOI - PubMed

LinkOut - more resources