. 2021 Feb 3;11(1):29.
doi: 10.1186/s13578-021-00536-1.

Neuregulin 1/ErbB4 signaling contributes to the anti-epileptic effects of the ketogenic diet

Affiliations

Neuregulin 1/ErbB4 signaling contributes to the anti-epileptic effects of the ketogenic diet

Jin Wang et al. Cell Biosci. .

Abstract

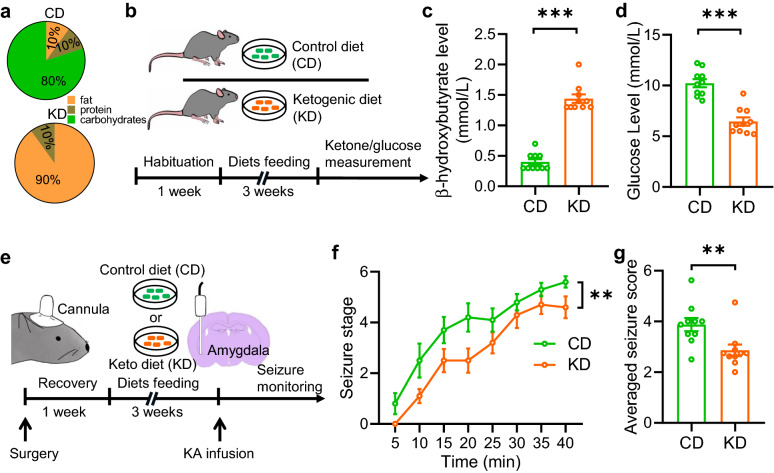
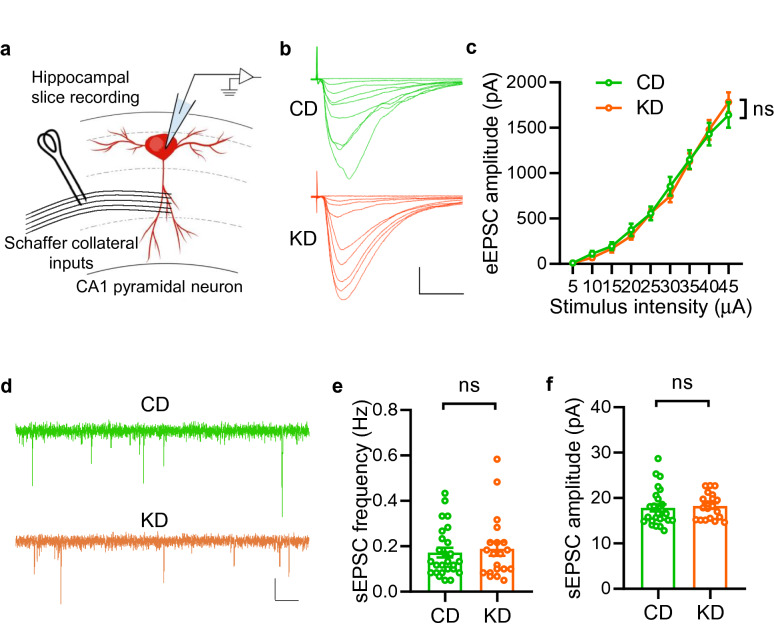
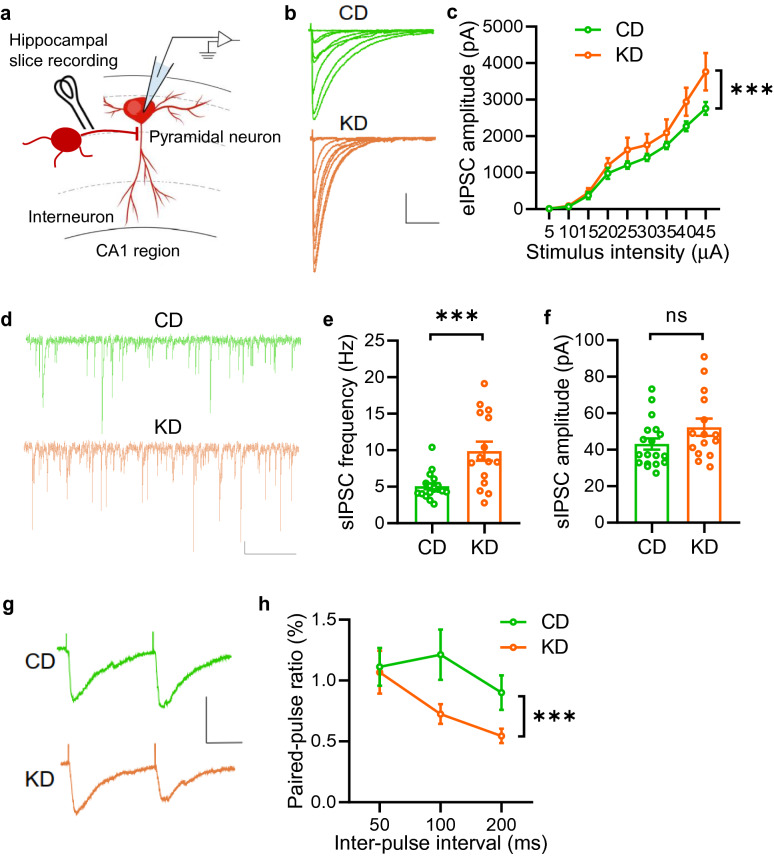
Background: The ketogenic diet (KD) has been recognized as a potentially effective therapy to treat neuropsychiatric diseases, including epilepsy. Previous studies have indicated that KD treatment elevates γ-Amino butyric acid (GABA) levels in both human and murine brains, which presumably contributes to the KD's anti-seizure effects. However, this has not been systematically investigated at the synaptic level, and the underlying molecular mechanisms remain to be elucidated.

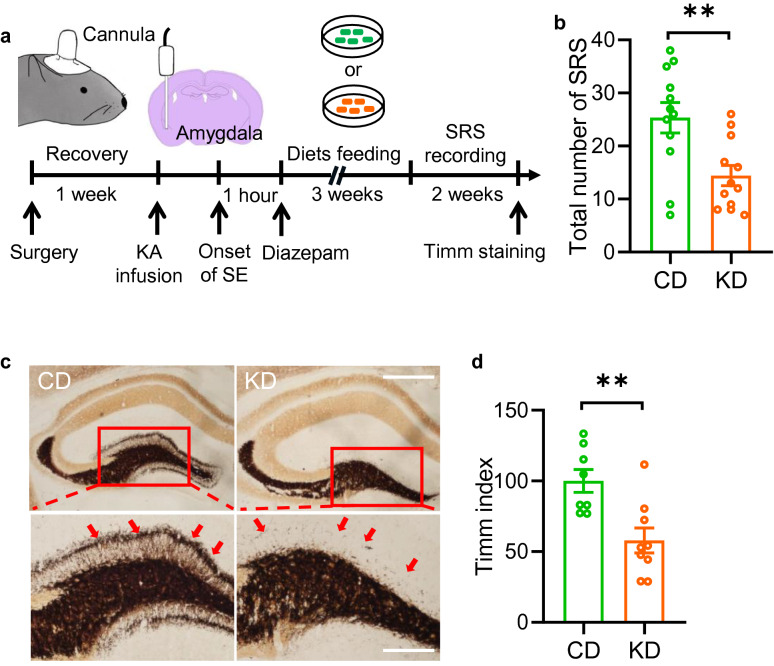
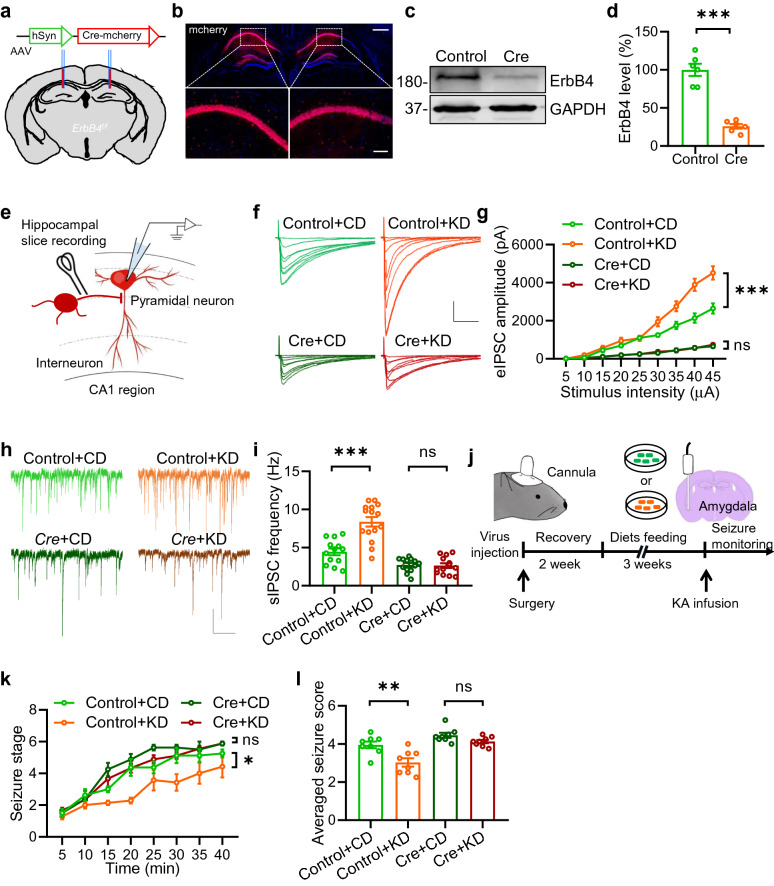
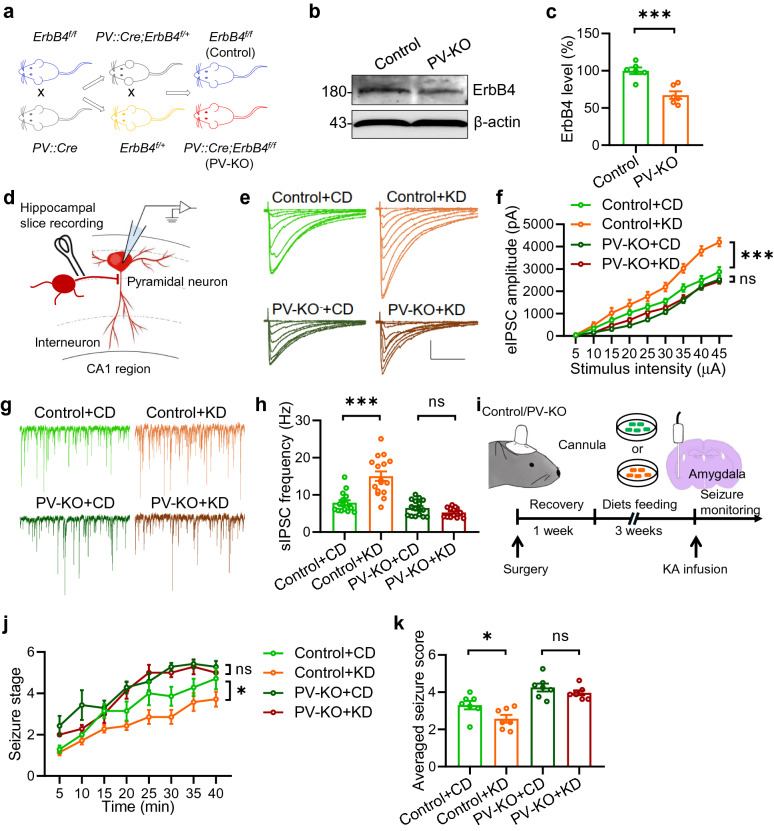
Methods: Kainic acid (KA)-induced acute and chronic seizure models were utilized to examine the effects of KD treatment on seizure threshold and epileptogenesis. Synaptic activities in the hippocampus were recorded with the technique of electrophysiology. The effects of the KD on Neuregulin 1 (Nrg1) expression were assessed via RNA sequencing, real-time PCR and Western blotting. The obligatory role of Nrg1 in KD's effects on seizures was evaluated through disruption of Nrg1 signaling in mice by genetically deleting its receptor-ErbB4.

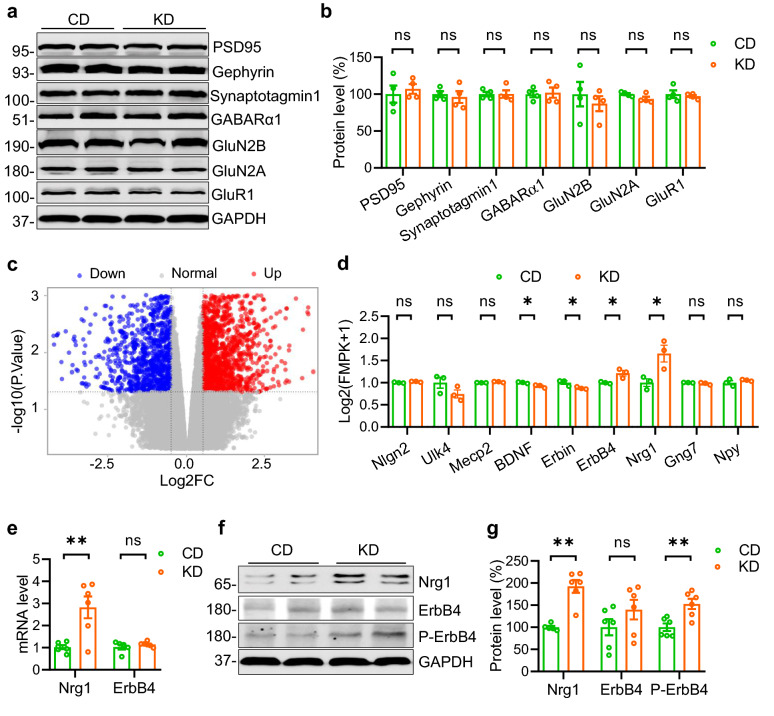
Results: We found that KD treatment suppressed seizures in both acute and chronic seizure models and enhanced presynaptic GABA release probability in the hippocampus. By screening molecular targets linked to GABAergic activity with transcriptome analysis, we identified that KD treatment dramatically increased the Nrg1 gene expression in the hippocampus. Disruption of Nrg1 signaling by genetically deleting its receptor-ErbB4 abolished KD's effects on GABAergic activity and seizures.

Conclusion: Our findings suggest a critical role of Nrg1/ErbB4 signaling in mediating KD's effects on GABAergic activity and seizures, shedding light on developing new therapeutic interventions to seizure control.

Keywords: Epilepsy; ErbB4; GABAergic activity; Ketogenic diet; Neuregulin 1.


Conflict of interest statement

The authors have declared that no competing interest exists.

Figures

Fig. 1
Fig. 1
Ketogenic diet (KD) treatment elevates threshold to seizure in KA-induced seizure model. a Diagrams of diet contents. b Experimental design. After 1 week of habituation, male adult mice were divided into two groups, fed with control diet (CD) or KD for 3 weeks. Ketone and glucose measurements were then performed. c Increased circulating levels of β-hydroxybutyrate after 3 weeks of KD treatment. n = 10 mice per group. Student’s t test, t(18) = 12.49, P < 0.0001. d Decreased circulating levels of glucose after 3 weeks of KD treatment. n = 10 mice per group. Student’s t test, t(18) = 6.604, P < 0.0001. e Experimental design of seizure induction with kainic acid (KA). One week after cannula implantation into the amygdala, mice were fed with CD or KD. At the end of 3-weeks, mice were infused with kainic acid (KA) through cannula and seizure behaviors were monitored. f KD treatment decelerated the development of seizures. Mice in two groups were subject to KA infusion and scored for seizure stage every 5 min. n = 10 mice for each group. Repeated two-way ANOVA, F(1,126) = 8.522, P = 0.0092. g The averaged seizure score was decreased in mice fed with KD. n = 10 mice for each group. Student’s t test, t(18) = 2.919, p = 0.0092
Fig. 2
Fig. 2
KD treatment suppresses epileptogenesis in KA-induced chronic seizure model. a Experimental design for spontaneous recurrent seizure (SRS) recording. SE was induced by the infusion of KA in the amygdala. One hour later, Seizure activity was terminated by injection of diazepam (i.p). Mice were then fed with CD or KD for 3 weeks, followed by 2 weeks of SRS recording. b reduced SRS number in mice fed with KD. n = 12 mice per group. Student’s t test, t(22) = 3.186, P = 0.0043. c Representative Timm staining images of brain sections from mice fed with CD or KD Magnified images of areas in dotted squares were shown on the bottom. Arrows, Timm granules in the supragranular region. Scale bar, 500 µm (top) and 200 µm (bottom). d Statistical analysis of the Timm index. n = 8 slices from 3 CD-fed mice; n = 9 slices from 3 KD-fed mice. Student’s t test, t(15) = 3.473, P = 0.0034
Fig. 3
Fig. 3
KD treatment exhibits little effect on excitatory synaptic transmission in the hippocampus. a Diagram of hippocampal slice recording. Pyramidal neurons in the CA1 region were clamped in whole-cell configuration. Evoked excitatory postsynaptic currents (eEPSCs) were recorded under the stimulation of Schaffer collateral inputs by using a concentric bipolar electrode. b Representative eEPSC traces. Scale bars, 20 ms and 500 pA. c Comparable amplitudes of eEPSCs in the CA1 region of hippocampus between CD and KD group. n = 28 neurons from 4 mice fed CD; n = 24 neurons from 4 mice fed KD. Two-way ANOVA, F(1,450) = 0.05, P = 0.8231. d Representative sEPSC traces. Scale bars, 2 s and 10 pA. e, f Unaltered sEPSC frequency and amplitude between two groups. n = 26 neurons from 4 mice fed with CD; n = 20 neurons from 4 KD-fed mice. Student’s t test, for frequency, t(44) = 0.4743, P = 0.6376;, for amplitude, t(44) = 0.3979, P = 0.6926
Fig. 4
Fig. 4
KD treatment increases inhibitory synaptic activity in the hippocampus. a Diagram of hippocampal slice recording. Pyramidal neurons in the CA1 region were clamped in whole-cell configuration. Evoked postsynaptic currents were recorded under stimulation by using a concentric bipolar electrode. b Representative eIPSC traces. Scale bars, 100 ms and 1000 pA. c Increased amplitude of evoked inhibitory postsynaptic currents (eIPSCs) in the CA1 region of hippocampus in KD-fed mice. n = 17 neurons from 4 CD-fed mice; n = 15 neurons from 4 KD-fed mice. Two-way ANOVA, main effect, F(1,267) = 11.9, P = 0.0007. d Representative spontaneous inhibitory postsynaptic current (sIPSC) traces. Scale bars, 2 s and 20 pA. e, f Increased sIPSC frequency but not amplitude in KD-fed mice. n = 18 neurons from 4 CD-fed mice; n = 15 neurons from 4 KD-fed mice. Student’s t test, for frequency, t(31) = 3.782, P = 0.0007; for amplitude, t(31) = 1.678, P = 0.1034. g Representative sweeps with inter-stimulus interval of pair-pulse stimulations at 100 ms. Scale bars, 50 ms and 100 pA. h Decreased PPRs in KD-fed mice. n = 17 neurons from 4 CD-fed mice; n = 15 neurons from 4 KD-fed mice. Two-way ANOVA, F(1,90) = 5.871, P = 0.0174
Fig. 5
Fig. 5
KD treatment elevates Nrg1 expression in the hippocampus. a Western blots detecting synaptic proteins in the hippocampus of mice fed with CD or KD, GAPDH serves as the loading control. Shown are representative blots. b Quantitative analysis of data in (a). n = 4 mice per group. Student’s t test, for PSD95, t(6) = 0.5382, P = 0.6098; for Gephrin, t(6) = 0.4457, P = 0.6714; for Synaptotagmin-1, t(6) = 0.03585, P = 0.9726; for GABARa1, t(6) = 0.2533, P = 0.8085; for GluN2B, t(6) = 0.655, P = 0.5367; for GluN2A, t(6) = 0.1.909, P = 0.1048; for GluR1, t(6) = 0.4986, P = 0.6358. c A volcano plot of genes altered by KD treatment in the hippocampus. Genes up-regulated with more than 1.5 fold change with a p-value < 0.05 are depicted in red dots, and those down-regulated with identical fold change and p-value are in green dots. d Quantification of several genes that were reported critical for GABAergic signaling from RNAseq data. n = 3 mice per group. Student’s t test, for Nlgn2 (Neuroligin 2), t(4) = 2.259, P = 0.0868; for Ulk4 2, t(4) = 1.653, P = 0.1737; for Mecp2, t(4) = 2.99, P = 0.083; for BDNF, t(4) = 3.378, P = 0.0278; for Erbin, t(4) = 2.917, P = 0.0434; for ErbB4, t(4) = 3.421, P = 0.0267; for Nrg1, t(4) = 3.221, P = 0.0322; for Gng7, t(4) = 1.324, P = 0.256; for Npy, t(4) = 1.162, P = 0.31. e The messenger RNA expression level of Nrg1 but not ErbB4 was dramatically increased in the hippocampus. Student’s t test, for Nrg1, n = 6 mice per group, t(10) = 3.608, P = 0.0048; for ErbB4, n = 5 mice for CD group, n = 6 mice for KD group, t(9) = 0.9955, P = 0.3455. f Increased expression of Nrg1 and phosphorylated ErbB4 (P-ErbB4) proteins in the hippocampus of mice fed with K.D. Shown were representative blots of two mice from each group. GAPDH served as a loading control. g Quantitative analysis of the Western blot data in (f). Student’s t test, for NRG1, n = 5 CD-fed mice, n = 6 KD-fed mice, t(9) = 5.735, P = 0.0003; for ErbB4, n = 6 mice per group, t(10) = 1.384, P = 0.1965; for P-ErbB4, t(10) = 3.668, P = 0.0043
Fig. 6
Fig. 6
Knockdown of ErbB4 from hippocampus diminishes the anti-seizure effects of KD. a Schematic of virus injection. hSyn promoter-driven Cre virus was injected bilaterally into hippocampal region. b Representative images of mcherry expression in virus-injected mice. Hippocampal sections were collected 3 weeks after stereotaxic microinjection of AAV-hSyn-cre-mcherry virus. Enlarged images of the dotted area were shown on the bottom. Scale bar: 500 µm (top) and 100 µm (bottom). c Reduced ErbB4 expression in hippocampus of ErbB4f/f mice injected with AAV-hSyn-Cre-mcherry virus. Shown were representative blots. ErbB4 band density was normalized with the loading control GAPDH. d Quantitative analysis of the Western blot data in (c). n = 6 mice per group. Student’s t test, t(10) = 8.679, P < 0.0001. e Diagram of hippocampal slice recording. Pyramidal neurons in the CA1 region were clamped in whole-cell configuration. Evoked postsynaptic currents were recorded under stimulation by using a concentric bipolar electrode. f Representative eIPSC traces. Scale bars, 100 ms and 1000 pA. g Knockdown of ErbB4 in the hippocampus attenuates the effect of KD on eIPSC amplitudes. n = 13 neurons from 3 mice of “Control + CD” group; n = 15 neurons from 3 mice of “Control + KD” group; n = 13 neurons from 3 mice of “Cre + CD” group; n = 13 neurons from 3 mice of “Cre + KD” group. Two-way ANOVA, “Control + CD” vs “Control + KD”: F(1,234) = 51.25, P < 0.0001; “Cre + CD” vs “Cre + KD”: F(1,216) = 0.1648, P = 0.6852. h Representative sIPSC traces. Scale bars, 2 s and 50 pA. i Knockdown of ErbB4 in the hippocampus reduces the effect of KD on sIPSC frequency. n = 13 neurons from 3 mice of “Control + CD” group; n = 15 neurons from 3 mice of “Control + KD” group; n = 13 neurons from 3 mice of “Cre + CD” group; n = 13 neurons from 3 mice of “Cre + KD” group. Student’s t test, “Control + CD” vs “Control + KD”: t(26) = 4.979, P < 0.0001; “Cre + CD vs “Cre + KD”: F(24) = 0.2191, P = 0.8284. j Diagram of experimental design. AAV virus was injected into hippocampus 2 weeks prior to KD feeding. Three weeks later, mice were subjected to electrophysiological recordings or KA infusion to induce seizures. k Knockdown of ErbB4 in hippocampus diminishes the effect of KD on the development of seizure. Mice were subject to KA infusion and scored for seizure stage every 5 min. n = 8 mice of “Control + CD” group; n = 9 mice of “Control + KD” group; n = 8 mice of “Cre + CD” group; n = 9 mice of “Cre + KD” group. Repeated two-way ANOVA, “Control + CD vs “Control + KD”: F(1,105) = 6.351, P = 0.0235; “Cre + CD vs “Cre + KD”: F(1,105) = 2.382, P = 0.1435. l The averaged seizure score is decreased by Knockdown of ErbB4 in the hippocampus. n = 8 mice of “Control + CD” group; n = 9 mice of “Control + KD” group; n = 8 mice of “Cre + CD” group; n = 9 mice of “Cre + KD” group. Student’s t test, “Control + CD” vs “Control + KD”: t(15) = 3.873, P = 0.0015; “Control + CD” vs “Cre + CD”: t(14) = 2.522, P = 0.0244; “Cre + CD” vs “Cre + KD”: t(15) = 1.733, P = 0.1035; “Control + KD” vs “Cre + KD”: t(16) = 4.771, P = 0.0002
Fig. 7
Fig. 7
ErbB4 deletion in PV+ interneurons is necessary for the anti-seizure effect of the KD. a Mice breeding paradigm. ErbB4f/f mice were crossed with PV::Cre mice; the resulting PV::Cre;ErbB4f/+ mice were crossed with ErbB4f/+ mice to generate PV::Cre;ErbB4 (PV-KO) and ErbB4f/f (control) mice. b Reduced ErbB4 expression in the hippocampus of PV-KO mice. Hippocampal lysates of 2-month-old mice were probed for ErbB4, and GAPDH was taken as a loading control. Shown were representative blots of each genotype. c Quantitative analysis of data in (b). n = 6 mice per group. Student’s t test, t(10) = 4.853, P = 0.0007. d Diagram of hippocampal slice recording. Pyramidal neurons in the CA1 region were clamped in whole-cell configuration. Evoked postsynaptic currents were recorded under stimulation by using a concentric bipolar electrode. e Representative eIPSC traces. Scale bars, 100 ms and 1000 pA. f Deletion of ErbB4 in PV+ interneurons diminished the effect of KD on eIPSC amplitudes. n = 16 neurons from 3 mice of “Control + CD” group; n = 16 neurons from 3 mice of “Control + KD” group; n = 16 neurons from 3 mice of “PV-KO + CD” group; n = 14 neurons from 3 mice of “PV-KO + KD” group. Two-way ANOVA, “Control + CD” vs “Control + KD”: F(1,269) = 57.97, P < 0.0001; “PV-KO + CD” vs “PV-KO + KD”: F(1,252) = 3.158, P = 0.0768. g Representative sIPSC traces. Scale bars, 2 s and 50 pA. h Deletion of ErbB4 in PV+ interneurons diminished the effect of KD on sIPSC frequency. n = 16 neurons from 3 mice of “Control + CD” group; n = 16 neurons from 3 mice of “Control + KD” group; n = 16 neurons from 3 mice of “PV-KO + CD” group; n = 14 neurons from 3 mice of “PV-KO + KD” group. Student’s t test, “Control + CD” vs “Control + KD”: t(30) = 4.985, P < 0.0001; “PV-KO + KD” vs “PV-KO + KD”: t(28) = 1.873, P = 0.0715. i Schematic of experimental design. Control and PV-KO mice that were feed with CD or KD for 3 weeks were subject to KA infusion to induce seizures. j The development of seizure with time following KA infusion. n = 7 mice for each group. Repeated two-way ANOVA, “Control + CD” vs “Control + KD”: F(1,12) = 5.685, P = 0.0345; “PV-KO + CD” vs “PV-KO + KD”: F(1,12) = 1.311, P = 0.2746. k ErbB4 deletion in PV+ interneurons diminished the effect of KD on the averaged seizure score. n = 7 mice for each group. Student’s t test, “Control + CD” vs “Control + KD”: t(12) = 2.384, P = 0.0345; “PV-KO + CD” vs “PV-KO + KD”: t(12) = 1.145, P = 0.2746

References

    1. Manford M. Recent advances in epilepsy. J Neurol. 2017;264(8):1811–1824. doi: 10.1007/s00415-017-8394-2. - DOI - PMC - PubMed
    1. Ulamek-Koziol M, Czuczwar SJ, Januszewski S, Pluta R. Ketogenic diet and epilepsy. Nutrients. 2019;11(10):2510. doi: 10.3390/nu11102510. - DOI - PMC - PubMed
    1. Freeman JM, Kossoff EH. Ketosis and the ketogenic diet, 2010: advances in treating epilepsy and other disorders. Adv Pediatr. 2010;57(1):315–329. doi: 10.1016/j.yapd.2010.08.003. - DOI - PubMed
    1. Youngson NA, Morris MJ, Ballard JWO. The mechanisms mediating the antiepileptic effects of the ketogenic diet, and potential opportunities for improvement with metabolism-altering drugs. Seizure. 2017;52:15–19. doi: 10.1016/j.seizure.2017.09.005. - DOI - PubMed
    1. Tremblay R, Lee S, Rudy B. GABAergic interneurons in the neocortex: from cellular properties to circuits. Neuron. 2016;91(2):260–292. doi: 10.1016/j.neuron.2016.06.033. - DOI - PMC - PubMed

LinkOut - more resources