. 2021 Feb 3;9(1):20.
doi: 10.1186/s40478-021-01118-5.

Molecular analysis of pediatric CNS-PNET revealed nosologic heterogeneity and potent diagnostic markers for CNS neuroblastoma with FOXR2-activation

Affiliations

Molecular analysis of pediatric CNS-PNET revealed nosologic heterogeneity and potent diagnostic markers for CNS neuroblastoma with FOXR2-activation

Andrey Korshunov et al. Acta Neuropathol Commun. .

Abstract

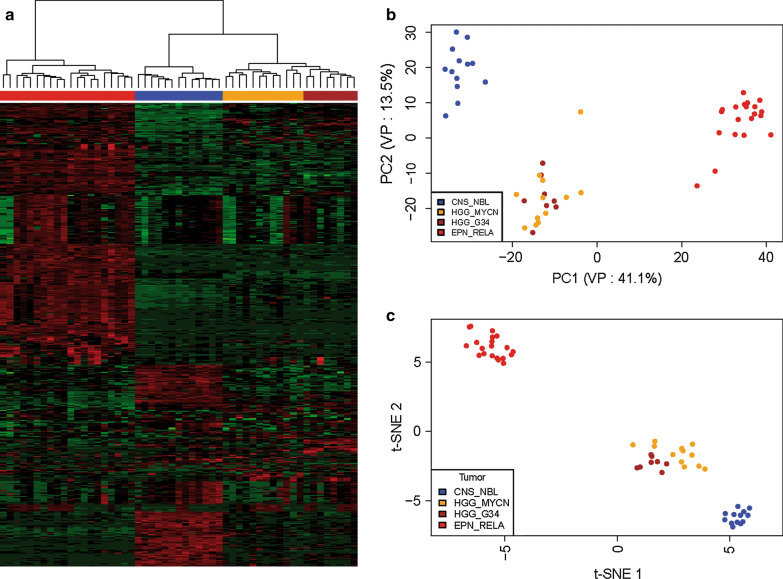
Primitive neuroectodermal tumors of the central nervous system (CNS-PNETs) are highly malignant neoplasms posing diagnostic challenge due to a lack of defining molecular markers. CNS neuroblastoma with forkhead box R2 (FOXR2) activation (CNS_NBL) emerged as a distinct pediatric brain tumor entity from a pool previously diagnosed as primitive neuroectodermal tumors of the central nervous system (CNS-PNETs). Current standard of identifying CNS_NBL relies on molecular analysis. We set out to establish immunohistochemical markers allowing safely distinguishing CNS_NBL from morphological mimics. To this aim we analyzed a series of 84 brain tumors institutionally diagnosed as CNS-PNET. As expected, epigenetic analysis revealed different methylation groups corresponding to the (1) CNS-NBL (24%), (2) glioblastoma IDH wild-type subclass H3.3 G34 (26%), (3) glioblastoma IDH wild-type subclass MYCN (21%) and (4) ependymoma with RELA_C11orf95 fusion (29%) entities. Transcriptome analysis of this series revealed a set of differentially expressed genes distinguishing CNS_NBL from its mimics. Based on RNA-sequencing data we established SOX10 and ANKRD55 expression as genes discriminating CNS_NBL from other tumors exhibiting CNS-PNET. Immunohistochemical detection of combined expression of SOX10 and ANKRD55 clearly identifies CNS_NBL discriminating them to other hemispheric CNS neoplasms harboring "PNET-like" microscopic appearance. Owing the rarity of CNS_NBL, a confirmation of the elaborated diagnostic IHC algorithm will be necessary in prospective patient series.

Keywords: CNS-PNET; FOXR2-activation; Neuroblastoma; SOX10.


Figures

Fig. 1
Fig. 1
a. Pathological similarity of CNS-PNET samples allocated to various molecular groups (The scale bars: 50 μm). b. Two-dimensional t-distributed stochastic neighbor embedding (tSNE) analysis of reference set composed of various tumor entities including CNS_NBL, GBM_G34, GBM_MYCN and EPN_RELA cohorts. c. tSNE analysis of 84 institutionally diagnosed cPNET (all black spots) revealed distribution their epigenetic profiles among the four reference tumor sets including CNS_NBL (n = 20), GBM_G34 (n = 22), GBM_MYCN (n = 18) and EPN_RELA (n = 24). d. Survival analysis for CNS-PNET cohort shows that both overall survival (OS) and progression-free survival (PFS) were significantly better for patients harboring tumors with CNS_NBL molecular signature (black lines), in comparison to GBM_G34 (red lines), GBM_MYCN (orange lines) and EPN_RELA (green lines)
Fig. 2
Fig. 2
Gene expression profiling data obtained after RNA sequencing of CNS-PNET cohort (n = 54). a. Heat-map of unsupervised hierarchical cluster analysis based on 500 differentially expressed genes disclosed that CNS_NBL (blue) were clustered separately from EPN_RELA (red); GBM_G34 (brown), and GBM_MYCN (orange) (Row Z-Scores: green: from 0 to − 6; red: from 0 to 6). Scales of principal component analysis (PCA); b. and two-dimensional t-distributed stochastic neighbor embedding (tSNE); c. analyses also revealed a separate distribution of CNS_NBL from other molecular groups
Fig. 3
Fig. 3
a. A set of 30 top most-confident genes differentially overexpressed in CNS_NBL (blue top line); GBM_G34 (brown top line), GBM_MYCN (orange top line), and EPN_RELA (red top line) respectively allows one to discriminate clearly between these tumor cohorts with SOX10 among the top genes for CNS_NBL (Row Z-Scores: green: from 0 to − 6; red: from 0 to 6). b. FOXR2 and SOX10 expression levels were significantly higher in CNS_NBL (blue boxplots) whereas MYCN was overexpressed in GBM_MYCN (orange boxplots) and RELA—EPN_RELA (red boxplots) respectively. c. Gene Ontology analysis disclosed that CNS_NBL transcriptome signatures (blue circles) were associated with neuronal metabolism, synaptic transmission, and neuroendocrine secretion
Fig. 4
Fig. 4
Patterns of SOX10 nuclear protein immunoexpression in various CNS tumors (The scale bars: 50 μm). Intense SOX10 expression was found in all CNS NBL, but also in some subtypes of high-grade gliomas. All embryonal CNS tumors were negative for SOX10, whereas glial neoplasms disclosed various degrees of nuclear immunostaining intensity
Fig. 5
Fig. 5
a. A set of 25 top most-confident genes differentially overexpressed in CNS_NBL (blue top line) and GBM_MID (pink top line) respectively allows one to discriminate clearly between these tumor cohorts with ANKRD55 on the top genes for CNS_NBL (Row Z-Scores: green: from 0 to − 6; red: from 0 to 6). b. ANKRD55 expression levels were significantly higher in CNS_NBL (blue boxplots) in comparison to other molecular groups. c. Intense ANKRD55 immunostaining was found in CNS_NBL but GBM_MID were negative (The scale bars: 50 μm)

References

    1. Bannykh SI, Stolt CC, Kim J, Perry A, Wegner M. Oligodendroglial-specific transcriptional factor SOX10 is ubiquitously expressed in human gliomas. J Neurooncol. 2006;76:115–127. doi: 10.1007/s11060-005-5533-x. - DOI - PubMed
    1. Bhimani AD, Ryoo JS, Reddy AK, Denyer S, McGuire LS, Alonso M, et al. Differentiation of outcomes by treatment regimen and histology in central nervous system primary embryonal tumors. World Neurosurg. 2020;141:e289–e306. doi: 10.1016/j.wneu. - DOI - PubMed
    1. Bianchi F, Tamburrini G, Gessi M, Frassanito P, Massimi L, Caldarelli M. Central nervous system (CNS) neuroblastoma. Childs Nerv Syst. 2018;34:817–823. doi: 10.1007/s00381-018-3764-3. - DOI - PubMed
    1. Bindea G, Mlecnik B, Hackl K, Charoentong P, Tosolini M, Kirilovsky A, et al. ClueGO: a Cytoscape plug-into decipher functionally grouped gene ontology and pathway annotation networks. Bioinformatics. 2009;25:1091–1093. doi: 10.1093/bioinformatics/btp101. - DOI - PMC - PubMed
    1. Capper D, Jones DTW, Sill M, Hovestadt V, Schrimpf D, Sturm D, et al. DNA methylation-based classification of central nervous system tumours. Nature. 2018;555:469–474. doi: 10.1038/nature26000. - DOI - PMC - PubMed

Publication types

MeSH terms