. 2021 Apr;20(4):665-675.
doi: 10.1158/1535-7163.MCT-20-0386. Epub 2021 Feb 3.

ONC201 Shows Potent Anticancer Activity Against Medullary Thyroid Cancer via Transcriptional Inhibition of RET, VEGFR2, and IGFBP2

Affiliations

ONC201 Shows Potent Anticancer Activity Against Medullary Thyroid Cancer via Transcriptional Inhibition of RET, VEGFR2, and IGFBP2

Rozita Bagheri-Yarmand et al. Mol Cancer Ther. 2021 Apr.

Abstract

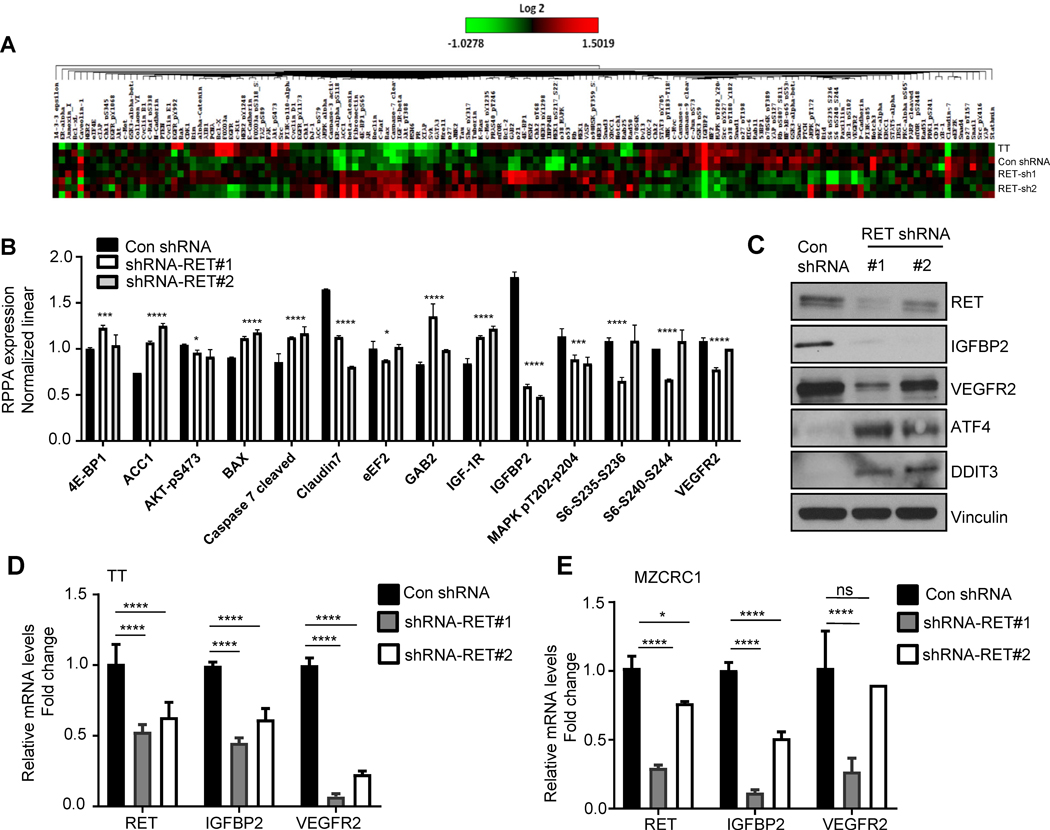
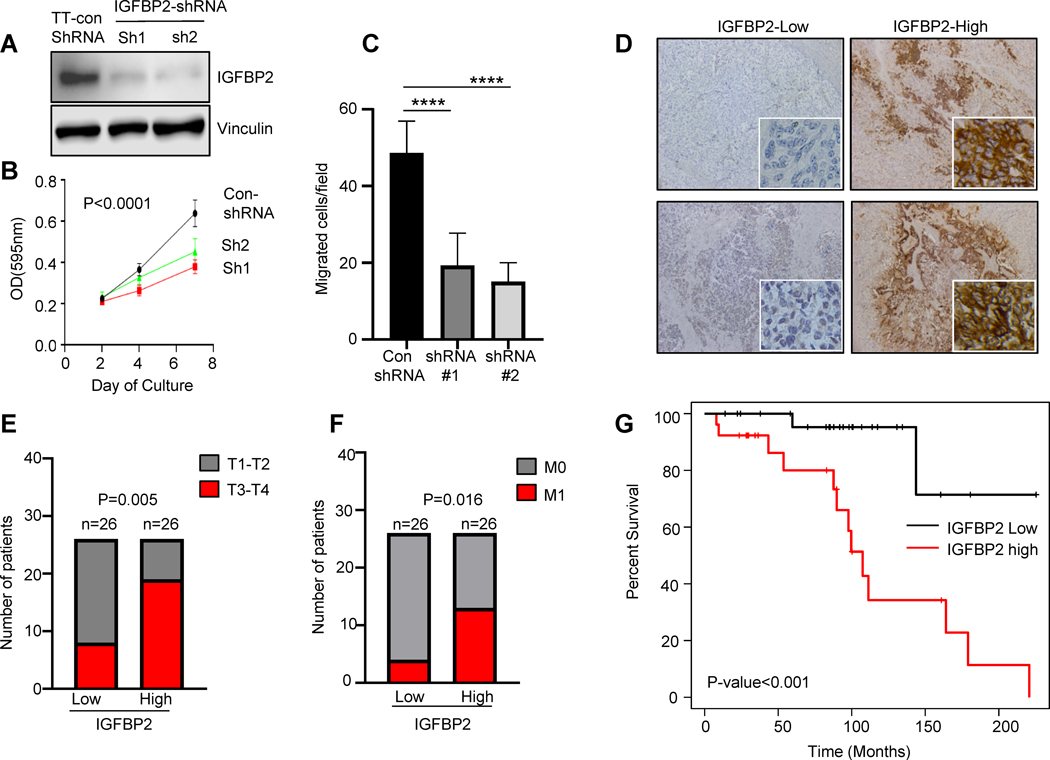
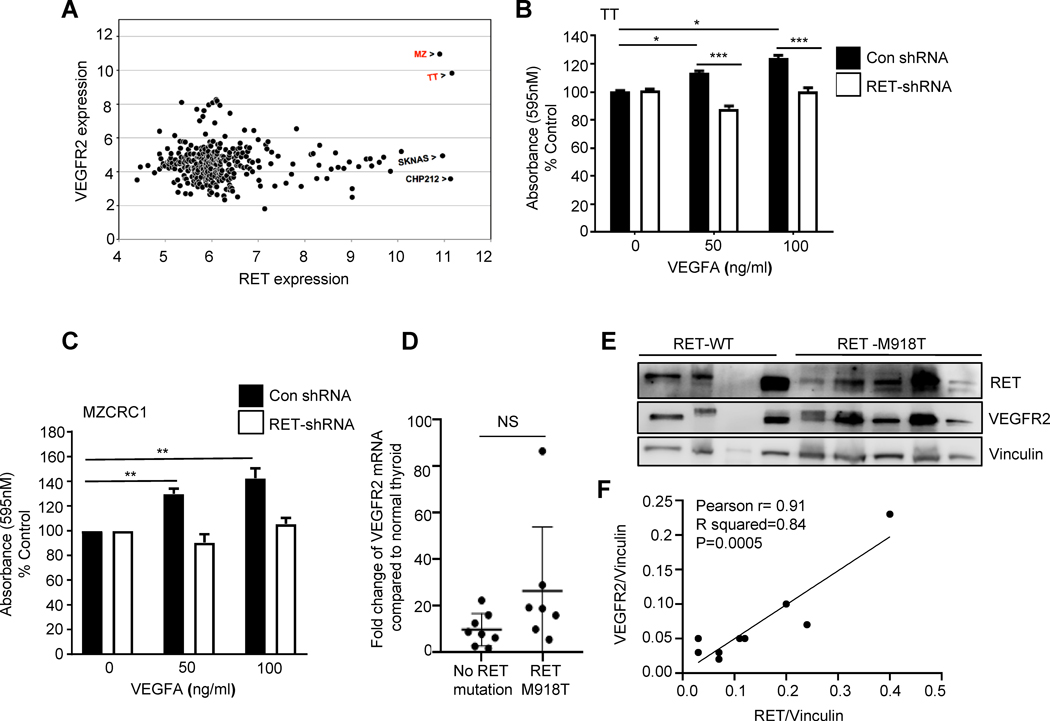
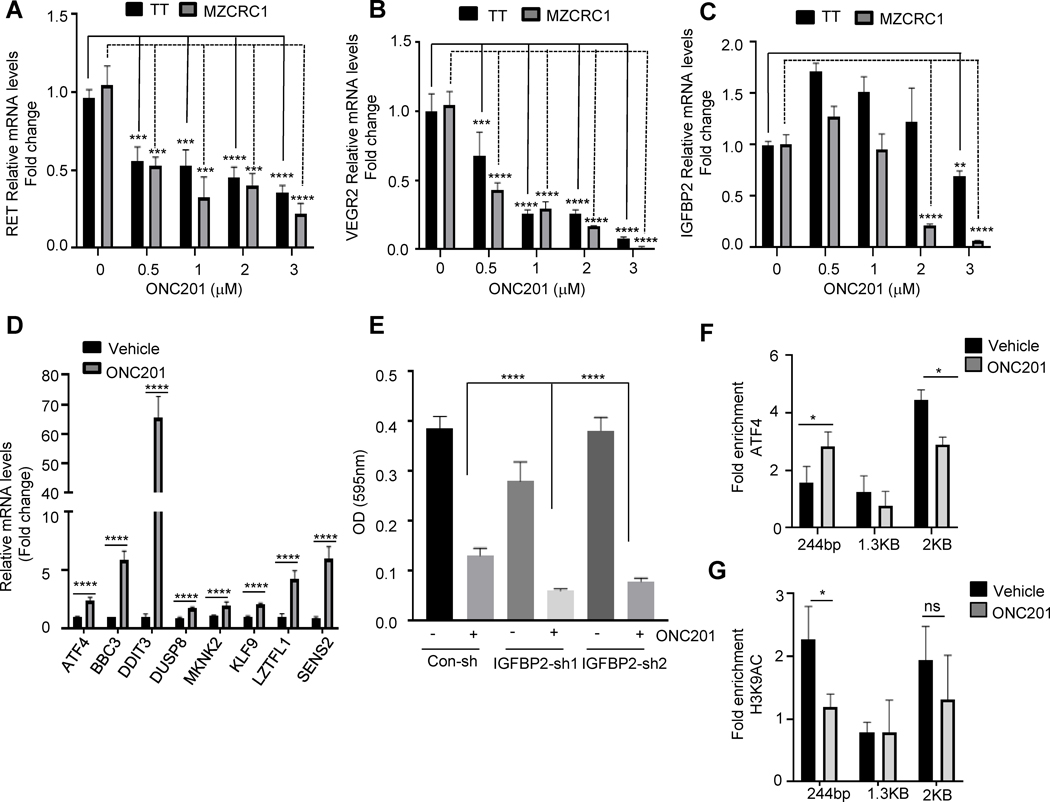
Gain-of-function point mutations in the receptor tyrosine kinase RET, a driver oncogene in medullary thyroid carcinoma (MTC), prevent apoptosis through inhibition of ATF4, a critical transcriptional regulator of endoplasmic reticulum stress. However, the critical regulatory mechanisms driving RET-dependent oncogenesis remain elusive, and there is a clinical need to identify a transcriptional RET inhibitor. Here, we found that RET depletion decreased IGFBP2 and VEGFR2 mRNA and protein expression in MTC cells. IGFBP2 knockdown decreased cell survival and migration of MTC cells. In patients, IGFBP2 expression increased in metastatic MTC, and high IGFBP2 associated with poor overall survival. VEGFR2 protein levels were positively associated with RET expression in primary tumors, and VEGF-mediated increased cell viability was RET dependent. The small-molecule ONC201 treatment of MTC cells caused apoptotic cell death, decreased transcription of RET, VEGFR2, IGFBP2, increased mRNA levels of ATF4, and ATF4 target genes including DDIT3, BBC3, DUSP8, MKNK2, KLF9, LZTFL1, and SESN2 Moreover, IGFBP2 depletion increased ONC201-induced cell death. ONC201 inhibited tumor growth at a well-tolerated dose of 120 mg/kg/week administered by oral gavage and decreased MTC xenograft cell proliferation and angiogenesis. The protein levels of RET, IGFBP2, and VEGFR2 were decreased in ONC201-treated xenografts. Our study uncovered a novel ONC201 mechanism of action through regulation of RET and its targets, VEGFR2 and IGFBP2; this mechanism could be translated into the clinic and represent a promising strategy for the treatment of all patients with MTC, including those with TKI-refractory disease and other cancer with RET abnormalities.


Conflict of interest statement

Conflict of interest statement: Rohinton Tarapore and Joshua E. Allen have employment relationships with Oncoceutics. Steven Sherman is a consultant to LOXO Oncology. All other authors have declared that no conflicts of interest exist.

Figures

Figure 1.
Figure 1.
RET knockdown decreased IGFBP2 and VEGFR2 expression. A) Heatmap from reverse-phase protein array analysis showing proteins or phosphoproteins differentially expressed in TT parental cells, control (con) non-target shRNA cells, and two RET-shRNA stable cell lines. Red indicates higher protein levels, and green indicates lower protein levels. B) Differentially expressed proteins in RET-shRNA stable cells using normalized linear values. C) Western blot analysis of indicated proteins in RET-depleted TT cells. D-E) Levels of RET, IGFBP2, and VEGFR2 mRNA in TT RET-shRNA cells in TT and MZCRC1 RET-shRNA cells. Error bars, ±SD (n=3). *p<0.05, ****p<0.0001 (Dunnett’s multiple comparison, unpaired two-tailed t-test).
Figure 2.
Figure 2.
High IGFBP2 expression is associated with an aggressive phenotype in MTC. A) TT cells were stably transduced with lentiviral shRNA vectors targeting IGFBP2 (sh1 and sh2) or non-target shRNA, and knockdown efficiency was determined by western blot analysis. B) IGFBP2 knockdown decreased the survival of MTC cells. The cell viability of two stable shRNA-IGFBP2 clones was analyzed by MTT assay. Data are representative of three independent experiments: error bars, ±SD (n=3) OD, optical density. C) IGFBP2 knockdown decreased the migration of MTC cells. Data are representative of three independent experiments. Error bars, ±SD (n=3). D) Representative immunohistochemical analysis of IGFBP2 in primary MTC tumors (n=52). Magnification, 20x. E) Association of high IGFBP2 expression with high tumor category (n=52). F) Association of high IGFBP2 expression with metastasis of MTC (n=52). G) High IGFBP2 expression is associated with poor overall survival. Kaplan-Meier survival analysis of 52 MTC primary tumors (P=0.0004, log-rank test). *P<0.05, ***P<0.001,****P<0.0001.
Figure 3.
Figure 3.
High VEGFR2 expression in MTC tumors is associated with RET expression. A) Analysis of VEGFR2 and RET mRNA expression in the 318 cell lines in the GlaxoSmithKline data set (E-MTAB-37). MZ, MZCRC1. B, C) VEGFA-associated increase in TT and MZCRC1 cell viability was dependent on RET expression. MTT assay was performed in TT and MZCRC1 cells expressing RET- shRNA or control shRNA after VEGFA treatment. TT and MZCRC1cells were serum-starved for 48 h, treated with VEGFA in serum-free media for 72 h at indicated concentrations, and analyzed by MTT assay. The results are the average of two independent experiments performed in six replicates. D) Quantitative real-time PCR was performed using total RNA isolated from 15 primary MTC tumors, with the relative quantities normalized to a normal thyroid sample using a VEGFR2-specific TaqMan probe and GAPDH mRNA as an internal control. Error bars, ±SD (n=3). E) Western blot analysis of MTC tumors with the indicated antibodies (n=9). Vinculin served as a loading control. F) Positive association of RET and VEGFR2 protein levels. Densitometric quantification of RET and VEGFR2 relative to vinculin (Pearson r=0.91, r2=0.84, P=0.0005).
Figure 4.
Figure 4.
ONC201 induces cancer cell death in MTC. A) MTC cells were treated with increasing concentrations (1–5 μM) of ONC201 for 72h, and cell viability was measured by an MTT assay. Data presented are the mean of three independent experiments. Percentage inhibition at each concentration of the ONC201 in TT and MZCRC1 cells is shown. Error bars, ±SD (n=3). B) Cell cycle analysis of MZCRC1 cells treated with increasing concentrations of ONC201 for 72 h. C) TT and MZCRC1 cells treated with ONC201 (3–5 μM) for 72 h, stained with cleaved caspase 3 and cleaved PARP, and analyzed by flow cytometry. D, E) TT cells (D) and MZCRC1 cells (E) treated with ONC201 at indicated concentrations for 72 h and analyzed by western blot with the indicated antibodies.
Figure 5.
Figure 5.
ONC201 inhibits RET, IGFBP2, and VEGFR2 transcription. A-C) TT and MZCRC1 cells were treated with ONC201 (0.5–3 μM) for 72 h, and gene expression was measured by quantitative real-time PCR using indicated probes and HPRT as an internal control. Error bars, ±SD (n=3). D) MZCRC1 cells were treated with ONC201 (3 μM) for 72 h and analyzed by quantitative real-time PCR using indicated probes and HPRT as an internal control. Error bars, ±SD (n=3). *P<0.05, **P<0.01, ***P<0.001, ****P<0.0001 by Sidak’s multiple comparison test. Data are representative of three independent experiments. E) IGFBP2 knockdown increased response to ONC201. Stable shRNA-IGFBP2 TT cells were treated with ONC201 (3 μM) and subjected to MTT assay after 72 h. Error bars, ±SD (n=6) OD, optical density. F-G) MZCRC1 cells were treated with ONC201 at 3 μM for 24 h. The chromatin was prepared and precipitated using control (immunoglobulin IgG) or ATF4-specific (F) or H3K9ac-specific antibody (G), and analyzed by quantitative PCR with the indicated primers.
Figure 6.
Figure 6.
ONC201 inhibits tumor growth. A, B) TT and MZCRC1 cells were injected into nude mice (n=8) and were treated with ONC201 (120 mg/kg/week, oral gavage) or vehicle for 8 weeks, and tumor growth was measured every week for 8 weeks. *P<0.05, **P<0.01, ***P<0.001, ****P<0.0001 by the Holm-Sidak method. C) Western blot analysis of the MTC xenograft tumor tissues from the vehicle-treated or ONC201-treated mice with the indicated antibodies. D) Densitometric quantification of RET and VEGFR2 and IGFBP2 relative to vinculin in control and ONC201 treated tumors (unpaired t-test). E) Immunohistologic analysis of the expression of proliferation marker Ki67 quantified as a percentage of Ki67-positive cells for each xenograft tumor (n=6), magnification 20x. F) Immunohistologic analysis of the expression of IGFBP2, quantified as H-score (% staining × intensity) for each xenograft tumor (n=6), magnification 20x. G) Immunohistologic analysis of the expression of angiogenesis marker CD31, quantified as the number of vessels per field in each xenograft tumor (n=6), magnification 20x.

References

    1. Cote GJ, Grubbs EG, Hofmann MC. Thyroid C-Cell Biology and Oncogenic Transformation. Recent Results Cancer Res. 2015;204:1–39. - PMC - PubMed
    1. Ball DW. Medullary thyroid cancer: monitoring and therapy. Endocrinol Metab Clin North Am. 2007;36(3):823–37, viii. - PMC - PubMed
    1. Santoro M, Carlomagno F. Central role of RET in thyroid cancer. Cold Spring Harb Perspect Biol. 2013;5(12):a009233. - PMC - PubMed
    1. Cote GJ, Evers C, Hu MI, Grubbs EG, Williams MD, Hai T, et al. Prognostic Significance of Circulating RET M918T Mutated Tumor DNA in Patients With Advanced Medullary Thyroid Carcinoma. J Clin Endocrinol Metab. 2017;102(9):3591–9. - PMC - PubMed
    1. Wells SA Jr., Robinson BG, Gagel RF, Dralle H, JA Fagin, M Santoro, et al. Vandetanib in patients with locally advanced or metastatic medullary thyroid cancer: a randomized, double-blind phase III trial. J Clin Oncol. 2012;30(2):134–41. - PMC - PubMed

Publication types

MeSH terms

Supplementary concepts