. 2021 Feb 3;7(6):eabd2827.
doi: 10.1126/sciadv.abd2827. Print 2021 Feb.

Autism-linked gene FoxP1 selectively regulates the cultural transmission of learned vocalizations

Affiliations

Autism-linked gene FoxP1 selectively regulates the cultural transmission of learned vocalizations

F Garcia-Oscos et al. Sci Adv. .

Abstract

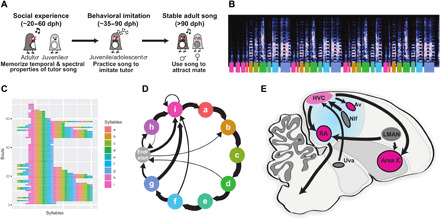
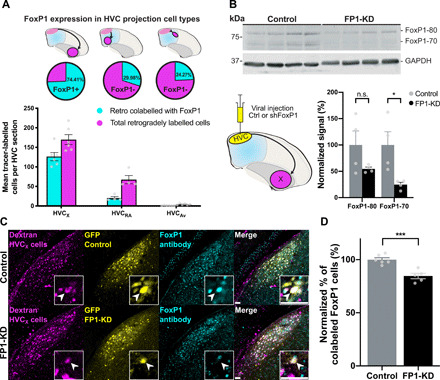
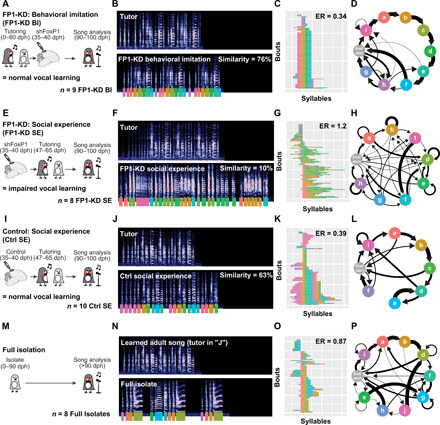
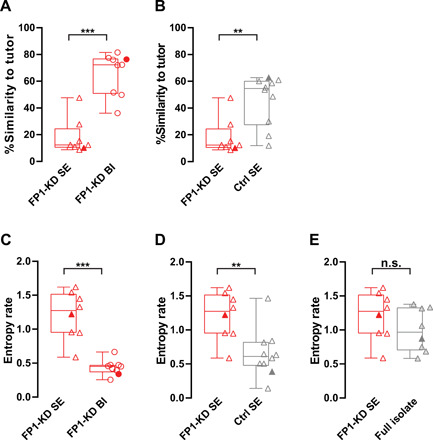
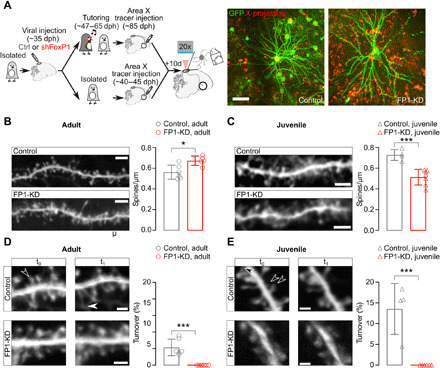
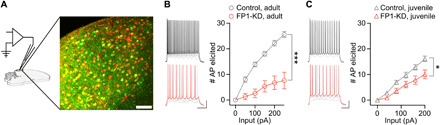
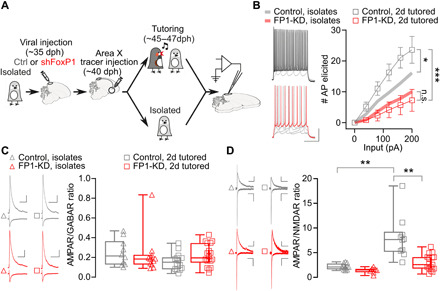
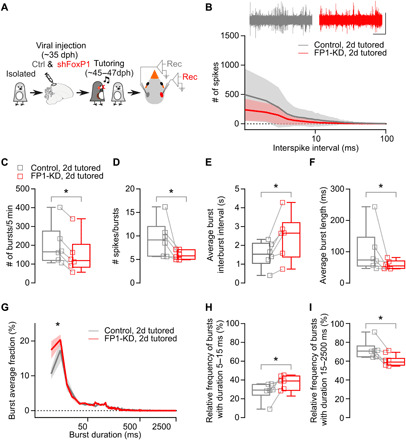
Autism spectrum disorders (ASDs) are characterized by impaired learning of social skills and language. Memories of how parents and other social models behave are used to guide behavioral learning. How ASD-linked genes affect the intertwined aspects of observational learning and behavioral imitation is not known. Here, we examine how disrupted expression of the ASD gene FOXP1, which causes severe impairments in speech and language learning, affects the cultural transmission of birdsong between adult and juvenile zebra finches. FoxP1 is widely expressed in striatal-projecting forebrain mirror neurons. Knockdown of FoxP1 in this circuit prevents juvenile birds from forming memories of an adult song model but does not interrupt learning how to vocally imitate a previously memorized song. This selective learning deficit is associated with potent disruptions to experience-dependent structural and synaptic plasticity in mirror neurons. Thus, FoxP1 regulates the ability to form memories essential to the cultural transmission of behavior.


Figures

Fig. 1
Fig. 1. Overview of zebra finch song learning and neural circuits for song.
(A) Timeline of zebra finch song learning in juvenile males. (B to D) Example representations of an adult zebra finch song; each color represents a syllable or note in the song. (B) Spectrogram of an adult male’s song. The y axis represents the frequency range (0 to 11.025 kHz), while the x axis represents total duration (5.27 s), and the colors reflect the amplitude. Colored bars underneath indicate introductory notes (pink, i) and syllables (a to h). (C) A syntax raster plot showing the syllables sung over repeated song bouts; colors reflect the syllables produced. (D) A representation of song syntax, with thickness of arrows representing the probability of syllable transitions. (E) Parasagittal schematic of the song circuit, with relevant nuclei labeled: Area X, striato-pallidal basal ganglia nucleus; Av, nucleus avalanche; HVC, premotor song nucleus; LMAN, lateral magnocellular nucleus of the anterior nidopallium; NIf, nucleus interfacialis of the nidopallium; Uva, nucleus uvaeformis; RA, robust nucleus of the arcopallium.
Fig. 2
Fig. 2. FoxP1 expression and knockdown in HVC.
(A) FoxP1 expression in different classes of HVC projection neurons. (Top) Schematics of retrograde injections, (middle) the proportion of cells that express FoxP1 for each cell type, and (bottom) FoxP1-expressing neurons for each HVC subtype, per HVC section (HVCX: 74.4 ± 2.2%, n = 3 birds, 6 hemispheres; HVCRA: 30.0 ± 0.7%, n = 2 birds, 4 hemispheres; HVCAv: 24.3 ± 2.5%, n = 3 birds, 6 hemispheres). (B) Western blot using a custom-made rabbit anti-FoxP1 antibody (59) of lysates from HVC injected with control (rAAV9/ds-CBh-GFP) (Ctrl) or shFoxP1 AAV (pscAAV-GFP-shFoxP1) (FP1-KD). (Bottom, left) Schematic of viral injections of control (n = 4 birds) or shFoxP1 (n = 4 birds) groups. (Bottom, right) Graph shows quantification of FoxP1 protein. Signals were normalized to GAPDH, averaged for each condition, and normalized to the controls. Histograms represent average ± SEM (FoxP1-80: control: 100 ± 26.6% versus FP1-KD: 54.7 ± 3.5%, Student’s t test with Bonferroni-Sidak correction for multiple comparisons, P > 0.05; FoxP1-70: control: 100 ± 25.0% versus FP1-KD: 24.7 ± 4.4%, Student’s t test with Bonferroni-Sidak, P = 0.027). n.s., not significant. (C) Representative examples of HVC sections from control (top) and FP1-KD (bottom) birds. Injections were performed as in schematic in (B). HVCX cells labeled with retrograde tracer in Area X (magenta, left), GFP signal from AAV-control/AAV-shFoxP1 injection (yellow, middle left), FoxP1 staining with antibody (cyan, middle right), and a merged composite (right). Inset boxes indicate example cell per condition, and arrowheads indicate the soma of the example neurons. Scale bars, 50 μm. (D) Quantification of (C), showing the difference in colocalization between control (n = 3 birds, 6 hemispheres) and FP1-KD (n = 3 birds, 5 hemispheres), as the normalized percentage of tracer-labeled cells that express FoxP1. Bar graphs represent average ± SEM (control: 100 ± 1.8% versus FP1-KD: 84.59 ± 2.52%, Student’s t test, P = 0.0006).
Fig. 3
Fig. 3. Song learning is impaired by FoxP1 KD.
(A, E, I, and M) Timelines illustrating tutoring experience of FP1-KD behavioral imitation (A), FP1-KD social experience (E), control social experience (I), and full isolate birds (M). (B, F, J, and N) Representative spectrograms from a single bird belonging to each experimental group and their tutor. All spectrograms are 5.27 s in duration and reflect a frequency range of 0 to 11.025 kHz. Colored underlines reflect syllable labels used for subsequent syntax visualizations and analysis. Similarity refers to percentage similarity to tutor; group comparisons in Fig. 4. The full isolate bird (N) had no tutor and therefore has no similarity to tutor score. It is contrasted with the song of an adult zebra finch with typical tutor exposure. (C, G, K, and O) Syntax raster plots illustrating the syntax stereotypy of an example bird for each condition. This is the same bird used for the spectrogram and syntax diagram. Each row reflects a single song bout, and each colored block reflects the syllable sung at that position in the bout. Rows are sorted according to syllable order. ER, entropy rate; group comparisons in Fig. 4. (D, H, L, and P) Diagrams reflecting syllable transitions produced by an example bird for each condition. Line thickness is proportional to the transition probability from the originating syllable to the following. Transitions with a probability of less than 4% are omitted for clarity.
Fig. 4
Fig. 4. Quantification of song learning and syntax in FP1-KD birds.
(A) FP1-KD social experience birds (n = 8) have significantly lower song similarity to tutor than FP1-KD behavioral imitation birds (n = 9, FP1-KD SE: 12.39 versus FP1-KD BE: 72.32, Mann-Whitney test, P < 0.001). Filled points correspond to the example birds shown in Fig. 3. (B) FP1-KD social experience birds (n = 8) have significantly lower song similarity to tutor than control social experience birds (n = 10, FP1-KD SE: 12.39 versus Ctrl SE: 54.6, Mann-Whitney test, P = 0.0031). Filled points correspond to the example birds shown in Fig. 3. (C) FP1-KD social experience birds (n = 8) have significantly higher song syntax entropy rates than FP1-KD behavioral imitation birds (n = 9, FP1-KD SE: 1.274 versus FP1-KD BI: 0.4512, Mann-Whitney test, P < 0.001). Filled points correspond to the example birds shown in Fig. 3. (D) FP1-KD social experience birds (n = 8) have significantly higher song syntax entropy rates than control social experience birds (n = 10, FP1-KD SE: 1.274 versus Ctrl SE: 0.6113, Mann-Whitney test, P = 0.0085). Filled points correspond to the example birds shown in Fig. 3. (E) Song syntax entropy rates do not differ significantly between FP1-KD social imitation (n = 8) and full isolate birds (n = 8, FP1-KD SE: 1.274 versus full isolate: 0.9667, Mann-Whitney test, P > 0.05). Filled points correspond to example birds shown in Fig. 3. For all box plots, median, 25th and 75th percentile, and minimum and maximum are reported. The single data points are overlaid on the side.
Fig. 5
Fig. 5. FP1-KD reduces structural plasticity on HVCX neurons.
(A) Left: Schematic of the experimental protocol and timeline of the experiments. Right: In vivo two-photon images of sample GFP-labeled (green) and retrogradely labeled (red) control and FP1-KD HVCX neurons. Scale bar, 50 μm. (B) Left: Representative in vivo two-photon images of GFP-expressing dendrite sections from control (top) and FP1-KD (bottom) normally reared adult HVCX neurons. Scale bar, 5 μm. Right: Average ± SEM dendritic spine density (spines per micrometer) from adult HVCX neurons (control adult: 0.56 ± 0.03, n = 821 spines, 6 cells, 2 animals; FP1-KD adult: 0.67 ± 0.02, n = 668 spines, 6 cells, 5 animals; Student’s t test, P = 0.01). (C) Left: Representative in vivo two-photon images of GFP-expressing dendrite sections from control (top) and FP1-KD (bottom) juvenile isolate HVCX neurons. Scale bar, 5 μm. Right: Average ± SEM dendritic spine density (spines per micrometer) from juvenile HVCX neurons (control juvenile: 0.73 ± 0.03, n = 769 spines, 4 cells, 3 animals; FP1-KD juvenile: 0.51 ± 0.03, n = 745 spines, 6 cells, 5 animals; Student’s t test, P < 0.001). (D) Left: Control and FP1-KD adult dendritic segments from HVCX neurons taken at two different times (t0,t1 across a 4-hour imaging interval). Filled and empty arrowheads indicate gained and lost spines, respectively. Scale bars, 2 μm. Right: Average ± SEM percent dendritic spine turnover (acquired + lost spines/total spines counted) from control and FP1-KD adults (control adult: 4.3 ± 0.8%, n = 1126 spines, 6 cells, 2 animals; FP1-KD adult: 0.0 ± 0.0%, n = 1148 spines, 6 cells, 5 animals; Student’s t test, P < 0.001). (E) Left: Representative images of control and FP1-KD juvenile dendritic segments from HVCX neurons, taken at two different times (t0,t1 across a 2-hour imaging interval). Scale bars, 2 μm. Right: Average ± SEM percent dendritic spine turnover (control juvenile: 13.6 ± 3.1%, n = 650 spines, 4 cells, 3 animals; FP1-KD juvenile: 0.0 ± 0.0%, n = 735 spines, 6 cells, 5 animals; Student’s t test, P < 0.001).
Fig. 6
Fig. 6. FP1-KD reduces excitability of HVCX neurons.
(A) Schematic of an ex vivo slice and patch-clamp recording setup with high-resolution image of HVC in a brain slice used for electrophysiology. Scale bar, 50 μm. (B) Example traces (left; scale bars, 20 mV and 200 ms) and plot (right) reporting the number of action potentials (AP) elicited by somatic current injections in HVCX neurons from control and FP1-KD adult brain slices. FoxP1 knockdown decreased the intrinsic excitability of HVCX neurons in adults (controls, n = 10, 5 animals; FP1-KD, n = 8, 3 animals; two-way ANOVA, interaction F10,160 = 30.87, treatment F1,16 = 34.56, P < 0.001). (C) Example traces (left; scale bars, 20 mV and 200 ms) and plot (right) reporting the number of action potentials elicited by somatic current injections in HVCX neurons from control and FP1-KD juvenile brain slices. FoxP1 knockdown decreased the intrinsic excitability of HVCX neurons in isolate juveniles (controls, n = 12, 3 animals; FP1-KD, n = 6, 2 animals; two-way ANOVA, interaction F10,200 = 7.053, treatment F1,20 = 7.627, P = 0.01). All data are reported as average ± SEM.
Fig. 7
Fig. 7. FP1-KD prevents experience-dependent synaptic strength modifications.
(A) Experimental timeline. (B) HVCX neurons were more excitable in control birds subjected to the 2-day tutoring regime compared to isolates (two-way ANOVA, interaction F10,190 = 4.598, treatment F1,19 = 5.376, P = 0.03). This difference is not present in FP1-KD birds (two-way ANOVA, interaction F10,180 = 0.4578, treatment F1,18 = 0.4018, P > 0.05). FoxP1 knockdown decreased intrinsic excitability of HVCX neurons (controls, n = 9, 4 animals; FP1-KD, n = 10, 3 animals; two-way ANOVA, interaction F10,170 = 9.308, treatment F1,17 = 10.73, P = 0.005). Trend lines relative to the same experiments, but conducted in isolates, are reported here from Fig. 6C. Data are reported as average ± SEM. (C) AMPA receptor (AMPAR)– and GABA receptor (GABAR)–mediated currents recorded at −60 or 10 mV, respectively (scale bars,100 pA and 100 ms), in HVCX neurons from isolate and 2-day tutored birds. AMPAR/GABAR current amplitude ratios from isolates (open triangles) and 2-day tutored birds (open squares). FoxP1 knockdown has no significant effect on the AMPAR/GABAR ratios (isolates control: 0.25 ± 0.04, n = 10, 5 animals; isolated FP1-KD: 0.23 ± 0.06, n = 11, 5 animals; 2d tutored control: 0.16 ± 0.02, n = 14, 5 animals; 2d tutored FP1-KD: 0.22 ± 0.03, n = 18, 6 animals; Kruskal-Wallis test, P > 0.05). (D) Evoked AMPAR- and NMDAR-mediated currents recorded at −70 or +40 mV, respectively (scale bars, 50 pA and 100 ms), in HVCX neurons in isolates and 2-day tutored birds (isolate control: 2.2 ± 0.2, n = 12, 6 animals; isolate FP1-KD: 1.4 ± 0.2, n = 8, 5 animals; 2d tutored control: 8.0 ± 1.4, n = 10, 6 animals; 2d tutored FP1-KD: 2.9 ± 0.4, n = 17, 6 animals; Kruskal-Wallis test, P < 0.001; Dunn’s multiple comparisons, isolate control versus 2d tutored controls, P = 0.002, isolate FP1-KD versus 2d tutored controls, P < 0.001, 2d tutored controls versus 2d tutored FP1-KD, P = 0.008). For all box plots, median, 25th and 75th percentile, and minimum and maximum are reported.
Fig. 8
Fig. 8. FP1-KD reduces the experience-dependent reorganization of network-level activity.
(A) Schematic of experimental time line. AAV injections in HVC to knock down FoxP1 in one hemisphere and control virus in the other hemisphere (pseudo-randomized). Extracellular activity was recorded in both hemispheres (n = 6 birds, 3 to 5 recordings per hemisphere). (B) Sample traces (scale bar, 0.5 mV, 1 s) and average interspike interval distribution (bin 1 ms, 1 to 100 ms, logarithmic scale, 300 s per recording) (control hemispheres versus FP1-KD hemispheres, two-way ANOVA, interaction F99,990 = 1.222, P > 0.05). Data are reported as average (thick line) ± SEM (semitransparent contour). (C) Total number of bursts (control hemispheres: 199.4 ± 44.4 versus FP1-KD hemispheres: 148.0 ± 41.2; Wilcoxon matched-pairs signed-rank test, P = 0.03). (D) Average number of spikes in a burst (control hemispheres: 9.4 ± 1.6 versus FP1-KD hemispheres: 6.0 ± 0.4; Wilcoxon matched-pairs signed-rank test, P = 0.03). (E) Average interburst interval (control hemispheres: 1.5 ± 0.3 versus FP1-KD hemispheres: 2.4 ± 0.5; Wilcoxon matched-pairs signed-rank test, P = 0.03). (F) Average burst length (control hemispheres: 101.6 ± 30 versus FP1-KD hemispheres: 58.6 ± 5.8; Wilcoxon matched-pairs signed-rank test, P = 0.03). (G) Relative distribution of burst duration, normalized for each recording (5-ms duration bins, 5 to 2500 ms, logarithmic scale; control hemispheres versus FP1-KD hemispheres, two-way ANOVA, interaction F498,4980 = 1.972, P < 0.001, control versus FP1-KD F1,10 = 5.570, P = 0.04). Data are reported as average (thick line) ± SEM (semitransparent contour). (H) Average relative prevalence of bursts with durations between 5 and 15 ms (control hemispheres: 27.9 ± 4.0 versus FP1-KD hemispheres: 37.8 ± 2.8; Wilcoxon matched-pairs signed-rank test, P = 0.03). (I) Average relative prevalence of bursts with durations between 15 and 2500 ms (control hemispheres: 72.1 ± 4.0 versus FP1-KD hemispheres: 62.2 ± 2.8; Wilcoxon matched-pairs signed-rank test, P = 0.03).

Similar articles

Cited by

References

    1. Bolhuis J. J., Okanoya K., Scharff C., Twitter evolution: Converging mechanisms in birdsong and human speech. Nat. Rev. Neurosci. 11, 747–759 (2010). - PubMed
    1. Doupe A. J., Kuhl P. K., Birdsong and human speech: Common themes and mechanisms. Annu. Rev. Neurosci. 22, 567–631 (1999). - PubMed
    1. Konopka G., Roberts T. F., Insights into the neural and genetic basis of vocal communication. Cell 164, 1269–1276 (2016). - PMC - PubMed
    1. H. Tager-Flusberg, R. Paul, C. E. Lord, Language and communication in autism, in Handbook of Autism and Pervasive Developmental Disorders, and Behavior, R. P. F. Volkmar, A. Klin, D. J. Cohen, Eds. (Wiley, ed. 3, 2005), vol. 1, pp. 335–364.
    1. Sperdin H. F., Schaer M., Aberrant development of speech processing in young children with autism: New insights from neuroimaging biomarkers. Front. Neurosci. 10, 393 (2016). - PMC - PubMed

Publication types

LinkOut - more resources