. 2021 Feb 3;7(6):eabd7819.
doi: 10.1126/sciadv.abd7819. Print 2021 Feb.

High-resolution 3D imaging uncovers organ-specific vascular control of tissue aging

Affiliations

High-resolution 3D imaging uncovers organ-specific vascular control of tissue aging

Junyu Chen et al. Sci Adv. .

Abstract

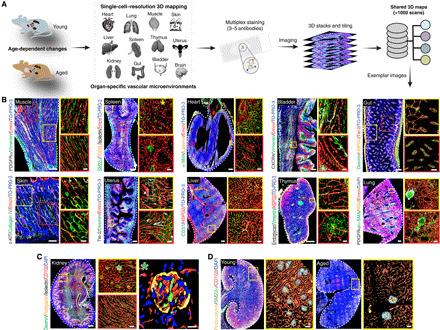
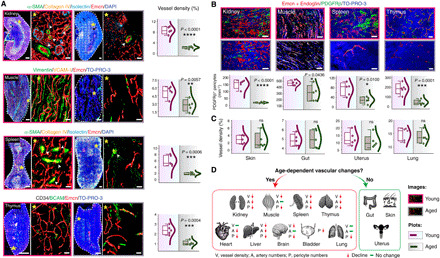
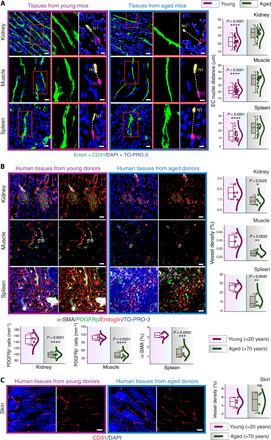
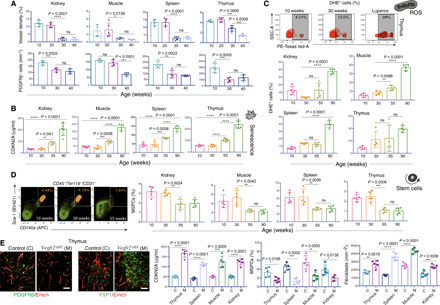
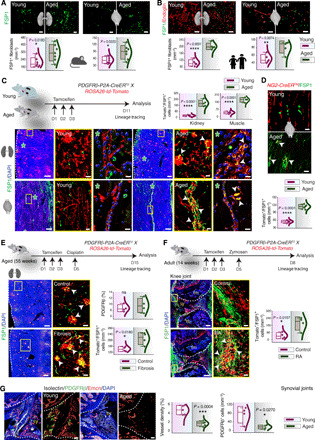
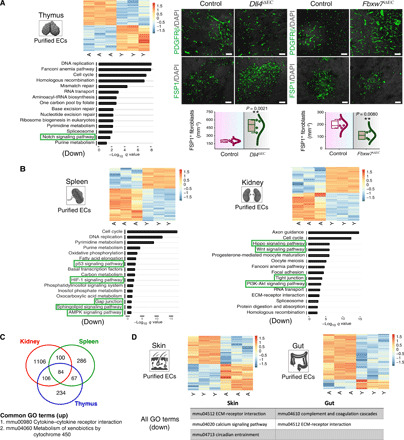
Blood vessels provide supportive microenvironments for maintaining tissue functions. Age-associated vascular changes and their relation to tissue aging and pathology are poorly understood. Here, we perform 3D imaging of young and aging vascular beds. Multiple organs in mice and humans demonstrate an age-dependent decline in vessel density and pericyte numbers, while highly remodeling tissues such as skin preserve the vasculature. Vascular attrition precedes the appearance of cellular hallmarks of aging such as senescence. Endothelial VEGFR2 loss-of-function mice demonstrate that vascular perturbations are sufficient to stimulate cellular changes coupled with aging. Age-associated tissue-specific molecular changes in the endothelium drive vascular loss and dictate pericyte to fibroblast differentiation. Lineage tracing of perivascular cells with inducible PDGFRβ and NG2 Cre mouse lines demonstrated that increased pericyte to fibroblast differentiation distinguishes injury-induced organ fibrosis and zymosan-induced arthritis. To spur further discoveries, we provide a freely available resource with 3D vascular and tissue maps.


Figures

Fig. 1
Fig. 1. Single-cell–resolution 3D imaging of vascular microenvironments and the image database.
(A) Schematic illustration of organs analyzed in young and aged wild-type (WT) mice. Multiplex staining (three to five antibodies) was performed, and whole-organ tile-scan images were acquired by confocal microscopy. More than ~1000 scans were acquired during the study with all the raw data available as a shared database. (B) Representative images of muscle, spleen, heart, bladder, gut, skin, uterus, liver, thymus, and lung from young mice stained with the antibodies as indicated. Insets on the right show high magnification of specific areas in the different organs. (C) Representative single-cell–resolution 3D images of a young mouse kidney stained with Desmin, Podoplanin, Isolectin, and CD102. Insets (middle) show high magnification of specific regions in the kidney. Asterisk on the right indicates higher magnifications with surface rendering for all markers. (D) Exemplar 3D images of young and aged kidney immunostained with Podocalyxin, SM22α, and CD102. Insets show higher magnifications with blood vessel surface rendered blue outlines around renal corpuscles (RC). Nuclei: TO-PRO-3 or DAPI as indicated. Scale bars, (B to D) 200 μm for tile scans of muscle, uterus, bladder, skin, gut, and thymus; 400 μm for spleen, kidney, heart, lung, and liver; insets, 50 μm; and single-cell–resolution images, 10 μm.
Fig. 2
Fig. 2. Loss of capillary, artery, and pericyte abundances in aging mice.
(A and B) Representative 3D tile scans of young and aged kidney, muscle, spleen, and thymus with immunostaining as indicated. Arrowheads represent arteries. Asterisks denote higher-magnification insets showing surface-rendered capillaries. (A) The combo plots (right) showing vessel density quantifications (n = 5). (B) Combo plots (bottom) show quantifications of PDGFRβ+ pericytes in young and aged kidney, muscle, spleen (n = 5), and thymus (n = 6). (C) Combo plots show quantifications for vessel density in young and aged skin, gut, uterus, and lung (n = 5). (D) Diagram shows nine organs with age-dependent vascular decline and three organs without age-dependent vascular changes. The P value derived from two-tailed unpaired t tests is given for all graphs. ns, not significant, *P < 0.05; **P < 0.01; ***P < 0.001; ****P < 0.0001. Nuclei: DAPI or TO-PRO-3. In the combo plot, the box represents means ± SD, the line in the box represents median, the lower and upper lines display the minimum and the maximum of the values, and the line on the right side of the box represents the sample distribution. Scale bars, (A) tile scans of spleen and kidney, 400 μm; for thymus and muscle, 200 μm; 50 μm for insets; (B) 20 μm.
Fig. 3
Fig. 3. Age-related vascular changes in mouse and human tissues.
(A) 3D images (left) show blood vessels in young (6-week-old) and aged (60-week-old) mouse kidney, muscle, and spleen. Combo plots (right) show quantification of EC nuclear distance in the young and aged organs (kidney, n = 42 from seven biological replicates; muscle, n = 47 from eight biological replicates; spleen, n = 37 from seven biological replicates). (B) Representative images of young and aged human tissue stained with α-SMA, PDGFRβ, and Endoglin. Combo plots (right) show a significant decline in vessel density in the kidney (n = 5), muscle (n = 5), and spleen (n = 4) upon aging. Combo plots (lower left) show quantifications of PDGFRβ+ cells in young and aged human kidney and muscle (n = 5). Combo plot (lower right) shows the quantification of α-SMA coverage (%) in young and aged human spleen (n = 4). (C) Representative images of young and aged human skin tissue. Combo plot (right) shows the quantification of vessel density in young and aged skin (n = 4). Data represent means ± SD. The P value derived from two-tailed unpaired t tests is given for all graphs. *P < 0.05; **P < 0.01; ***P < 0.001; ****P < 0.0001. Nuclei: DAPI or TO-PRO-3. N, nuclei. Scale bars, (A) 20 μm and 10 μm for insets; (B and C) 40 μm.
Fig. 4
Fig. 4. Vascular attrition precedes and dictates cellular aging.
(A) Bar graphs of the kidney, muscle, spleen, and thymus for vessel density (top, n = 5) and PDGFRβ+ cells (bottom, n = 4 or 5). (B) Bar graphs show concentration of CDKN2A measured by ELISA in tissues from p16LUC mice aged 10, 30, 55, and 90 weeks (n = 5). (C) Representative FACS plots of side scatter area (SSC-A) versus PE-Texas red-A (representing DHE+ cells) in the thymus at 10 and 30 weeks and the positive control (Luperox treated). Bar graphs showing the quantification of DHE+ cells in tissues at different ages (kidney and spleen, n = 5; others, n = 4). (D) Representative FACS plots of MSPCs of thymus at 10, 30, and 55 weeks. Bar graphs showing quantification of MSPCs (%) in tissues at different ages (n = 5). (E) 3D images of thymus from Vegfr2iΔEC (M) and littermate control (C) mice immunostained as indicated. Bar graphs showing the quantifications of CDKN2A concentration, MSPCs (%), and fibroblast numbers (n = 5). Data represent means ± SD. The P value derived from two-tailed unpaired t tests is given for two groups and one-way ANOVA test with Tukey’s multiple comparisons test for more than two groups. *P < 0.05; **P < 0.01; ***P < 0.001; ****P < 0.0001. Scale bars, (E) 50 μm.
Fig. 5
Fig. 5. Pericytes to fibroblast differentiation during aging, fibrosis, and arthritis.
(A) FSP1 staining and fibroblast numbers in murine tissues (n = 7). (B) FSP1 staining and fibroblast quantifications in human tissues (n = 5). (C) FSP1 immunostaining in PDGFRβ-P2A-CreERT2; ROSA26-td-Tomato mice. Asterisks indicate higher magnifications of regions at single-cell resolution. Combo plots show tomato+/FSP1+ cell numbers (n = 4 or 5). (D) FSP1 staining and quantifications of tomato+/FSP1+ cell numbers in NG2-CreERTM; ROSA26-td-Tomato young and aged muscle (n = 5). (E) FSP1 staining in control and fibrosis kidney and quantifications of PDGFRβ coverage and tomato+/FSP1+ cell numbers (n = 4). (F) FSP1 immunostaining and quantifications on the synovial joints from PDGFRβ-P2A-CreERT2; ROSA26-td-Tomato control and RA mice (n = 4). (G) 3D images of young and aged mouse joints immunostained as indicated. Combo plots show vessel density (n = 5) and PDGFRβ+ cell numbers (n = 4). Data represent means ± SD. The P value is derived from two-tailed unpaired t tests. *P < 0.05; **P < 0.01; ***P < 0.001; ****P < 0.0001. Yellow boxes show insets at higher magnification. Arrowheads represent tomato+/FSP1+ cells. fm, femur; tb, tibia; sy, synovia. Nuclei: DAPI. Scale bars, (A and B) 40 μm; (D) 50 μm; (C, E, and F) tile scans, 250 μm; insets, 50 μm; (G) 50 μm.
Fig. 6
Fig. 6. Molecular changes in the aging endothelium.
(A) Heatmap (left) shows RNA-seq expression levels of differentially expressed genes between young (Y; 8- to 10-week-old) and aged (A; 50- to 55-week-old) thymus (FDR-adjusted P value cutoff of <0.01). The color intensity represents the row scaled normalized log2(CPM) expression, whereas the column represents the replicates. Red and blue color intensity indicates up-regulated and down-regulated genes. Bottom left showing the most significant down-regulated biological processes obtained from gene set enrichment. 3D images show PDGFRβ and FSP1 immunostaining in Dll4iΔEC and littermate control thymus as well as Fbxw7iΔEC and control thymus (11-week-old). Combo plots show fibroblast numbers (n = 4). (B) Heatmaps showing RNA-seq expression levels of differentially expressed genes between young (Y; 8- to 10-week-old) and aged (A; 50- to 55-week-old) spleen and kidney. Bottom shows the most significant GO terms of the down-regulated pathways. (C) Venn diagram of biological processes obtained from gene set enrichment analysis representing the up-regulated pathways from kidney, spleen, and thymus. (D) Heatmaps showing RNA-seq expression levels of differentially expressed genes between young (Y) and aged (A) skin and gut. Bottom shows the GO terms of the down-regulated pathways. Data represent means ± SD. The P value is derived from two-tailed unpaired t tests. **P < 0.01. Nuclei: DAPI. Scale bars, (A) 50 μm. ECM, extracellular matrix.

References

    1. López-Otín C., Blasco M. A., Partridge L., Serrano M., Kroemer G., The hallmarks of aging. Cell 153, 1194–1217 (2013). - PMC - PubMed
    1. Flach J., Bakker S. T., Mohrin M., Conroy P. C., Pietras E. M., Reynaud D., Alvarez S., Diolaiti M. E., Ugarte F., Forsberg E. C., Le Beau M. M., Stohr B. A., Méndez J., Morrison C. G., Passegué E., Replication stress is a potent driver of functional decline in ageing haematopoietic stem cells. Nature 512, 198–202 (2014). - PMC - PubMed
    1. Rebelo-Marques A., De Sousa Lages A., Andrade R., Ribeiro C. F., Mota-Pinto A., Carrilho F., Espregueira-Mendes J., Aging hallmarks: The benefits of physical exercise. Front. Endocrinol. (Lausanne). 9, 258 (2018). - PMC - PubMed
    1. Schlereth K., Weichenhan D., Bauer T., Heumann T., Giannakouri E., Lipka D., Jaeger S., Schlesner M., Aloy P., Eils R., Plass C., Augustin H. G., The transcriptomic and epigenetic map of vascular quiescence in the continuous lung endothelium. eLife 7, e34423 (2018). - PMC - PubMed
    1. R. N. Pittman, The Circulatory System and Oxygen Transport (Morgan & Claypool Life Sciences, 2011; www.ncbi.nlm.nih.gov/books/NBK54112/).

Publication types

LinkOut - more resources