. 2021 Feb 3;7(6):eabf1374.
doi: 10.1126/sciadv.abf1374. Print 2020 Feb.

Vaccine optimization for COVID-19: Who to vaccinate first?

Affiliations

Vaccine optimization for COVID-19: Who to vaccinate first?

Laura Matrajt et al. Sci Adv. .

Abstract

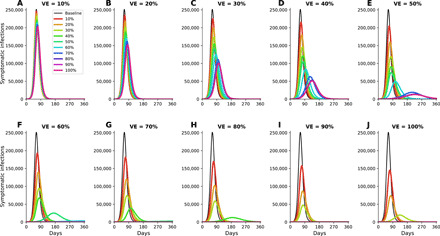
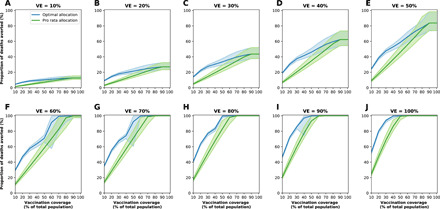
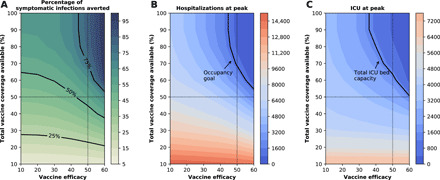
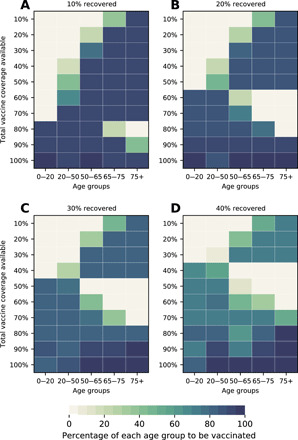
Vaccines, when available, will likely become our best tool to control the COVID-19 pandemic. Even in the most optimistic scenarios, vaccine shortages will likely occur. Using an age-stratified mathematical model paired with optimization algorithms, we determined optimal vaccine allocation for four different metrics (deaths, symptomatic infections, and maximum non-ICU and ICU hospitalizations) under many scenarios. We find that a vaccine with effectiveness ≥50% would be enough to substantially mitigate the ongoing pandemic, provided that a high percentage of the population is optimally vaccinated. When minimizing deaths, we find that for low vaccine effectiveness, irrespective of vaccination coverage, it is optimal to allocate vaccine to high-risk (older) age groups first. In contrast, for higher vaccine effectiveness, there is a switch to allocate vaccine to high-transmission (younger) age groups first for high vaccination coverage. While there are other societal and ethical considerations, this work can provide an evidence-based rationale for vaccine prioritization.


Figures

Fig. 1
Fig. 1. Simulated prevalence of symptomatic infections.
Simulated prevalence of symptomatic COVID-19 infections for VE ranging from 10% (A) to 100% (J) in 10% increments. For each VE and each vaccination coverage, the optimal vaccine allocation for minimizing symptomatic infections was used in these simulations. Colors represent different vaccination coverage, ranging from 0% (black, “baseline”) to 100% (magenta). For clarity, we present here epidemic curves for the main set of parameters only and show a complete figure with uncertainty bounds in fig. S2.
Fig. 2
Fig. 2. Four key metrics of COVID-19 burden under optimal distribution of vaccine.
Percentage of symptomatic infections (A) and deaths (B) averted, and number of maximum non-ICU (C) and ICU (D) hospitalizations as a function of VE and vaccination coverage (total vaccine available as a percentage of the population). The dotted lines correspond to VE = 50% and vaccine available to cover 50% of the population. The isoclines indicate the current goal for Washington state having 10% of licensed general (non-ICU) hospital beds occupied by patients with COVID-19 in (C) and total ICU licensed hospital beds in Washington state in (D).
Fig. 3
Fig. 3. Percentage of deaths averted under the optimal and the pro-rata strategies for different VE.
Percentage of deaths averted for the optimal allocation strategy (blue) and the pro rata strategy (green) for VE ranging from 10 (A) to 100% (J) in 10% increments and vaccination coverage ranging from 10 to 100% of the total population. The shaded areas represent results of the 1000 simulations with the top and bottom 2.5% simulations removed.
Fig. 4
Fig. 4. Optimal allocation strategies to minimize deaths for different VE.
Optimal allocation strategies for minimizing deaths for VE ranging from 10 (A) to 100% (J) in 10% increments (additional figures for minimizing symptomatic infections, number of non-ICU hospitalizations at peak, and number of ICU hospitalizations at peak are given in the Supplementary Materials). For each plot, each row represents the total vaccination coverage available (percentage of the total population to be vaccinated), and each column represents a different vaccination group. Colors represent the percentage of the population in a given vaccination group to be vaccinated.
Fig. 5
Fig. 5. Optimal allocation strategies for all objective functions analyzed.
Optimal allocation strategies for minimizing: Symptomatic infections (A), number of non-ICU hospitalizations at peak (B), number of ICU hospitalizations at peak (C), and total number of deaths (D). Here, we assumed VE = 60%. For each plot, each row represents the total vaccination coverage available (percentage of the total population to be vaccinated), and each column represents a different vaccination group. Colors represent the percentage of the population in a given vaccination group to be vaccinated.
Fig. 6
Fig. 6. Optimal allocation strategies for different VE with a vaccine including an effect against COVID-19 disease.
Optimal allocation strategies for minimizing total symptomatic infections for VE ranging from 10% (A) to 60% (F) in 10% increments for VECOV = 60%. For each plot, each row represents the total vaccination coverage available (percentage of the total population to be vaccinated), and each column represents a different vaccination group. Colors represent the percentage of the population in a given vaccination group to be vaccinated.
Fig. 7
Fig. 7. Three key metrics of COVID-19 burden under optimal distribution of vaccine for VECOV = 60%.
Percentage of symptomatic infections averted (A) and number of maximum non-ICU (B) and ICU (C) hospitalizations as a function of VE and vaccination coverage (total vaccine available as a percentage of the population). The dotted lines correspond to VE = 50% and vaccine available to cover 50% of the population. The isoclines indicate the current goal for Washington state having 10% of licensed general (non-ICU) hospital beds occupied by patients with COVID-19 in (B) and total ICU licensed hospital beds in Washington state in (C).
Fig. 8
Fig. 8. Optimal allocation strategies for minimizing deaths assuming different levels of pre-existing immunity in the population.
Optimal allocation strategies for minimizing deaths assuming 10% (A), 20% (B), 30% (C), and 40% (D) of the population has natural immunity to COVID-19 at the start of the simulations. Here, we assumed VE = 60%. For each plot, each row represents the total vaccination coverage available (percentage of the total population to be vaccinated), and each column represents a different vaccination group. Colors represent the percentage of the population in a given vaccination group to be vaccinated.
Fig. 9
Fig. 9. Optimal allocation strategies for minimizing deaths assuming different vaccination rates.
Optimal allocation strategies for minimizing deaths for two VE = 50% (A to C) and 90% (D to F) and for three different vaccination rates: 75,000 (A and D), 150,000 (B and E), and 300,000 (C and F) vaccine doses administered per week. For each plot, each row represents the total vaccination coverage available (percentage of the total population to be vaccinated), and each column represents a different vaccination group. Colors represent the percentage of the population in a given vaccination group to be vaccinated.
Fig. 10
Fig. 10. Optimal allocation strategies for minimizing deaths for different values of R0.
Optimal allocation strategies for minimizing deaths for three different VE: 30% (A to C), 60% (D to F), and 90% (G to I) for three different values of R0 = 1.5, 2, and 2.5 (additional figures for minimizing symptomatic infections, number of non-ICU hospitalizations at peak, and number of ICU hospitalizations at peak are given in the Supplementary Materials). For each plot, each row represents the total vaccination coverage available (percentage of the total population to be vaccinated), and each column represents a different vaccination group. Colors represent the percentage of the population in a given vaccination group to be vaccinated.

Update of

References

    1. Johns Hopkins University and Medicine, Coronavirus COVID-19 global cases by the Center for Systems Science and Engineering (CSSE) at Johns Hopkins University (JHU) (2020); https://coronavirus.jhu.edu/map.html.
    1. Mullard A., COVID-19 vaccine development pipeline gears up. Lancet 395, 1751–1752 (2020). - PMC - PubMed
    1. C. Zimmer, J. Corum, S.-L. Wee, Coronavirus Vaccine Tracker (2020); https://www.nytimes.com/interactive/2020/science/coronavirus-vaccine-tra....
    1. Cohen R., Jung C., Ouldali N., Sellam A., Batard C., Cahn-Sellem F., Elbez A., Wollner A., Romain O., Corrard F., Aberrane S., Soismier N., Creidy R., Smati-Lafarge M., Launay O., Bechet S., Varon E., Levy C., Assessment of spread of SARS-CoV-2 by RT-PCR and concomitant serology in children in a region heavily affected by COVID-19 pandemic. medRxiv 2020.06.12.20129221 (2020).
    1. Usher A. D., COVID-19 vaccines for all? Lancet 395, 1822–1823 (2020). - PMC - PubMed

Publication types

Substances