

Country-level determinants of the severity of the first global wave of the COVID-19 pandemic: an ecological study
- PMID: 33536319
- PMCID: PMC7868125
- DOI: 10.1136/bmjopen-2020-042034
Country-level determinants of the severity of the first global wave of the COVID-19 pandemic: an ecological study
Abstract
Objective: We aimed to identify the country-level determinants of the severity of the first wave of the COVID-19 pandemic.
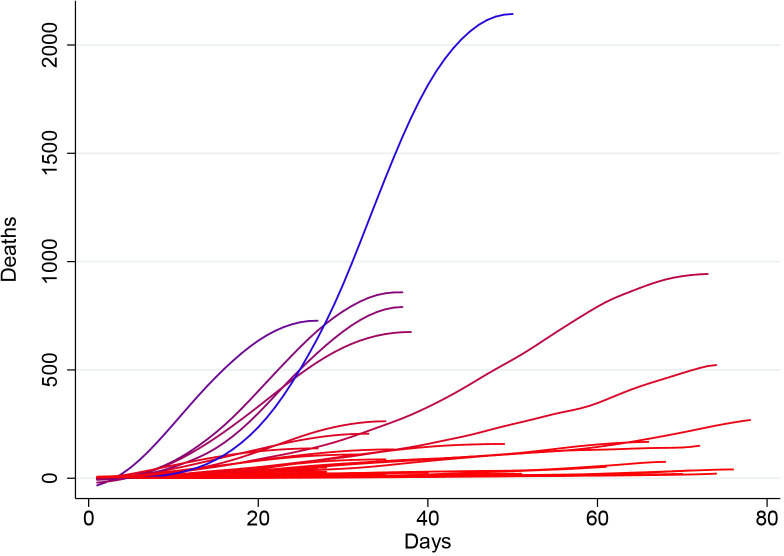
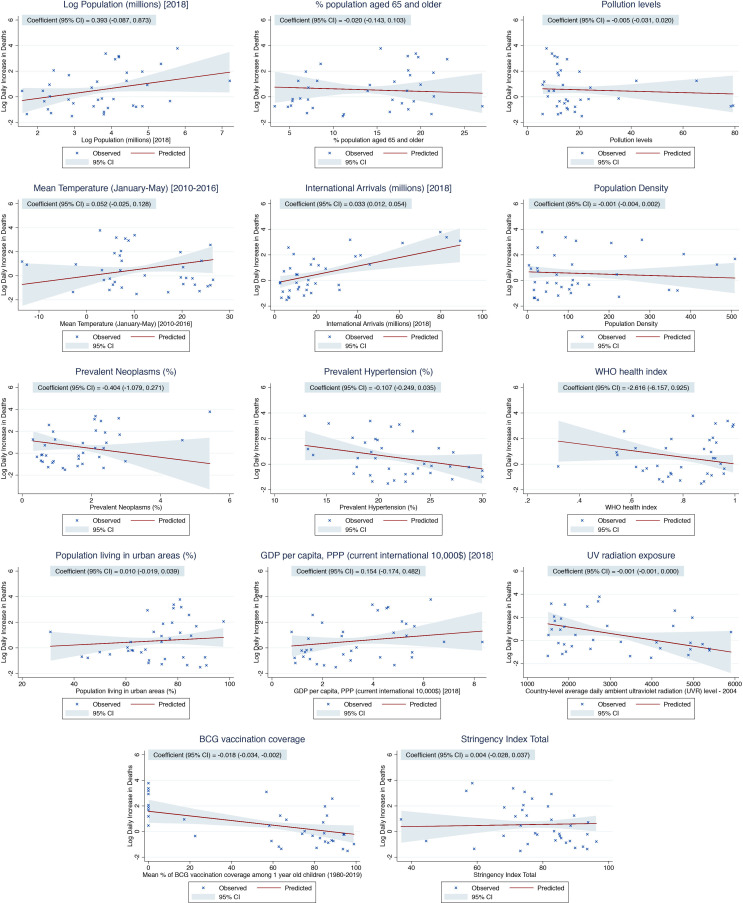
Design: Ecological study of publicly available data. Countries reporting >25 COVID-19 related deaths until 8 June 2020 were included. The outcome was log mean mortality rate from COVID-19, an estimate of the country-level daily increase in reported deaths during the ascending phase of the epidemic curve. Potential determinants assessed were most recently published demographic parameters (population and population density, percentage population living in urban areas, population >65 years, average body mass index and smoking prevalence); economic parameters (gross domestic product per capita); environmental parameters (pollution levels and mean temperature (January-May); comorbidities (prevalence of diabetes, hypertension and cancer); health system parameters (WHO Health Index and hospital beds per 10 000 population); international arrivals; the stringency index, as a measure of country-level response to COVID-19; BCG vaccination coverage; UV radiation exposure; and testing capacity. Multivariable linear regression was used to analyse the data.
Primary outcome: Country-level mean mortality rate: the mean slope of the COVID-19 mortality curve during its ascending phase.
Participants: Thirty-seven countries were included: Algeria, Argentina, Austria, Belgium, Brazil, Canada, Chile, Colombia, the Dominican Republic, Ecuador, Egypt, Finland, France, Germany, Hungary, India, Indonesia, Ireland, Italy, Japan, Mexico, the Netherlands, Peru, the Philippines, Poland, Portugal, Romania, the Russian Federation, Saudi Arabia, South Africa, Spain, Sweden, Switzerland, Turkey, Ukraine, the UK and the USA.
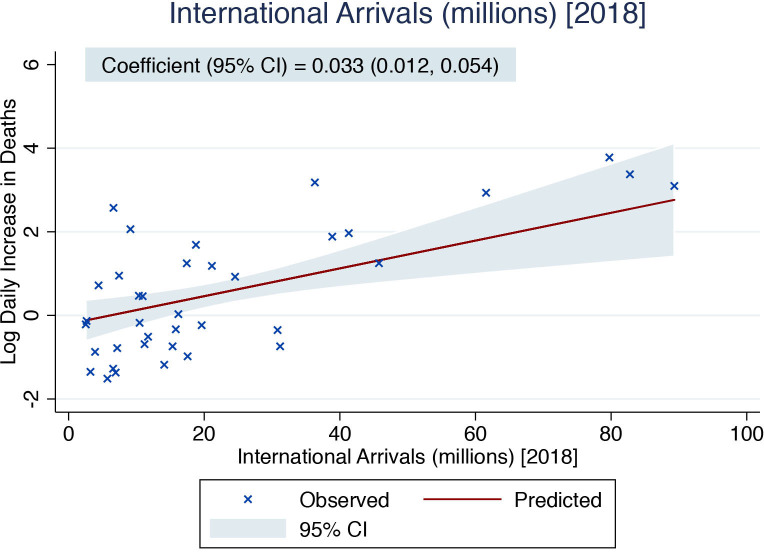
Results: Of all country-level determinants included in the multivariable model, total number of international arrivals (beta 0.033 (95% CI 0.012 to 0.054)) and BCG vaccination coverage (-0.018 (95% CI -0.034 to -0.002)), were significantly associated with the natural logarithm of the mean death rate.
Conclusions: International travel was directly associated with the mortality slope and thus potentially the spread of COVID-19. Very early restrictions on international travel should be considered to control COVID-19 outbreaks and prevent related deaths.
Keywords: epidemiology; infectious diseases; public health.
© Author(s) (or their employer(s)) 2021. Re-use permitted under CC BY-NC. No commercial re-use. See rights and permissions. Published by BMJ.
Conflict of interest statement
Competing interests: None declared.
Figures
References
-
- World Health Orgainzation Coronavirus disease (COVID-19) situation report – 140. WHO, 2020.
-
- Roser M, Ritchie H, Ortiz-Ospina E. Mortality risk of COVID-19. Available: https://ourworldindata.org/mortality-risk-covid [Accessed 5 Jul 2020].
Publication types
MeSH terms
LinkOut - more resources
Full Text Sources
Other Literature Sources
Medical