. 2021 Feb 3;12(1):764.
doi: 10.1038/s41467-020-20885-8.

A fast and efficient colocalization algorithm for identifying shared genetic risk factors across multiple traits

Affiliations

A fast and efficient colocalization algorithm for identifying shared genetic risk factors across multiple traits

Christopher N Foley et al. Nat Commun. .

Abstract

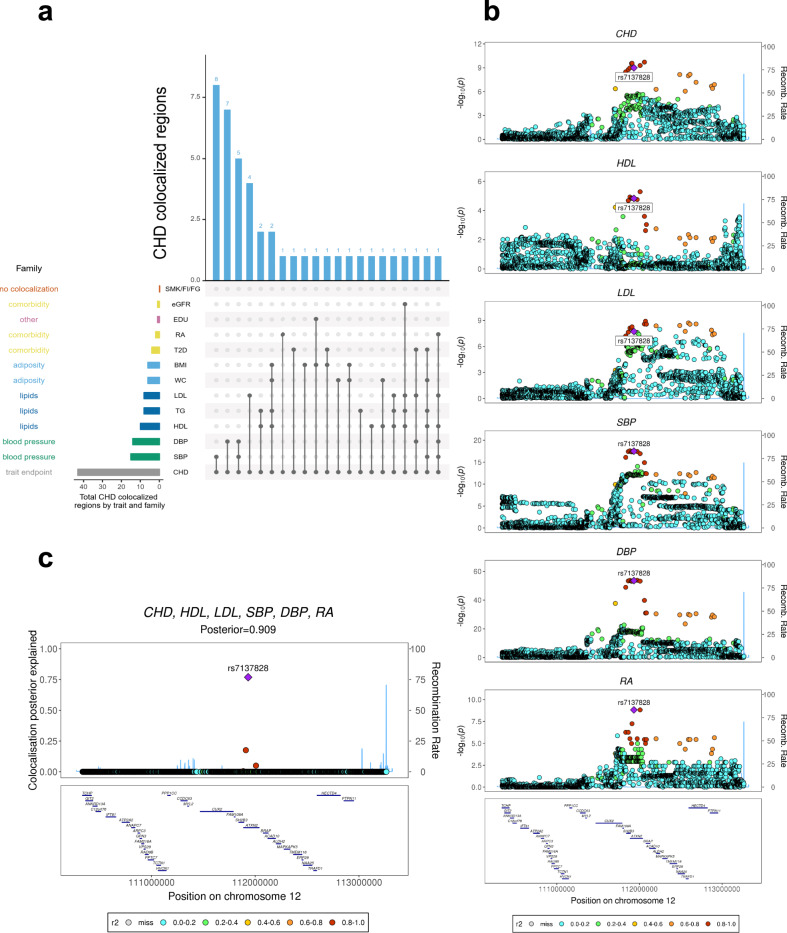
Genome-wide association studies (GWAS) have identified thousands of genomic regions affecting complex diseases. The next challenge is to elucidate the causal genes and mechanisms involved. One approach is to use statistical colocalization to assess shared genetic aetiology across multiple related traits (e.g. molecular traits, metabolic pathways and complex diseases) to identify causal pathways, prioritize causal variants and evaluate pleiotropy. We propose HyPrColoc (Hypothesis Prioritisation for multi-trait Colocalization), an efficient deterministic Bayesian algorithm using GWAS summary statistics that can detect colocalization across vast numbers of traits simultaneously (e.g. 100 traits can be jointly analysed in around 1 s). We perform a genome-wide multi-trait colocalization analysis of coronary heart disease (CHD) and fourteen related traits, identifying 43 regions in which CHD colocalized with ≥1 trait, including 5 previously unknown CHD loci. Across the 43 loci, we further integrate gene and protein expression quantitative trait loci to identify candidate causal genes.


Conflict of interest statement

J.M.M.H. became a full-time employee of Novo Nordisk Ltd while this manuscript was under review. All other authors declare no competing interests.

Figures

Fig. 1
Fig. 1. Colocalization hypotheses and causal configurations.
Statistical colocalization hypotheses and examples of their associated SNP configurations that allow for at most one causal variant for each of m traits in a region containing Q genetic variants. For clarity, the hypotheses and a single configuration associated with each hypothesis are shown for m ≥ 4 traits, but the column totals Bell (m + 1) and (Q + 1)m are correct for m ≥ 2.
Fig. 2
Fig. 2. Illustration of the HyPrColoc approximation.
We illustrate the HyPrColoc approach with m = 2 traits. Statistical colocalization between traits which do not share an association region, i.e. do not have shared genetic predictors, is not possible (no colocalization criteria satisfied). However, traits which do (satisfying criterion 1) possess the possibility. HyPrColoc first assesses evidence supporting all m traits sharing an association region, which quickly identifies utility in a colocalization framework. HyPrColoc then assesses whether any shared association region is due to colocalization between the traits (criteria 1 and 2) or due to a region of strong LD between two distinct causal variants, one for each trait (criterion 1 only). Results from these two calculations are combined to accurately approximate the PPFC.
Fig. 3
Fig. 3. Comparison of HyPrColoc and MOLOC computation time and posterior probability of colocalization.
(Left panel) Computation time (seconds) for HyPrColoc (yellow) and MOLOC (blue) to assess full colocalization across M ≤ 1000 traits in a region containing Q = 1000 SNPs. MOLOC was restricted to M ≤ 5 traits owing to the computational and memory burden of the MOLOC algorithm when M > 5. When M = 5, we summarise the computation time of MOLOC from 10 datasets - as it took around 1 hour to analyse a single dataset, in all other scenarios performance was summarised from 1000 datasets. Three reference lines are plotted: (i) Bell(M + 1), which denotes the theoretical cost of exhaustively enumerating all hypotheses; (ii) M2, denoting quadratic cost and; (ii) M1, denoting the linear complexity of the HyPrColoc algorithm. (Right panel) Distribution of the posterior probability of colocalization between all traits, i.e. the posterior probability of full colocalization (PPFC), using HyPrColoc (yellow) and MOLOC (blue) across M ∈ {2,3,4} traits. Error bars denote the 1st and 9th deciles and a point denotes the median value. Despite differences in the prior set-up between the methods, the median absolute relative difference between the two posterior probabilities was ≲ 0.005.
Fig. 4
Fig. 4. Assessment of the HyPrColoc posterior probability.
Simulation results for a sample size N ∈ {5,000, 10,000, 20,000} and a causal variant explaining {0.5%, 1%, 2%} of variation across m ∈ {2, 5, 10, 20, 100} traits. Presented is the distribution of the HyPrColoc posterior probability of full colocalization (PPFC) for variant-level priors only (top); the probability of correctly identifying the causal variant (middle) and; linkage disequilibrium between an incorrectly identified causal variant and the true causal variant (bottom). Error bars denote the 1st and 9th deciles and a point denotes the median value and performance was summarised from 1000 simulated datasets. Comparing performance across increasing study sample size and variance explained by the causal variant, power to detect all colocalized traits is reduced when including studies with smaller sample sizes (top row), however, including these studies can still boost the probability of correctly identifying the shared causal variant irrespective of variance explained (middle row).
Fig. 5
Fig. 5. Number of clusters of colocalized traits and number of traits within a cluster.
Results from the single causal variant simulation study (c.f. Supplementary Fig. S2), presenting a the number of clusters of colocalized traits; and b the number of traits within each cluster identified by HyPrColoc. Error bars denote the 1st and 9th deciles and a point denotes the median value.
Fig. 6
Fig. 6. Performance of the BB clustering algorithm when excluding clusters of colocalized traits with lower posterior probability.
In each of the three scenarios presented, m = 10 traits with non-overlapping samples were generated, trait sample sizes were drawn randomly from the set N = {1,000, 5,000, 10,000, 15,000, 20,000} and variant-level causal configuration priors were used with three choices of the colocalization prior pc ∈ {0.05, 0.02, 0.01}. In scenario (i) there is one cluster of 10 colocalized traits; in scenario (ii) there are 2 clusters of colocalized traits, each comprising of 3 traits, the remaining 4 traits do not have causal variants and; in scenario (iii) there are 4 clusters of colocalized traits, 2 clusters of 3 traits and 2 clusters of 2 traits sharing a causal variant. Traits within a cluster share a single causal variant and causal variants between clusters are distinct, however, a distinct variant can be in perfect LD, i.e. r2 = 1, with another distinct variant. In all scenarios, we present results that passed the posterior probability of colocalization PRPA ≥ 0.7. Presented are the classification measures: a accuracy; b true positive rate; and c the false positive rate. See ‘Methods’ for a description of how we define these in the context of clusters of colocalized traits. In d we present the LD between the identified causal variant for each cluster of colocalized traits and the true causal variant for each cluster. Error bars denote the 1st and 9th deciles and a point denotes the median value. The results highlight that on increasing the posterior threshold from 0.5 (c.f. Supplementary Fig. S2) to 0.7, HyPrColoc’s ability to cluster multiple traits together demonstrably improves accuracy and the true positive rate relative to pairwise analyses.
Fig. 7
Fig. 7. HyPrColoc’s sensitivity analysis.
Heatmap visualizing changes in the clusters of colocalized traits identified by HyPrColoc when using different choices of the colocalization prior pc = {0.05, 0.02, 0.01, 0.005} and algorithm thresholds PR*=PA*={0.5,0.6,0.7}. Cells appear darker when trait pairs cluster more often. Data were generated under scenario (iii) and when: a the single causal variant assumption is satisfied; or b the single causal variant assumption is violated.
Fig. 8
Fig. 8. Genome-wide multi-trait colocalization analysis of CHD and fourteen related traits.
a Summary of the number of regions across the genome in which CHD colocalizes with at least one related trait. Results are aggregated by trait family, e.g. major lipids, and by each individual trait (see Supplementary Table S1 for a list of trait abbreviations). b Stacked association plots of CHD with high-density lipoprotein (HDL), low-density lipoprotein (LDL), systolic blood pressure (SBP), diastolic blood pressure (DBP) and rheumatoid arthritis (RA). HyPrColoc implicated both the SH2B3-ATXN2 locus and risk variant rs713782, both of which have been previously reported as associated with CHD risk. However, HyPrColoc extended this result by identifying that the risk loci and variant are shared with 5 conventional CHD risk factors. SNPs in stronger LD with the putative causal SNP rs713782 appear darker in the plot. c HyPrColoc identified rs713782 as a candidate causal variant explaining the shared association signal between CHD and the 5 related traits. The posterior probability of colocalization between the traits was 0.909 and rs713782 explained over 76% of this, i.e. the posterior probability of rs713782 being the shared causal variant is 0.909 × 0.76 = 0.69. The next candidate variant explained <20%.

Similar articles

Cited by

References

    1. Nica AC, Dermitzakis ET. Using gene expression to investigate the genetic basis of complex disorders. Hum. Mol. Genet. 2008;17:129–134. doi: 10.1093/hmg/ddn285. - DOI - PMC - PubMed
    1. Giambartolomei, C. et al. Bayesian test for colocalisation between pairs of genetic association studies using summary statistics. PLoS Genet. 10, e1004383 (2014). - PMC - PubMed
    1. Guo H, et al. Integration of disease association and eQTL data using a Bayesian colocalisation approach highlights six candidate causal genes in immune-mediated diseases. Hum. Mol. Genet. 2015;24:3305–3313. doi: 10.1093/hmg/ddv077. - DOI - PMC - PubMed
    1. Hauberg ME, et al. Large-scale identification of common trait and disease variants affecting gene expression. Am. J. Hum. Genet. 2017;100:885–894. doi: 10.1016/j.ajhg.2017.04.016. - DOI - PMC - PubMed
    1. Hormozdiari F, et al. Colocalization of GWAS and eQTL signals detects target genes. Am. J. Hum. Genet. 2016;99:1245–1260. doi: 10.1016/j.ajhg.2016.10.003. - DOI - PMC - PubMed

Publication types

LinkOut - more resources