. 2021 Feb 3;12(1):772.
doi: 10.1038/s41467-021-21049-y.

Identification of 38 novel loci for systemic lupus erythematosus and genetic heterogeneity between ancestral groups

Affiliations

Identification of 38 novel loci for systemic lupus erythematosus and genetic heterogeneity between ancestral groups

Yong-Fei Wang et al. Nat Commun. .

Abstract

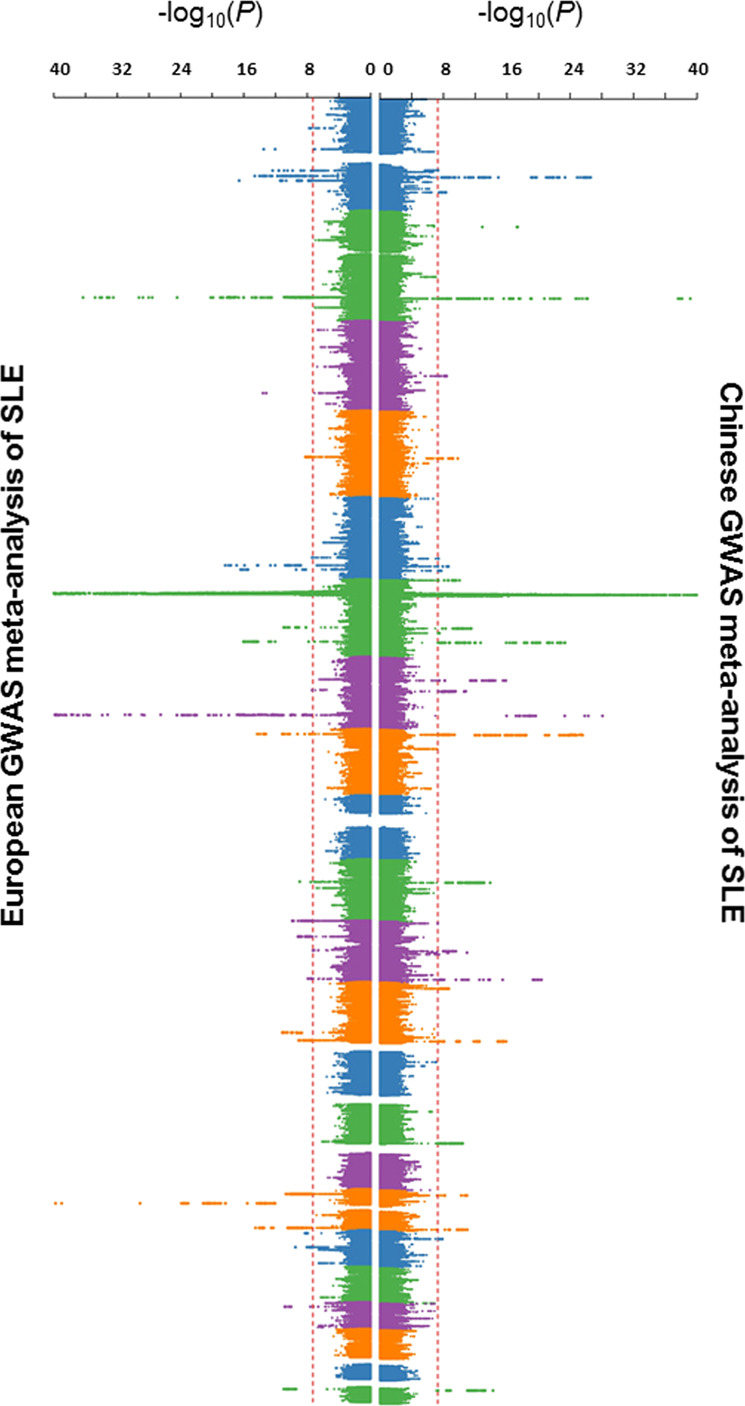
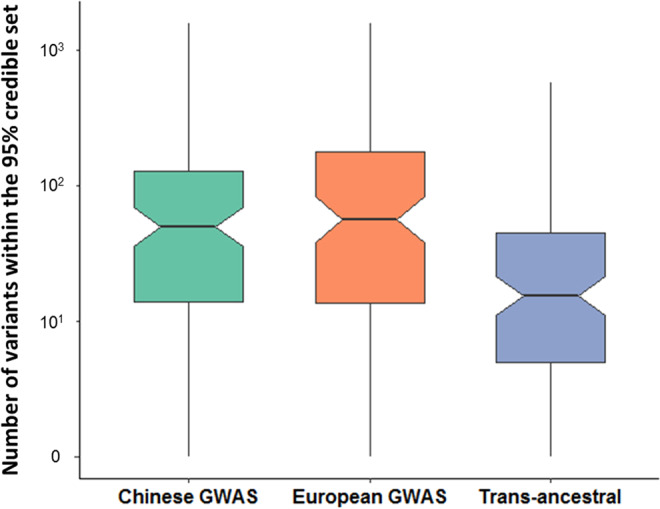
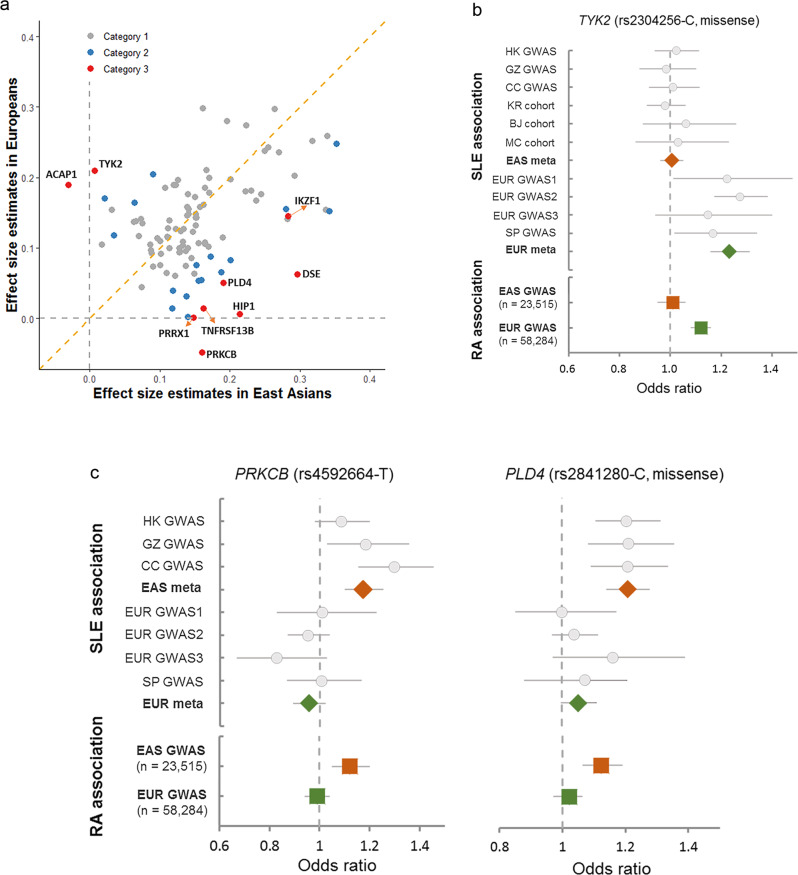
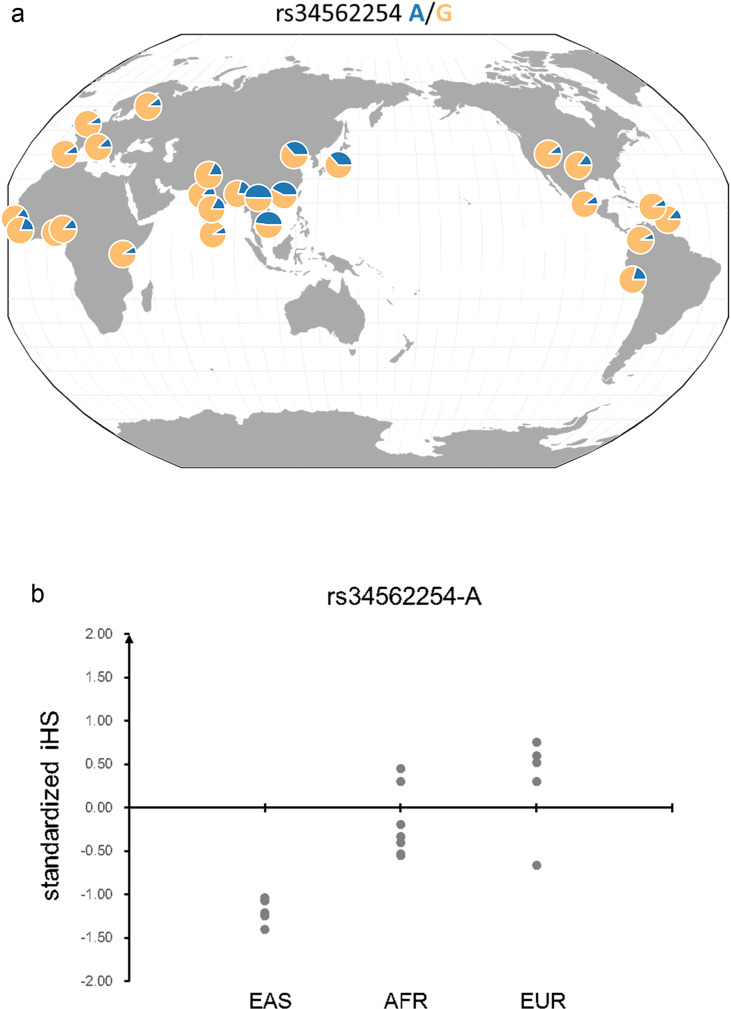
Systemic lupus erythematosus (SLE), a worldwide autoimmune disease with high heritability, shows differences in prevalence, severity and age of onset among different ancestral groups. Previous genetic studies have focused more on European populations, which appear to be the least affected. Consequently, the genetic variations that underlie the commonalities, differences and treatment options in SLE among ancestral groups have not been well elucidated. To address this, we undertake a genome-wide association study, increasing the sample size of Chinese populations to the level of existing European studies. Thirty-eight novel SLE-associated loci and incomplete sharing of genetic architecture are identified. In addition to the human leukocyte antigen (HLA) region, nine disease loci show clear ancestral differences and implicate antibody production as a potential mechanism for differences in disease manifestation. Polygenic risk scores perform significantly better when trained on ancestry-matched data sets. These analyses help to reveal the genetic basis for disparities in SLE among ancestral groups.


Conflict of interest statement

The authors declare no competing interests.

Figures

Fig. 1
Fig. 1. Manhattan plots for association results of systemic lupus erythematosus (SLE) in Chinese and European populations.
The Chinese SLE GWAS comprised 4222 cases and 8431 controls and the European GWAS comprised 4576 cases and 8039 controls. The X-axis is the P-value of association (logistic regression; additive model; two-sided test), as −log10 (P), for the meta-analyses of the Chinese (right) and European (left) ancestries. Red dashed lines indicate the threshold of genome-wide statistical significance (P = 5E − 08). SNPs with P < 1E − 40 in an associated locus are not shown from the plot.
Fig. 2
Fig. 2. Fine-mapping across 108 SLE-associated loci based on the association results from the Chinese SLE GWAS, the European GWAS, and the trans-ancestral meta-analyses.
The Y-axis indicates the number of potential causal variants at each locus based on the 95% credible sets of the association results from the Chinese SLE GWAS (green), the European GWAS (orange) and trans-ancestral meta-analyses (purple). The upper and lower bounds of the boxes represent the first and the third quartiles, respectively, and the central lines indicate the median. The two lines outside the box extend to the highest and lowest observations. N = 108 independent loci associated with SLE for each category.
Fig. 3
Fig. 3. Genetic loci showing significant ancestral differences in effect-size estimates for systemic lupus erythematosus (SLE) and rheumatoid arthritis (RA).
a Correlation of effect-size estimates for SLE between East Asian (X-axis) and European (Y-axis) populations (r = 0.58, two-sided P-value = 6.52E−11). Disease-associated variants with FDR adjusted CQ-test P-value <0.05 (category 3) are labeled in red, and the variants with CQ-test P-value < 0.05 but FDR adjusted CQ-test P-value ≥0.05 (category 2) are labeled in blue. b, c Forest plots of association from each cohort at the TYK2, PRKCB and PLD4 loci. Diamonds represent the combined estimates of odds ratio (OR) in East Asians (EAS, red) and Europeans (EUR, green) for association with SLE. Standard error bars of OR represent 95% confidence intervals of the estimates. Squares represent OR estimates for rheumatoid arthritis (RA) in EAS (red) and EUR (green) populations. Regional plots for each locus are available in Supplementary Fig. 10. HK, Hong Kong; GZ, Guangzhou; CC, Central China; KR, Korean; BJ, Beijing; MC, Malaysian Chinese; SP, Spanish.
Fig. 4
Fig. 4. Risk allele frequency and standardized integrated haplotype scores (iHS) across different populations for the Asian-specific variant at TNFRSF13B locus.
a Frequency for the risk allele rs34562254-A across populations. b Standardized iHS for the variants across different continental populations (EAS: East Asians; AFR: Africans; EUR: Europeans). The risk allele rs34562254-A is a derived allele, and negative iHS value indicates that the haplotypes carrying the derived allele are longer than the haplotypes carrying the ancestral allele. The frequency and iHS were calculated using data from the 1000 Genomes Project.
Fig. 5
Fig. 5. Performance of polygenic risk scores (PRS) calculated by summary statistics from different ancestral groups.
a Performances of PRS are indicated by area under receiver operating characteristic curve (AUC). PRS for individuals from the Guangzhou (GZ) cohort were calculated using summary statistics from ancestry-matched Chinese populations (2618 cases and 7446 controls; red) and European populations (4576 cases and 8039 controls; blue). b Distribution of PRS for SLE cases (blue) and controls (pink) from the GZ cohort. The PRS distribution was estimated using summary statistics from the ancestry-matched Chinese cohorts (upper panel) or from the mismatched European GWAS (lower panel). The optimal threshold for disease risk prediction is indicated by the red vertical line. c Odds ratios (ORs) of disease risk across different PRS groups in the GZ GWAS. The samples from GZ are equally divided into ten groups (n = 259 independent samples in each group) based on PRS estimated from ancestry-matched data. The 1st decile represents the lowest PRS group while 10th decile refers to the group of samples with the highest PRS. ORs and 95% confidence intervals (bars) for each group were calculated by reference to the 1st decile group.

Similar articles

Cited by

References

    1. Lawrence JS, Martins CL, Drake GL. A family survey of lupus-erythematosus .1. heritability. J. Rheumatol. 1987;14:913–921. - PubMed
    1. Wang J, et al. Systemic lupus erythematosus: a genetic epidemiology study of 695 patients from China. Arch. Dermatol. Res. 2007;298:485–491. doi: 10.1007/s00403-006-0719-4. - DOI - PubMed
    1. Kuo CF, et al. Familial aggregation of systemic lupus erythematosus and coaggregation of autoimmune diseases in affected families. JAMA Intern. Med. 2015;175:1518–1526. doi: 10.1001/jamainternmed.2015.3528. - DOI - PubMed
    1. Johnson AE, Gordon C, Palmer RG, Bacon PA. The prevalence and incidence of systemic lupus erythematosus in Birmingham, England. Relationship to ethnicity and country of birth. Arthritis Rheumat. 1995;38:551–558. doi: 10.1002/art.1780380415. - DOI - PubMed
    1. Danchenko N, Satia JA, Anthony MS. Epidemiology of systemic lupus erythematosus: a comparison of worldwide disease burden. Lupus. 2006;15:308–318. doi: 10.1191/0961203306lu2305xx. - DOI - PubMed

Publication types

MeSH terms