. 2021 Feb 3;12(1):770.
doi: 10.1038/s41467-021-21032-7.

A scaffold lncRNA shapes the mitosis to meiosis switch

Affiliations

A scaffold lncRNA shapes the mitosis to meiosis switch

Vedrana Andric et al. Nat Commun. .

Abstract

Long non-coding RNAs (lncRNAs) contribute to the regulation of gene expression in response to intra- or extracellular signals but the underlying molecular mechanisms remain largely unexplored. Here, we identify an uncharacterized lncRNA as a central player in shaping the meiotic gene expression program in fission yeast. We report that this regulatory RNA, termed mamRNA, scaffolds the antagonistic RNA-binding proteins Mmi1 and Mei2 to ensure their reciprocal inhibition and fine tune meiotic mRNA degradation during mitotic growth. Mechanistically, mamRNA allows Mmi1 to target Mei2 for ubiquitin-mediated downregulation, and conversely enables accumulating Mei2 to impede Mmi1 activity, thereby reinforcing the mitosis to meiosis switch. These regulations also occur within a unique Mmi1-containing nuclear body, positioning mamRNA as a spatially-confined sensor of Mei2 levels. Our results thus provide a mechanistic basis for the mutual control of gametogenesis effectors and further expand our vision of the regulatory potential of lncRNAs.


Conflict of interest statement

The authors declare no competing interests.

Figures

Fig. 1
Fig. 1. Mmi1 and Mei2 RNA-binding activities are required for their mutual control.
a Scheme summarizing the functional relationships between Mmi1 and Mei2 during mitosis and meiosis. b Domain organization of Mmi1 and Mei2 proteins. c Enrichments (% input; mean ± SD; n = 3 or 4) of act1 + , ssm4 + and mcp5 + mRNAs upon pulldown of 2xFLAG-tagged wt or mutant Mmi1. Student’s t test (two-tailed) was used to calculate p-values. Between cells expressing pREP41-2xFLAG-Mmi1 and empty vector, p = 0.01865 (act1 + ); 0.0166 (ssm4 + ); 0.01819 (mcp5 + ) (0.05 > *>0.01). d Western blots showing total TAP-tagged Mei2 levels in cells of the indicated genetic backgrounds. Anti-FLAG and anti-CDC2 antibodies were used as Mmi1 expression and loading controls, respectively. e Upper panels: ITC data obtained by injecting poly-U15 or U7GU7 RNAs to RRM3Mei2. Lower panels: Fitting of the binding curves using a single binding site model. f Crystal structure of RRM3Mei2 bound to the GCUUUUUGUUCG RNA (cyan). The classical RRM fold is shown in pink, with RNP1 and RNP2 motifs highlighted in brown and purple, respectively. The RNP1 F644 side chain is shown as sticks. The N- and C-terminal extensions are colored in green and orange, respectively. g Detailed representation of G8 binding mode. Hydrogen bonds involved in specificity for G8 are shown as red (protein–RNA interaction) or black (Hoogsteen based pairs between G8 and G12 bases) dashed lines. h Enrichments (% input; mean ± SD; n = 3 or 4) of act1 + mRNAs and meiRNA upon pulldown of TAP-tagged wt or mutant (Mei2-F644A) Mei2. Student’s t test (two-tailed) was used to calculate p-values. Between cells expressing pREP41-TAP-Mei2 and empty vector, p = 4.32 × 10−7 (meiRNA) (***<0.001). i Western blots showing total levels of 2xFLAG-tagged wt or mutant Mei2. Serial dilutions of the mutant extract are shown for comparison with wild type. Anti-CDC2 antibody was used as loading control. j RT-qPCR analyses of mei4 + , ssm4 + and mcp5 + meiotic mRNA levels (mean ± SD; n = 4; normalized to act1 + and relative to wt) in cells of the indicated genetic backgrounds. Student’s t test (two-tailed) was used to calculate p-values. Between mot2∆ mei2∆ cells expressing pREP42X-Mei2-2xFLAG and pREP42X-Mei2-F644A-2xFLAG, p = 0.02219 (mei4 + ) (0.05 > *>0.01); 0.00035 (ssm4 + ) (***<0.001); 0.00338 (mcp5 + ) (0.01 > **>0.001). c, h, j Individual data points are represented by red circles.
Fig. 2
Fig. 2. Identification of mamRNA, an Mmi1 and Mei2-scaffolding lncRNA.
a SeqRIP-seq plot showing the enrichments (log10 IP/WCE) of transcripts pulled-down in the double-tagged strain of interest (y axis) as a function of their abundance (log10) (x axis) (n = 2). Red dots correspond to RNAs among the 100 most enriched and 100 most abundant features. Cells expressing TAP- or GFP-tagged Mmi1 and 3xFLAG-tagged Mei2 under the control of the mild nmt41 and strong nmt1 promoters, respectively, were used for immunoprecipitations (strain of interest: Pnmt41-TAP-Mmi1 Pnmt1-3xFLAG-Mei2; negative control: Pnmt41-GFP-Mmi1 Pnmt1-3xFLAG-Mei2). IP: Immunoprecipitate, WCE: Whole Cell Extract. b Northern blot showing mamRNA levels from total RNA samples and fractions enriched (polyA + ) or depleted (polyA-) for polyadenylated species, in the indicated genetic backgrounds. Enrichment and depletion of polyadenylated RNAs were verified by probing adh1 + mRNAs and snoU3B, respectively. Ribosomal RNAs serve as a loading control. c Scheme depicting the chromosomal loci encoding the mamRNA, omt3, and meiRNA lncRNAs with the number and position of Mmi1 (magenta) and putative non-overlapping Mei2 (blue) binding motifs. mamRNA and meiRNA isoforms are shown in green below the corresponding loci. The regions of Mmi1 and Mei2 binding to meiRNA are indicated. d Representative images of mamRNA detected by smFISH in wt and mamRNA∆ mitotic cells. DNA was stained with DAPI. Images are shown as maximum-intensity projections of Z-stacks. Distinct contrast adjustments are shown to visualize mamRNA subcellular localization. White arrows point to cytoplasmic spots. The white scale bar represents 5 µm. e mamRNA signal intensities (integrated densities relative to nucleoplasmic average; mean ± SD; n = 50 cells) quantified from d in the indicated areas. f, g Enrichments (% input; mean ± SD; n = 3 or 4) of meiRNA, mamRNA and omt3 lncRNAs upon pulldown of wt or mutant 2xFLAG-tagged Mmi1 (f) and TAP-tagged Mei2 (g). Student’s t test (two-tailed) was used to calculate p-values. Between cells expressing pREP41-2xFLAG-Mmi1 and pREP41-2xFLAG-Mmi1-Y352F or Y466F (f), p = 0.00641 or 0.00663 (mamRNA) (0.01 > **>0.001); 0.03981 or 0.04065 (omt3) (0.05 > *>0.01). Between cells expressing pREP41-TAP-Mei2 and pREP41-TAP-Mei2-F644A (g), p = 0.00608 (mamRNA); 0.00916 (omt3) (0.01 > **>0.001). e, f, g Individual data points are represented by red circles.
Fig. 3
Fig. 3. mamRNA mediates the Mmi1–Mei2 mutual control.
a, b Western blots showing total TAP-tagged Mei2 levels in cells of the indicated genetic backgrounds. Anti-CDC2 antibody was used as loading control. In b, mamRNA or snoU14 were integrated at the leu1 + locus. c RT-qPCR analyses of mei4 + , ssm4 + and mcp5 + meiotic mRNA levels in cells of the indicated genetic backgrounds (mean ± SD; n = 4 or 5; normalized to act1 + and relative to wt). Student’s t test (two-tailed) was used to calculate p-values. Between mot2∆ and mot2∆ mamRNA∆ cells, p = 0.00008 (mei4 + ); 0.00011 (ssm4 + ); 1.08 × 10−6 (mcp5 + ) (***<0.001). Individual data points are represented by red circles. d Comparison of wt, mot2∆, mamRNA∆ and mot2∆ mamRNA∆ transcriptomes by RNA-sequencing (n = 2). Box plots showing the fold enrichment (log2) of RNAs in mutants relative to wt. Left: analysis of 60 transcripts regulated by Mmi1 as defined in ref. (cluster 1); Middle: analysis of 60 random transcripts; Right: analysis of all transcripts identified. Box center lines represent the median, box limits represent the upper and lower quartiles, whiskers define the 1.5x interquartile range and individual points correspond to outliers. An Anova test was used to calculate p-values. Between mot2∆ and mamRNA∆, p = 0.00046 (***<0.001). Between mot2∆ and mot2∆ mamRNA∆, p = 0.00026 (***<0.001). NS: not significant. e Mating/sporulation efficiencies of the indicated homothallic strains (% tetrads; nmeiRNA∆ pREP41-GFP-Mei2 = 699 cells; nmeiRNA∆ pREP41-GFP-Mei2-NLS = 579; nmeiRNA∆ mamRNA∆ pREP41-GFP-Mei2-NLS = 674), as determined by iodine staining and live cell imaging. Red arrows point to tetrads. A Fisher exact test (two-sided) was used to calculate the p-value. p = 1.1517 × 10−7 (***<0.001). The white scale bar represents 10 µm.
Fig. 4
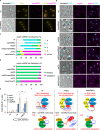
Fig. 4. Subcellular localization of Mmi1, mamRNA and meiotic mRNAs.
a, b Representative images of mamRNA (a) or mcp5 + mRNAs (b) detected by smFISH in cells of the indicated genetic backgrounds. DNA was stained with DAPI. In a, GFP-tagged Mmi1 was visualized in parallel. Images are shown as maximum-intensity projections of Z-stacks. White scale bars represent 5 µm. c, d Quantifications of smFISH analyses shown in b. c Distribution of mcp5 + mRNA foci frequency per cell (nwt = 1003 cells; nmamRNA∆ = 577; nmot2∆ = 824; nmot2∆mamRNA∆ = 240; nred1∆ = 839; nmei4∆mmi1∆ = 469). d Distribution of mcp5 + mRNA foci localization (nwt = 872 foci; nmamRNA∆ = 469; nmot2∆ = 1166; nmot2∆mamRNA∆ = 219; nred1∆ = 939; nmei4∆mmi1∆ = 1181). e Enrichments (% input; mean ± SD; n = 4) of act1 + , mei4 + , mcp5 + mRNAs and meiRNA upon pulldown of 2xFLAG-tagged Mmi1 in wt and mot2∆ cells. Student’s t test (two-tailed) was used to calculate p-values. Between Pnm41-3xFLAG-Mmi1 and mot2∆ Pnm41-3xFLAG-Mmi1, p = 0.02936 (mei4 + ) (0.05 > *>0.01); 0.62718 (mcp5 + ); 0.17136 (meiRNA). NS: not significant. Individual data points are represented by red circles. f Model depicting the role of mamRNA in the Mmi1–Mei2 mutual control in mitotic cells. In wt cells, Mmi1 binds to mamRNA to target Mei2 for downregulation by Mot2, which occurs in an Mmi1-containing nuclear body likely overlapping the mamRNA transcription site. This is required for efficient meiotic mRNA degradation by Mmi1, the Red1-containing MTREC complex and the nuclear exosome. In the absence of Mot2, increased Mei2 levels lead to meiotic mRNA accumulation in a mamRNA-dependent manner. Mmi1 inactivation occurs downstream of target recognition and nuclear retention. In mamRNA∆ cells, the Mmi1–Mei2 mutual control is abolished: Mei2 cannot be targeted to Mot2 but Mmi1 function in meiotic mRNA degradation is preserved.

Similar articles

Cited by

References

    1. Yao RW, Wang Y, Chen LL. Cellular functions of long noncoding RNAs. Nat. Cell Biol. 2019;21:542–551. doi: 10.1038/s41556-019-0311-8. - DOI - PubMed
    1. Wapinski O, Chang HY. Long noncoding RNAs and human disease. Trends Cell Biol. 2011;21:354–361. doi: 10.1016/j.tcb.2011.04.001. - DOI - PubMed
    1. Schmitz SU, Grote P, Herrmann BG. Mechanisms of long noncoding RNA function in development and disease. Cell Mol. Life Sci. 2016;73:2491–2509. doi: 10.1007/s00018-016-2174-5. - DOI - PMC - PubMed
    1. Yamamoto M. The selective elimination of messenger RNA underlies the mitosis-meiosis switch in fission yeast. Proc. Jpn. Acad. Ser. B Phys. Biol. Sci. 2010;86:788–797. doi: 10.2183/pjab.86.788. - DOI - PMC - PubMed
    1. Mata J, Wilbrey A, Bähler J. Transcriptional regulatory network for sexual differenciation in fission yeast. Genome Biol. 2007;8:R217. doi: 10.1186/gb-2007-8-10-r217. - DOI - PMC - PubMed

Publication types

MeSH terms