. 2021 Feb 3;12(1):777.
doi: 10.1038/s41467-021-21100-y.

The natural history of symptomatic COVID-19 during the first wave in Catalonia

Affiliations

The natural history of symptomatic COVID-19 during the first wave in Catalonia

Edward Burn et al. Nat Commun. .

Abstract

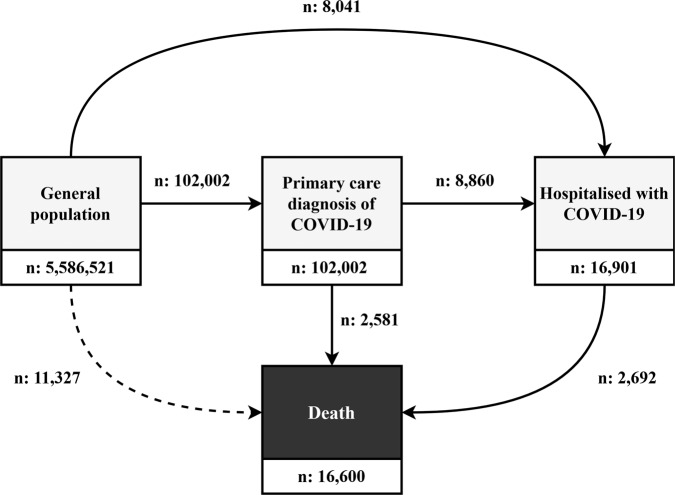
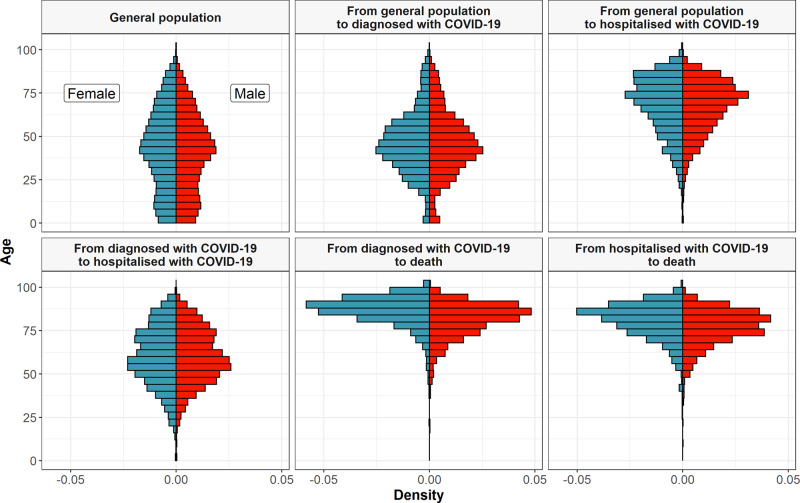
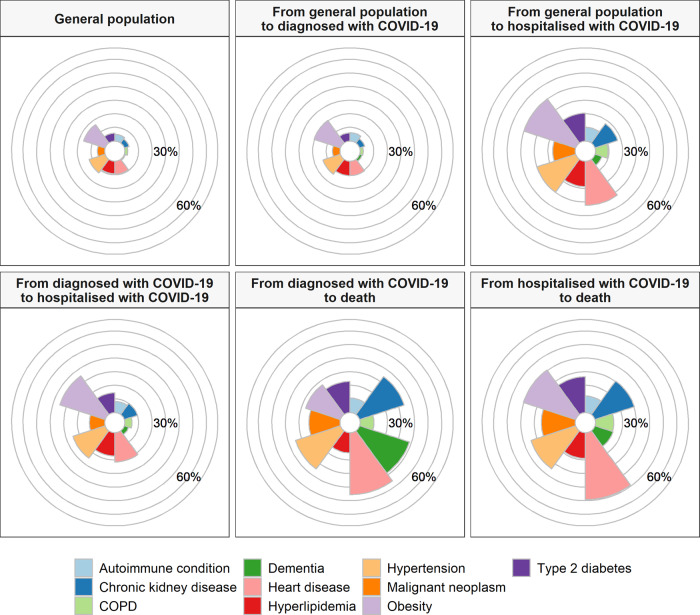
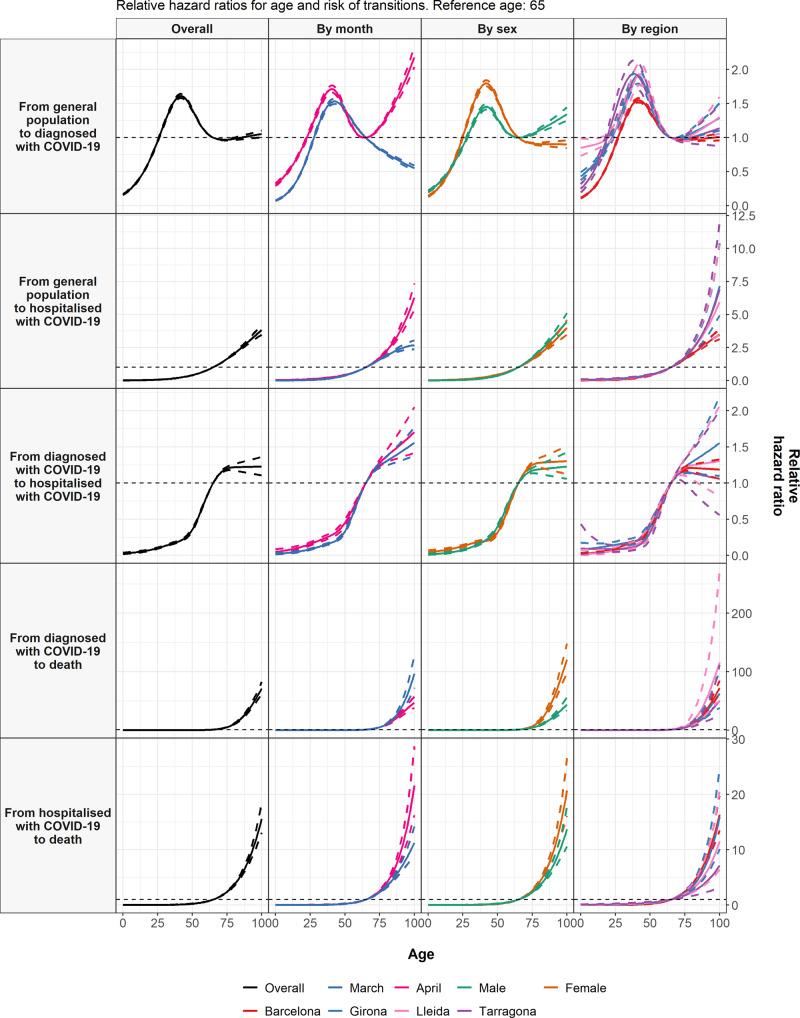
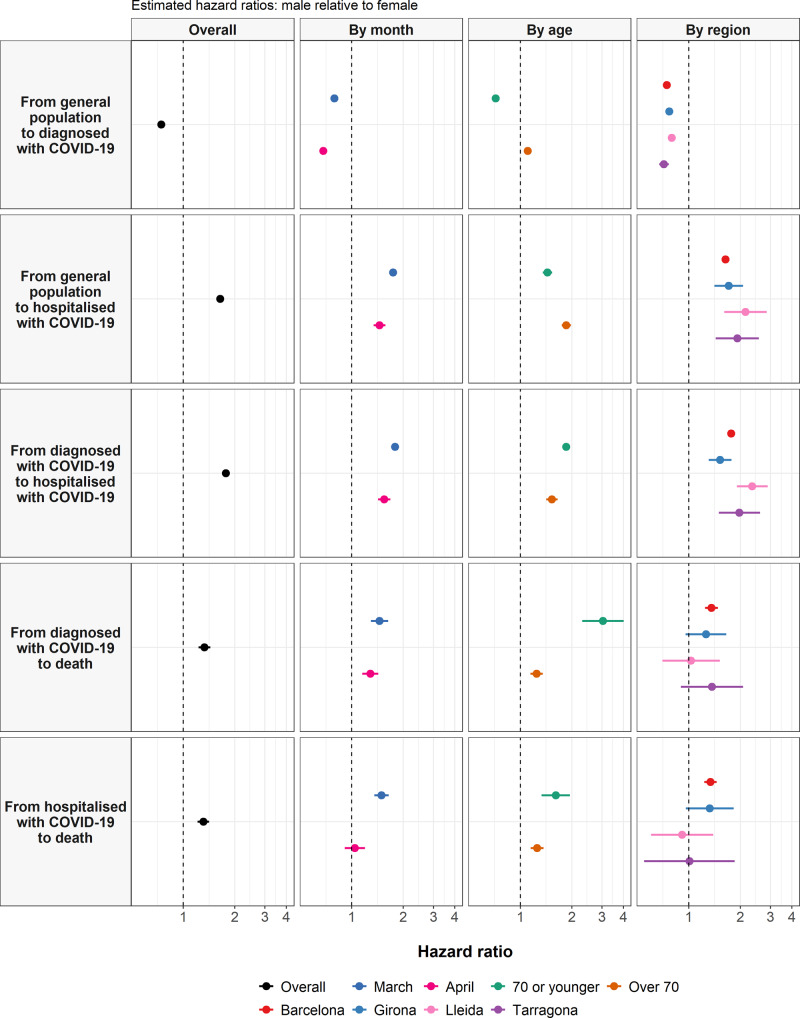
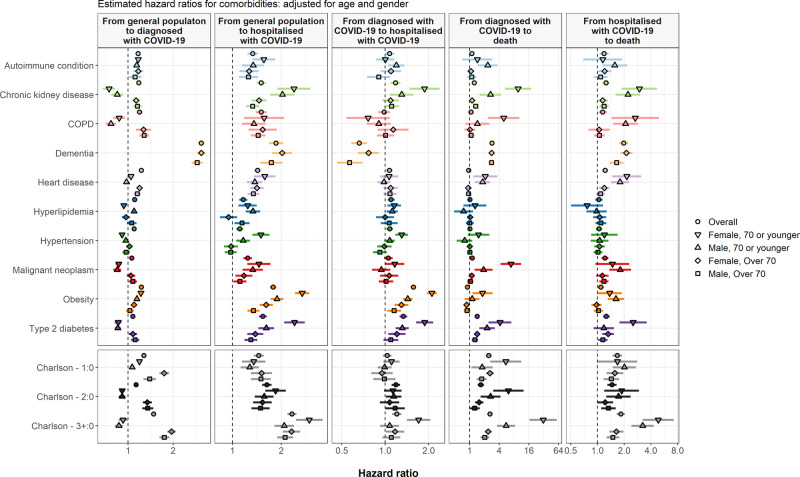
The natural history of coronavirus disease 2019 (COVID-19) has yet to be fully described. Here, we use patient-level data from the Information System for Research in Primary Care (SIDIAP) to summarise COVID-19 outcomes in Catalonia, Spain. We included 5,586,521 individuals from the general population. Of these, 102,002 had an outpatient diagnosis of COVID-19, 16,901 were hospitalised with COVID-19, and 5273 died after either being diagnosed or hospitalised with COVID-19 between 1st March and 6th May 2020. Older age, being male, and having comorbidities were all generally associated with worse outcomes. These findings demonstrate the continued need to protect those at high risk of poor outcomes, particularly older people, from COVID-19 and provide appropriate care for those who develop symptomatic disease. While risks of hospitalisation and death were lower for younger populations, there is a need to limit their role in community transmission.


Conflict of interest statement

D.P.A. reports grants and other from AMGEN; grants, non-financial support and other from UCB Biopharma; grants from Les Laboratoires Servier, outside the submitted work; and Janssen, on behalf of IMI-funded EHDEN and EMIF consortiums, and Synapse Management Partners have supported training programmes organised by DPA’s department and open for external participants. C.T. reports personal fees from Amgen, Boehringer ingelheim outside the submitted work. No other relationships or activities that could appear to have influenced the submitted work. All other authors declare no competing interests.

Figures

Fig. 1
Fig. 1. Multi-state model of COVID-19.
The entire study population began in the general population state as of the 1st March 2020, with progression through the model possible up to 6th May 2020.
Fig. 2
Fig. 2. Histogram of age, by sex, for the study population and by transition in the multistate model.
The ages, split by sex, of the study population as a whole (general population) and of those individuals making transition from general population to diagnosed with COVID-19 and hospitalised with COVID-19, from diagnosed with COVID-19 to hospitalised with COVID-19 and death, and from hospitalised with COVID-19 to death.
Fig. 3
Fig. 3. Prevalence of comorbidities among the general population and by transition in the multistate model.
The proportion of the study population as a whole (general population) with a comorbidity of interest, and of those individuals making transition from general population to diagnosed with COVID-19 and hospitalised with COVID-19, from diagnosed with COVID-19 to hospitalised with COVID-19 and death, and from hospitalised with COVID-19 to death. COPD chronic obstructive pulmonary disease.
Fig. 4
Fig. 4. Age and COVID-19 transitions.
Estimated hazard ratios for age (relative to a reference age of 65) from cause-specific Cox models for each transition. Dotted lines represent 95% confidence intervals. The models shown included age as the only explanatory variable, with the overall models and models stratified by calendar month, sex, and region presented.
Fig. 5
Fig. 5. Sex and COVID-19 transitions.
Estimated hazard ratios for male sex (relative to female) from cause-specific Cox models for each transition. Points give estimated hazard ratios, with lines representing 95% confidence intervals. The models shown included sex and age as explanatory variables, with the overall models and models stratified by calendar month, sex, and region presented.
Fig. 6
Fig. 6. Comorbidities and COVID-19 transitions.
Estimated hazard ratios for comorbidities of interest from cause-specific Cox models for each transition. Points give estimated hazard ratios, with lines representing 95% confidence intervals. Models were estimated separately for each comorbidity of interest, with adjustment for age and sex. COPD chronic obstructive pulmonary disease.

References

    1. Zhou F, et al. Clinical course and risk factors for mortality of adult inpatients with COVID-19 in Wuhan, China: a retrospective cohort study. Lancet. 2020;395:1054–1062. doi: 10.1016/S0140-6736(20)30566-3. - DOI - PMC - PubMed
    1. Docherty AB, et al. Features of 20 133 UK patients in hospital with covid-19 using the ISARIC WHO Clinical Characterisation Protocol: prospective observational cohort study. BMJ. 2020;369:m1985. doi: 10.1136/bmj.m1985. - DOI - PMC - PubMed
    1. Petrilli CM, et al. Factors associated with hospital admission and critical illness among 5279 people with coronavirus disease 2019 in New York City: prospective cohort study. BMJ. 2020;369:m1966. doi: 10.1136/bmj.m1966. - DOI - PMC - PubMed
    1. Reilev, M. et al. Characteristics and predictors of hospitalization and death in the first 11 122 cases with a positive RT-PCR test for SARS-CoV-2 in Denmark: a nationwide cohort. Int. J. Epidemiol.10.1093/ije/dyaa140 (2020). - PMC - PubMed
    1. Griffith GJ, et al. Collider bias undermines our understanding of COVID-19 disease risk and severity. Nat. Commun. 2020;11:5749. doi: 10.1038/s41467-020-19478-2. - DOI - PMC - PubMed

Publication types