. 2021 Feb 3;12(1):773.
doi: 10.1038/s41467-021-21066-x.

High-throughput phenotypic screen and transcriptional analysis identify new compounds and targets for macrophage reprogramming

Affiliations

High-throughput phenotypic screen and transcriptional analysis identify new compounds and targets for macrophage reprogramming

Guangan Hu et al. Nat Commun. .

Abstract

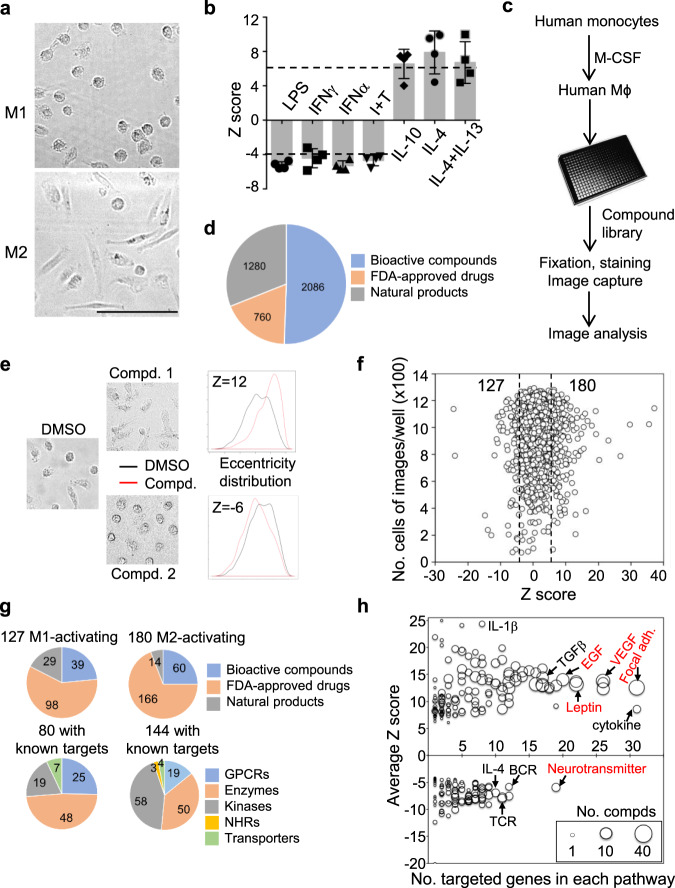
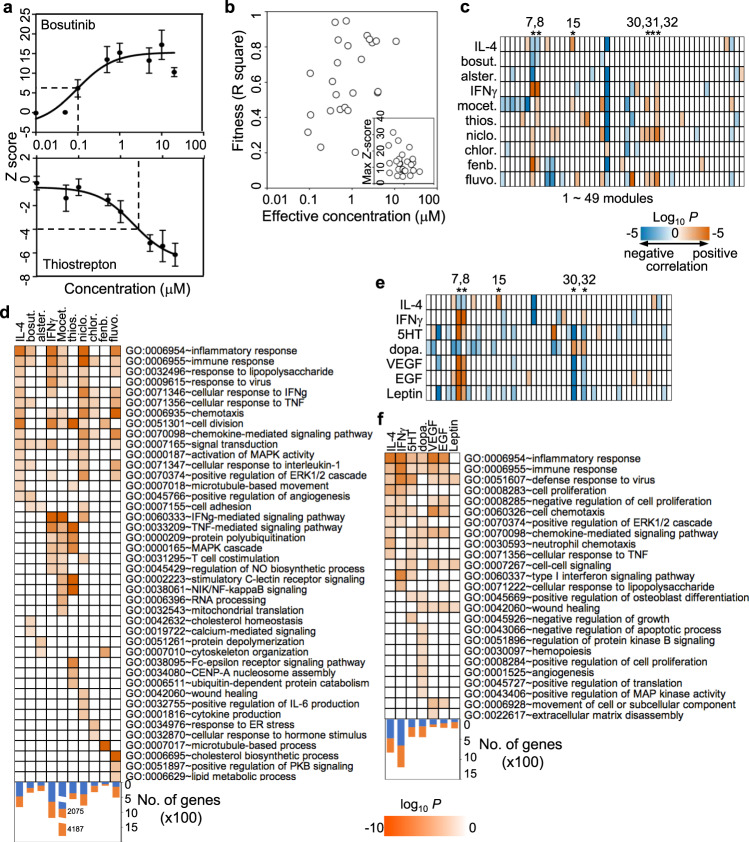
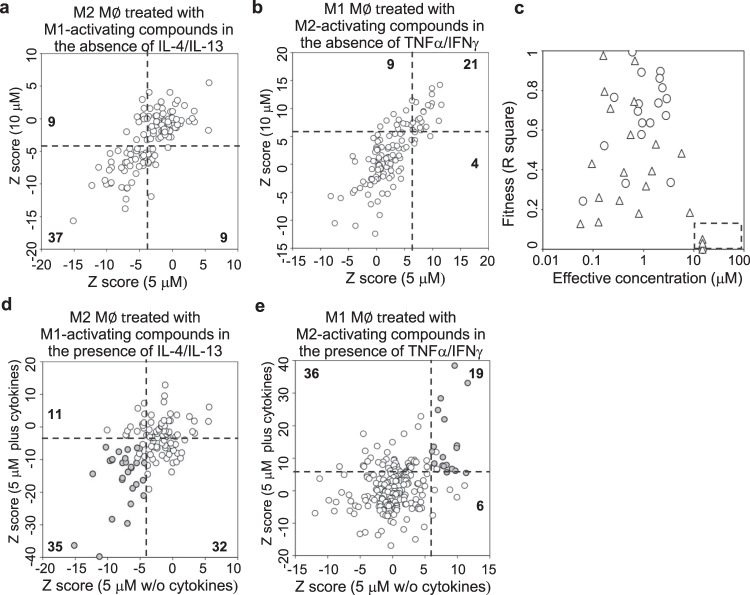
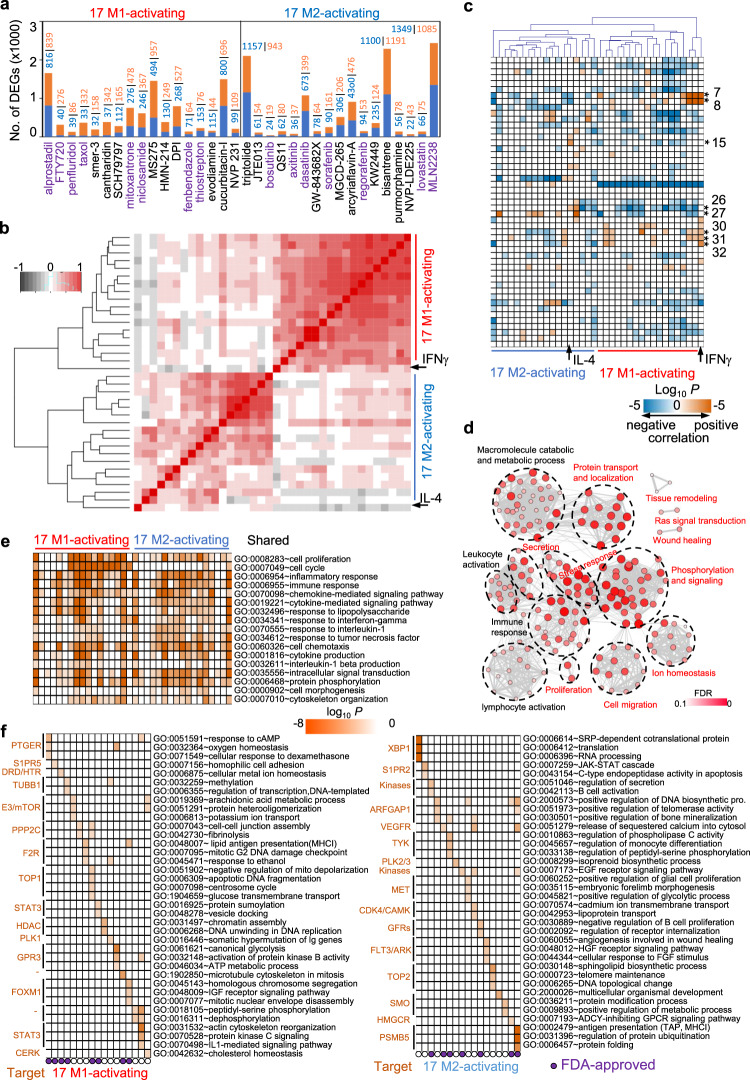
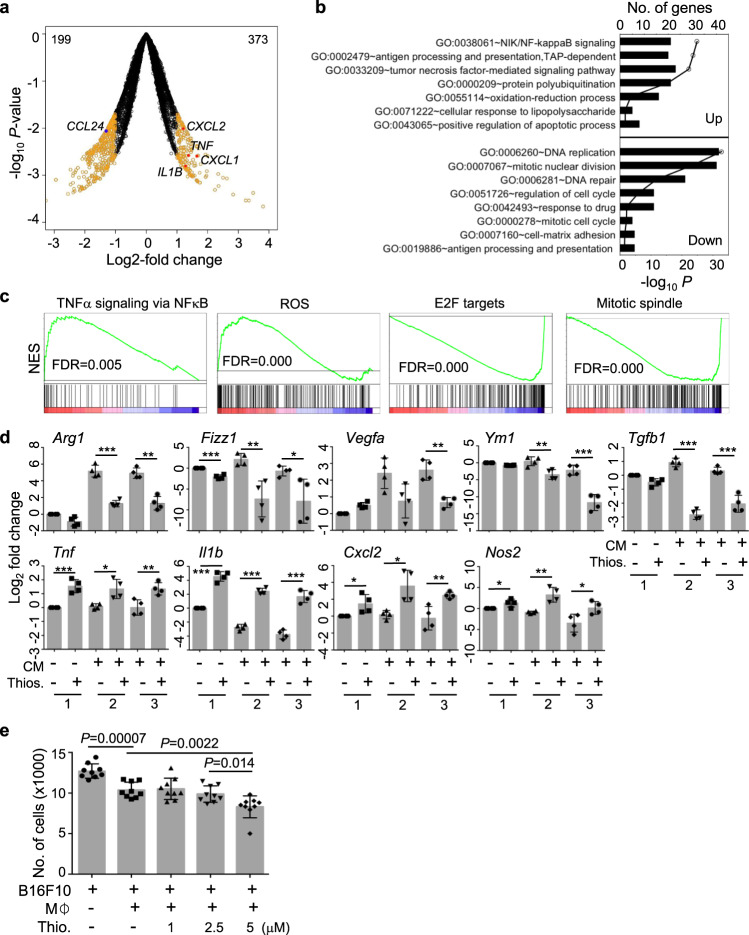
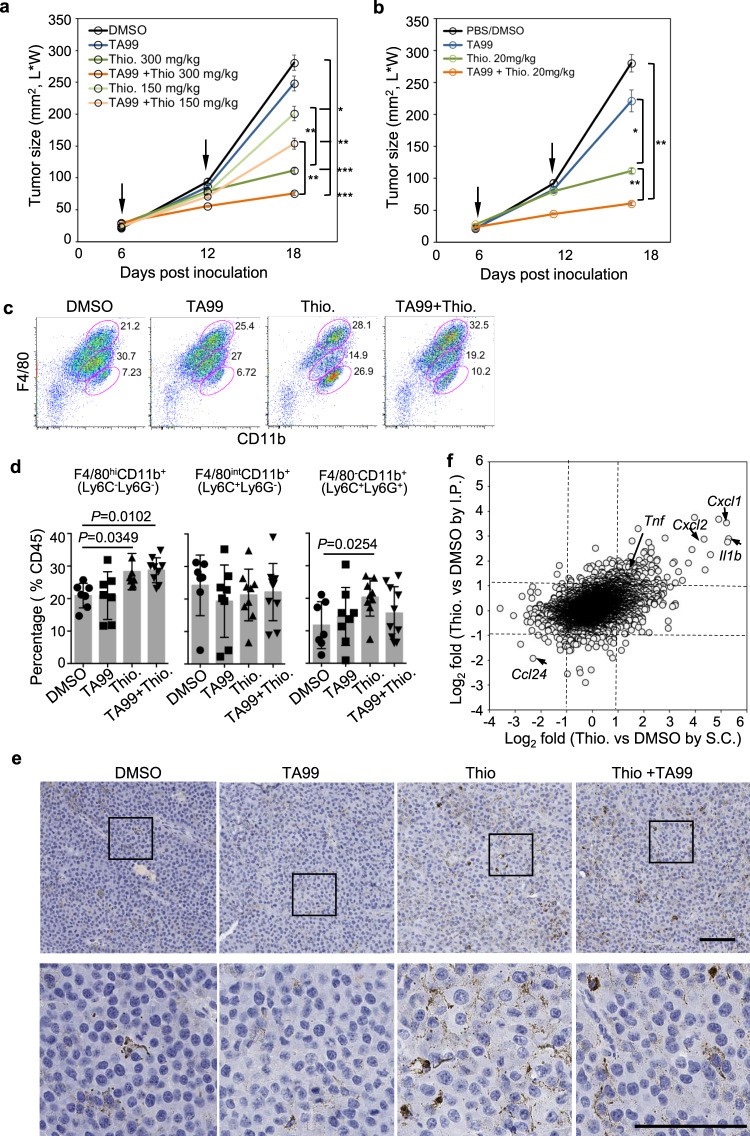
Macrophages are plastic and, in response to different local stimuli, can polarize toward multi-dimensional spectrum of phenotypes, including the pro-inflammatory M1-like and the anti-inflammatory M2-like states. Using a high-throughput phenotypic screen in a library of ~4000 FDA-approved drugs, bioactive compounds and natural products, we find ~300 compounds that potently activate primary human macrophages toward either M1-like or M2-like state, of which ~30 are capable of reprogramming M1-like macrophages toward M2-like state and another ~20 for the reverse repolarization. Transcriptional analyses of macrophages treated with 34 non-redundant compounds identify both shared and unique targets and pathways through which the tested compounds modulate macrophage activation. One M1-activating compound, thiostrepton, is able to reprogram tumor-associated macrophages toward M1-like state in mice, and exhibit potent anti-tumor activity. Our compound-screening results thus help to provide a valuable resource not only for studying the macrophage biology but also for developing therapeutics through modulating macrophage activation.


Conflict of interest statement

J. Chen and G.H. (inventors) declare that a provisional patent application related to this work has been filed with the United States Patent and Trademark Office on September 21, 2020. The other authors declare no competing interest.

Figures

Fig. 1
Fig. 1. A high-throughput screen for compounds that activate human macrophages.
a, b hMDMs were cultured for 24 h in the presence of LPS, IFNγ, TNFα, IFNγ plus TNFα (Ι+Τ), IL-10, IL-4, or IL-13. Shown are examples of cell morphologies of M1-activated macrophages by IFNγ and M2-activated macrophages by IL-4 (a) from three independent experiments and calculated Z-scores for each stimulus (b) from four independent experiments. Scale bar: 100 μm. Data are presented as mean ± sd. The Z-score was calculated by T-test to measure the difference of cell morphology between treatment and control. Stimuli had negative Z-scores when induced cells to round morphology and positive scores when induced cells to elongated morphology. c The flowchart of high-throughput screen and data analysis. Equally mixed human monocytes isolated from fresh blood of four healthy donors were cultured in vitro with 50 ng/mL M-CSF for 7 days. hMDMs were trypsinized and plated on 384-well plates (5000 cells/well in 50 μL). Cells were recovered in 10 ng/mL M-CSF for 16 h and then treated with compounds for 24 h. Cells were washed, fixed, and stained with phalloidin and DAPI. The plates were scanned with a high-content microscope with six fields per well to quantify the cell number and cell morphology. d Composition of compound libraries used in the screen. e Examples of cell shape changes induced by two compounds and their corresponding Z-scores as compared to DMSO controls. The cell eccentricity was calculated to measure the cell morphology. The Z-score was calculated by T-test to measure the difference in cell morphologies between each compound and DMSO control. f Plot of Z-scores of 4126 compounds and number of cells captured in each well. The dash lines are the cutoffs for M1 activation (left) and M2 activation (right) based on the average of Z-scores from b. g Classification of identified compounds based on their origin and function of their known targets. h Pathway analysis of known targets of identified M1- or M2-activating compounds. Each dot is one specific pathway having protein targets by compounds and dot size refer to the number of compounds. The average Z-score (y-axis) and number of compounds that have protein targets belongs to one specific pathway are plotted. Selected known (black) and new (red) pathways associated with macrophage activation are indicated.
Fig. 2
Fig. 2. Validation of macrophage activation induced by compounds or by ligands of the identified new pathways.
a, b Morphology changes induced by selected compounds are dosage dependent. Dosage responses were calculated based on the measurement of Z-scores at different concentrations of the compound in a Michaelis–Menten model. Shown are dosage response curves of M1-activating (thiostrepton, n = 6) and M2-activating (bosutinib, n = 4) compounds (a). Data are presented as mean ± sem. Overall, 25 of the 30 tested compounds had typical dosage-dependent response (b). Effective concentration (EC) was defined as the concentration of compounds inducing cell morphology changes to reach the cutoffs of either M1 or M2. EC, fitness (R2), and max Z-score were calculated by the Michaelis–Menten equation. Data were summarized from three independent experiments. c GSEA of transcriptional responses to eight selected compounds and controls (IL-4 and IFNγ). Duplicate hMDM samples were treated with two M2-activating and six M1-activating compounds as well as IL-4 and IFNγ for 24 h. Gene expression levels were measured by RNA-seq separately. GSEA preranked analysis was performed based on the whole genome gene list ranked on gene expression changes using a gene set of 49 transcriptional modules in response to 29 stimuli in hMDMs. bosut.: bosutinib, alster.: alsterpaullone, mocet.: mocetinostat; thios.: thiostrepton, niclo.: niclosamide, chlor.: chlorhexidine, fenb.: fenbendazole, fluvo.: fluvoxamine. The numerical numbers at the top indicate module numbers identified by Xu et al.. d GO enrichment analysis of DEGs induced by each compound and positive controls. The numbers of DEGs that are upregulated (orange) and downregulated (blue) are indicated. e GSEA of transcriptional responses to six ligands of the identified new pathways in Fig. 1h. dopa.: dopamine, 5HT: serotonin. Duplicate hMDM samples were stimulated with each ligand and analyzed by RNA-seq separately. f GO enrichment analysis of DEGs induced by the ligands and positive controls. The numbers of DEGs that are upregulated (orange) and downregulated (blue) are indicated.
Fig. 3
Fig. 3. Reprogramming screen of compounds on differentiated macrophages.
a hMDMs were differentiated into M2 by IL-4 plus IL-13 and then treated with each of the 127 identified M1-activating compounds at either 5 or 10 μM for 24 h in the absence of differentiating cytokines. Shown are comparisons of Z-scores between 5 and 10 μM of compounds. b hMDMs were differentiated into M1 by IFNγ plus TNFα and then treated with each of the 180 identified M2-activating compounds at either 5 or 10 μM for 24 h in the absence of differentiating cytokines. Shown are comparison of Z-scores between 5 and 10 μM of compounds. c The effective concentration of 40 selected M1- or M2-activating compounds calculated from the dosage assays. EC and fitness of 21 M1-activating (triangle) and 19 M2-activating compounds (circle) were calculated by the Michaelis–Menten equation and plotted. Data were summarized from three independent experiments. de hMDMs were differentiated into either M2 by IL-4 plus IL-13 or M1 by IFNγ plus TNFα and then treated with 127 M1-activating (d) or 180 M2-activating (e) compounds for 24 h in the presence of differentiating cytokines. Filled dots show identification of the same 37 M1-activating (a) and 21 M2-activating (b) compounds.
Fig. 4
Fig. 4. Reprogramming of differentiated macrophages by selected compounds.
a Number of DEGs induced by each compound. Orange: upregulated genes. Blue: downregulated genes. Compounds labeled in purple are FDA-approved drugs. hMDMs were differentiated into either M2 by IL-4 plus IL-13 or M1 by IFNγ plus TNFα and duplicate samples were then treated with either M1-activating or M2-activating compounds, respectively, at the effective concentrations. Controls include two differentiated M1 and M2 macrophages, M2 macrophages treated with IFNγ and M1 macrophages treated with IL-4. Gene expression in each sample was measured by RNA-seq separately. b Hierarchical clustering heatmap of Pearson correlation coefficients for 7620 DEGs induced by compounds as well as IFNγ and IL-4. c GSEA analysis of transcriptional responses to each compound as compared to IFNγ and IL-4. The numerical numbers on the right indicate module numbers identified by Xu et al.. d Network of GO enriched terms using BiNGO on top 10% central hubs genes (n = 1255) of macrophage activation network. Node color and size represent the FDR values of enriched GO terms. New pathways identified in this study are labeled in red. e, f Functional enrichment analysis of DEGs induced by each compound. Shared (e) and unique pathways (f) are shown. Compound targets and FDA-approval information are indicated. The order of M1-activating and M2-activarting compounds in e and f are the same as in a.
Fig. 5
Fig. 5. Thiostrepton induces macrophages into proinflammatory state and enhances antitumor activity in vitro.
a Volcano plot showing changes in transcription in hMDMs induced by thiostrepton (n = 2). hMDMs were treated with 2.5 μM thiostrepton for 24 h followed by RNA-seq. DEGs (orange) were identified by edgeR at P < 0.05 with at least two fold-change. Data for genes that were not classified as differentially expressed are plotted in black. Filled dots show upregulated (red) and downregulated (blue) genes. b GO enrichment analysis of DEGs induced by thiostrepton. c GSEA of transcriptional response to thiostrepton. d Thiostrepton inhibits the development and function of TAMs in vitro. Mouse BMMs were cultured in normal medium with or without 2.5 μM thiostrepton for 24 h (group 1), or cultured in B16F10 tumor cell conditioned medium (CM) with or without 2.5 μM thiostrepton for 24 h (group 2), or cultured with B16F10 tumor cell CM for 24 h first and then treated with 2.5 μM thiostrepton for another 24 h (group 3). The transcript levels of the indicated genes were quantified by qPCR. Data are presented as mean ± sd from four independent samples per group in two independent experiments. *P < 0.05, **P < 0.01 and ***P < 0.001 by two-sided T-test between untreated and treated groups are indicated. e Thiostrepton enhances antitumor activities of macrophages. Mouse BMMs were cultured with or without thiostrepton for 24 h, and then cocultured with equal number of B16F10 melanoma cells for 12 h. The number of tumor cells was quantified by flow cytometry after subtracting macrophages from total number of cells. Data are presented as mean ± sd from three independent experiments. P values by two-sided T-test are indicated.
Fig. 6
Fig. 6. Thiostrepton exhibits antitumor activities through reprogramming tumor-associated macrophages in vivo.
a Tumor growth curves in B6 mice bearing subcutaneous B16F10 tumors treated I.P. with DMSO, TA99, thiostrepton (150 or 300 mg/kg), and thiostrepton plus TA99 (n = 6–13 mice per group). b Tumor growth curves in B6 mice bearing subcutaneous B16F10 tumors treated I.P. with TA99, and S.C. with PBS or DMSO or thiostrepton (20 mg/kg) or thiostrepton plus TA99 (n = 9–11 mice per group). In a and b, arrows indicate dosing time points and data are presented as mean ± sem. *P < 0.05, **P < 0.01 and ***P < 0.001 by two-sided T-test are indicated. c, d Flow cytometry analysis of TAM (F4/80+CD11b+Ly6CLy6G), inflammatory monocytes (F4/80intCD11b+Ly6C+Ly6G) and monocytes (F4/80CD11b+Ly6C+Ly6G+) in the tumors from control, TA99-treated, thiostrepton-treated and thiostrepton plus TA99-treated tumor-bearing mice 18 days after tumor engraftment. Shown are representative F4/80 versus CD11b staining profiles gating on CD45+ cells (c) and summarized data (mean ± sd) (d) from three independent experiments (n = 7–10 per group). e Representative immunohistochemistry staining with anti-F4/80 in tumor sections. The bottom panels are the enlargement of marked areas from the top panels. Brown: anti-F4/80 stain; blue: nuclear stain. Scale bar: 100 μm. Shown are representative staining from one mouse per group in a. f Comparison of gene expression changes induced by thiostrepton in tumor-infiltrating macrophages from individual mice following I.P. (n = 4) or S.C. administration (n = 2) of thiostrepton or DMSO (n = 2). Tumor infiltrated macrophages were sorted separately from tumor tissues of each mouse based on CD45+F4/80+CD11b+Gr-1 18 days after tumor engraftment, followed by separate RNA-seq. I.P. intraperitoneal injection, S.C. paratumor subcutaneous injection.

References

    1. Wynn TA, Chawla A, Pollard JW. Macrophage biology in development, homeostasis and disease. Nature. 2013;496:445–455. doi: 10.1038/nature12034. - DOI - PMC - PubMed
    1. Ginhoux F, Schultze JL, Murray PJ, Ochando J, Biswas SK. New insights into the multidimensional concept of macrophage ontogeny, activation and function. Nat. Immunol. 2016;17:34–40. doi: 10.1038/ni.3324. - DOI - PubMed
    1. Okabe Y, Medzhitov R. Tissue biology perspective on macrophages. Nat. Immunol. 2016;17:9–17. doi: 10.1038/ni.3320. - DOI - PubMed
    1. Mosser DM, Edwards JP. Exploring the full spectrum of macrophage activation. Nat. Rev. Immunol. 2008;8:958–969. doi: 10.1038/nri2448. - DOI - PMC - PubMed
    1. Sica A, Erreni M, Allavena P, Porta C. Macrophage polarization in pathology. Cell. Mol. Life Sci. 2015;72:4111–4126. doi: 10.1007/s00018-015-1995-y. - DOI - PMC - PubMed

Publication types

MeSH terms