Observational Study
. 2021 Feb 3;11(1):2885.
doi: 10.1038/s41598-021-82289-y.

Deep learning for the fully automated segmentation of the inner ear on MRI

Affiliations
Observational Study

Deep learning for the fully automated segmentation of the inner ear on MRI

Akshayaa Vaidyanathan et al. Sci Rep. .

Abstract

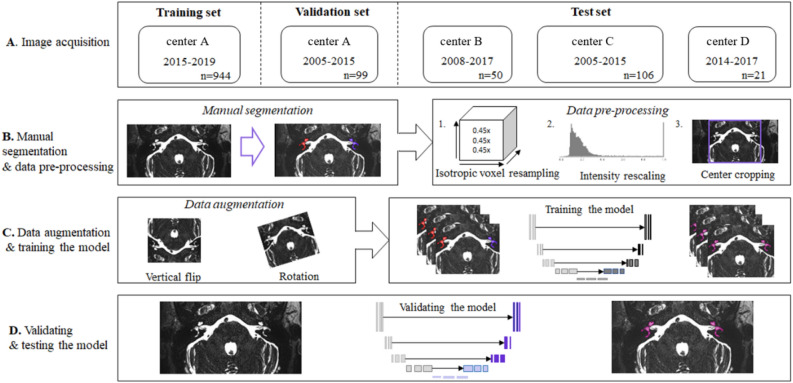
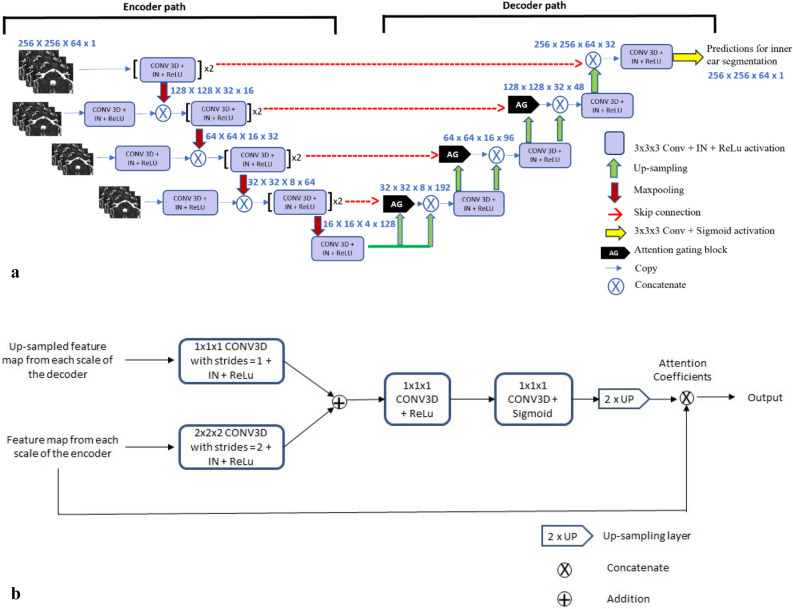
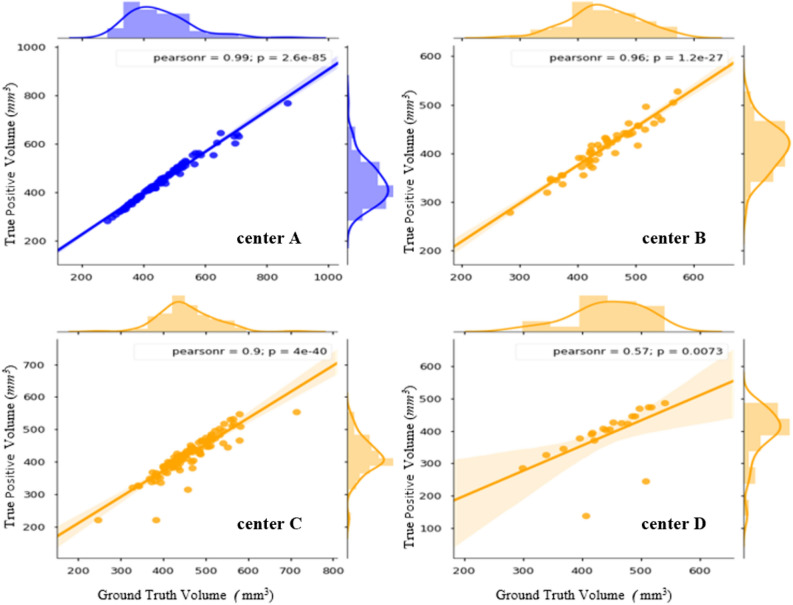
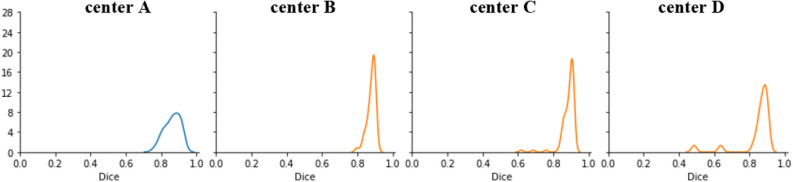
Segmentation of anatomical structures is valuable in a variety of tasks, including 3D visualization, surgical planning, and quantitative image analysis. Manual segmentation is time-consuming and deals with intra and inter-observer variability. To develop a deep-learning approach for the fully automated segmentation of the inner ear in MRI, a 3D U-net was trained on 944 MRI scans with manually segmented inner ears as reference standard. The model was validated on an independent, multicentric dataset consisting of 177 MRI scans from three different centers. The model was also evaluated on a clinical validation set containing eight MRI scans with severe changes in the morphology of the labyrinth. The 3D U-net model showed precise Dice Similarity Coefficient scores (mean DSC-0.8790) with a high True Positive Rate (91.5%) and low False Discovery Rate and False Negative Rates (14.8% and 8.49% respectively) across images from three different centers. The model proved to perform well with a DSC of 0.8768 on the clinical validation dataset. The proposed auto-segmentation model is equivalent to human readers and is a reliable, consistent, and efficient method for inner ear segmentation, which can be used in a variety of clinical applications such as surgical planning and quantitative image analysis.


Conflict of interest statement

M.F.J.A van der Lubbe, Marc van Hoof, Sergey Primakov, A.A. Postma, T.D. Bruintjes, M.A.L. Bilderbeek , Hammer Sebastiaan, P.F.M. Dammeijer, V. van Rompaey and R. van de Berg have no competing interests Fadila Zerka, Akshayaa Vaidyanathan, and Benjamin Miraglio are salaried employees of Oncoradiomics SA. Dr Philippe Lambin reports, within and outside the submitted work, grants/sponsored research agreements from Varian medical, Oncoradiomics, ptTheragnostic/DNAmito, Health Innovation Ventures. He received an advisor/presenter fee and/or reimbursement of travel costs/external grant writing fee and/or in kind manpower contribution from Oncoradiomics, BHV, Merck, Varian, Elekta, ptTheragnostic and Convert pharmaceuticals. Dr Lambin has shares in the company Oncoradiomics SA, Convert pharmaceuticals SA and The Medical Cloud Company SPRL and is co-inventor of two issued patents with royalties on radiomics (PCT/NL2014/050248, PCT/NL2014/050728) licensed to Oncoradiomics and one issue patent on mtDNA (PCT/EP2014/059089) licensed to ptTheragnostic/DNAmito, three non-patented invention (softwares) licensed to ptTheragnostic/DNAmito, Oncoradiomics and Health Innovation Ventures and three non-issues, non licensed patents on Deep Learning-Radiomics and LSRT (N2024482, N2024889, N2024889. Ralph T.H. Leijenaar has shares in the company Oncoradiomics and is co-inventor of an issued patent with royalties on radiomics (PCT/NL2014/050728) licensed to Oncoradiomics. Sean Walsh and Wim Vos have shares in the company Oncoradiomics. Henry C. Woodruff has minority shares in the company Oncoradiomics.

Figures

Figure 1
Figure 1
The workflow of autosegmentation of the inner ear in this study, graphically presented in four steps. (A) The image acquisition from four different centers divided into training, validation and an independent test set. (B) Manual segmentation of the labyrinth and pre-processing steps consisting of isotropic voxel resampling, intensity rescaling and center cropping. (C) Extending the data set (data augmentation) by flipping and rotating the input images and training of the model. (D) Validation and testing the model on an independent test cohort.
Figure 2
Figure 2
Maximum intensity projection of a sample MR in the axial, sagittal and coronal plane showing a manual segmentation of the labyrinth in yellow. Left: axial plane, right top: Coronal plane, right bottom: sagittal plane.
Figure 3
Figure 3
(a) The proposed 3D U-Net based architecture used in the study. MRI volumes, at multiple scales, were provided as input to the encoder network. The decoder network outputs a score to classify each voxel as inner ear or not. Notations in blue text (a × a × a × b) highlight the spatial resolution (a × a × a) and the feature map count (b). X block repetitions, IN instance normalization, Conv convolution kernel, ReLU rectified linear unit, 3 × 3 × 3 the size of the 3D CNN kernels. (b) Components of Attention Gating Block. The block receives as inputs, the up-sampled output feature map at each scale in the decoder and the feature map from each scale of the encoder. Attention coefficients generated, scale the input feature maps from the encoder.
Figure 4
Figure 4
Example automated and manual segmentation overlaid on MRI volume as displayed by the software.
Figure 5
Figure 5
The quantitative analysis showing linear correlations between the ground truth volume and the predicted true positive volume for the validation (plot in blue) and the test sets (plots in orange). The plot of center D shows 2 clear outliers which do not fit the trendline. This suggests under-segmentation of the inner ear in 2 cases belonging to the test cohort from Center D.
Figure 6
Figure 6
Distribution of DSC on the validation (blue curve) and the test dataset (orange curve). The distribution corresponding to Center C and D shows outliers (DSC < 0.7) which means less overlap between ground truth and predicted segmentation. The distribution also shows that the majority of the predictions have DSC between 0.8 to 1.0.
Figure 7
Figure 7
(a) Bland–Altman plot for inner ear volume of the entire test cohort showing percentage difference between predicted volume (PV) and ground truth volume (GTV) as a function of average of Ground Truth and Predicted Volume. The solid line shows the mean difference and the dotted line shows the limits of agreement. PV Predicted volume of inner ear, GTV ground truth volume of inner ear. The plot shows five clear outliers (red dots) with three cases which were under-segmented by 20%, 40% and 60% and two cases which were over-segmented by 40% and 60% respectively. The plot also shows the relationship between the DSC metrics and the level of under/over segmentation percentage. The outliers correspond to the DSC ≤ 0.80. (b) Bland–Altman plot for inner ear volume of the entire test cohort showing percentage difference between predicted volume (PV) and ground truth volume (GTV) as a function of average of ground truth and predicted volume after excluding the outliers shown in Fig. 5A (DSC ≤ 0.80). The solid line shows the mean difference and the dotted line shows the limits of agreement. PV Predicted volume of inner ear, GTV ground truth volume of inner ear. The plot shows that the model, on an average tends to over-segment by 9%.
Figure 8
Figure 8
(a) Example of a well predicted segmentation. The first row denotes the ground truth segmentation. The second row contains the model’s segmentation. (1a) Ground truth, axial plane. (1b) Ground truth, sagittal plane. (2c) Ground truth, coronal plane. (2a) Predicted mask, axial plane. (2b) Predicted mask, sagittal plane. (2c) Predicted mask, coronal plane. DSC: 0.92, ground truth volume: 465.37 mm3, true positive volume: 445.32 mm3, true positive Rate: 95.69%, false negative rate: 4.3%. False discovery rate: 11.7%. (b) Example of a poor segmentation. The first row denotes the ground truth segmentation. The second row contains the model’s segmentation. (1a) Ground truth, axial plane. (1b) Ground truth, sagittal plane. (2c) Ground truth, coronal plane. (2a) Predicted mask, axial plane. (2b) Predicted mask, sagittal plane. (2c) Predicted mask, coronal plane. DSC: 0.48, ground truth volume: 406.05 mm3, true positive volume: 137.96 mm3, true positive rate: 33.97%, false negative rate: 66.02%. False discovery rate: 1.5%.
Figure 9
Figure 9
(a) Example of one of the clinical validation MRI scans in the axial and coronal plane. This case shows the presence of a vestibular schwannoma after a translabyrinthine resection on the right side. Therefore, the right semi-circular canals and vestibule are not segmented. DSC: 0.8973, ground truth volume: 316.11 mm3, true positive volume: 294.69 mm3, true positive rate: 93.22%, false negative rate: 6.77%. False discovery rate: 7.3%. (b) The 3D volume rendering of the ground truth and the predicted mask. The semi-circular canals and the vestibule of the right inner ear were not displayed on MRI. The model has correctly not segmented the semi-circular canals and the vestibule. AD auriculum dextra, AS auriculum sinistra.

References

    1. Pyykkö I, Zou J, Gürkov R, Naganawa S, Nakashima T. Imaging of temporal bone. Adv. Otorhinolaryngol. 2019 doi: 10.1159/000490268. - DOI - PubMed
    1. Sollini M, Antunovic L, Chiti A, Kirienko M. Towards clinical application of image mining: A systematic review on artificial intelligence and radiomics. Eur. J. Nucl. Med. Mol. Imaging. 2019 doi: 10.1007/s00259-019-04372-x. - DOI - PMC - PubMed
    1. Kumar V, et al. Radiomics: The process and the challenges. Magn. Reson. Imaging. 2012;30:1234–1248. doi: 10.1016/j.mri.2012.06.010. - DOI - PMC - PubMed
    1. Gillies RJ, Kinahan PE, Hricak H. Radiomics: Images are more than pictures, they are data. Radiology. 2016 doi: 10.1148/radiol.2015151169. - DOI - PMC - PubMed
    1. van den Burg EL, et al. An exploratory study to detect ménière’s disease in conventional MRI scans using radiomics. Front. Neurol. 2016;7:190. - PMC - PubMed

Publication types