

Diurnal and seasonal variability of CO2 and CH4 concentration in a semi-urban environment of western India
- PMID: 33536470
- PMCID: PMC7859198
- DOI: 10.1038/s41598-021-82321-1
Diurnal and seasonal variability of CO2 and CH4 concentration in a semi-urban environment of western India
Abstract
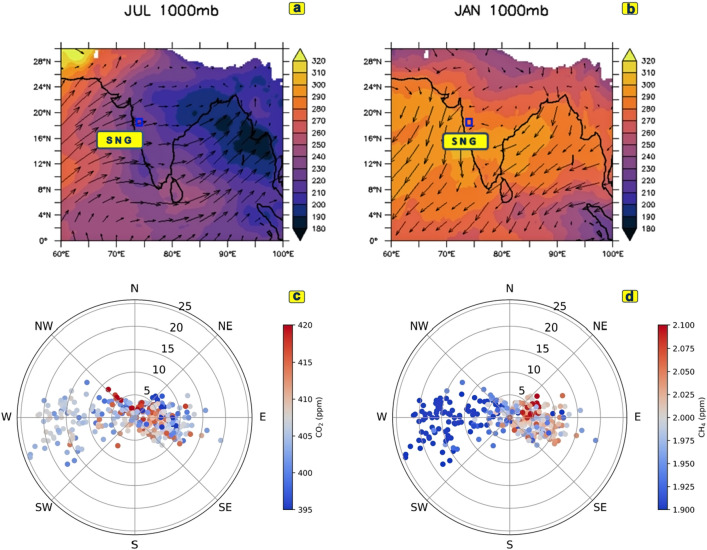
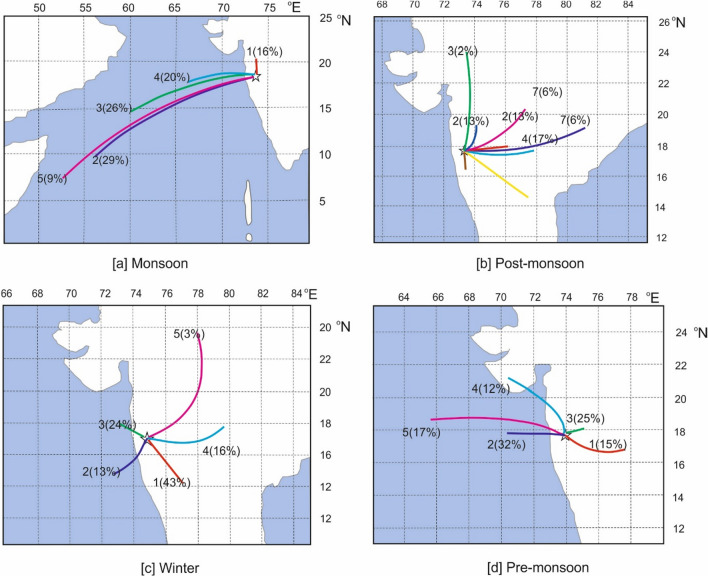
Amongst all the anthropogenically produced greenhouse gases (GHGs), carbon dioxide (CO2) and methane (CH4) are the most important, owing to their maximum contribution to the net radiative forcing of the Earth. India is undergoing rapid economic development, where fossil fuel emissions have increased drastically in the last three decades. Apart from the anthropogenic activities, the GHGs dynamics in India are governed by the biospheric process and monsoon circulation; however, these aspects are not well addressed yet. Towards this, we have measured CO2 and CH4 concentration at Sinhagad, located on the Western Ghats in peninsular India. The average concentrations of CO2 and CH4 observed during the study period are 406.05 ± 6.36 and 1.97 ± 0.07 ppm (µ ± 1σ), respectively. They also exhibit significant seasonal variabilities at this site. CH4 (CO2) attains its minimum concentration during monsoon (post-monsoon), whereas CO2 (CH4) reaches its maximum concentration during pre-monsoon (post-monsoon). CO2 poses significant diurnal variations in monsoon and post-monsoon. However, CH4 exhibits a dual-peak like pattern in pre-monsoon. The study suggests that the GHG dynamics in the western region of India are significantly influenced by monsoon circulation, especially during the summer season.
Conflict of interest statement
The authors declare no competing interests.
Figures


References
-
- Ciais, P. et al. Carbon and other biogeochemical cycles. in Climate Change 2013: The Physical Science Basis. Contribution of Working Group I to the Fifth Assessment Report of the Intergovernmental Panel on Climate Change Change (2013).
-
- Stocker TF, et al. Contribution of working group I to the fifth assessment report of the intergovernmental panel on climate change. Clim. Change 2013 Phys. Sci. Basis. 1993 doi: 10.1017/CBO9781107415324. - DOI
-
- Tans PP, Berry JA, Keeling RF. Oceanic 13C/12C observations: A new window on ocean CO2 uptake. Glob. Biogeochem. Cycles. 1993;7:353–368. doi: 10.1029/93GB00053. - DOI
-
- Keeling CD, Whorf TP, Wahlen M, van der Plichtt J. Interannual extremes in the rate of rise of atmospheric carbon dioxide since 1980. Nature. 1995;375:666–670. doi: 10.1038/375666a0. - DOI
-
- Quéré CL, et al. Global carbon budget 2017. Earth Syst. Sci. Data. 2018;10:405–448. doi: 10.5194/essd-10-405-2018. - DOI
Publication types
LinkOut - more resources
Full Text Sources
Other Literature Sources
