. 2021 Feb 3;11(1):2947.
doi: 10.1038/s41598-020-80627-0.

Analysis of Fox genes in Schmidtea mediterranea reveals new families and a conserved role of Smed-foxO in controlling cell death

Affiliations

Analysis of Fox genes in Schmidtea mediterranea reveals new families and a conserved role of Smed-foxO in controlling cell death

Eudald Pascual-Carreras et al. Sci Rep. .

Abstract

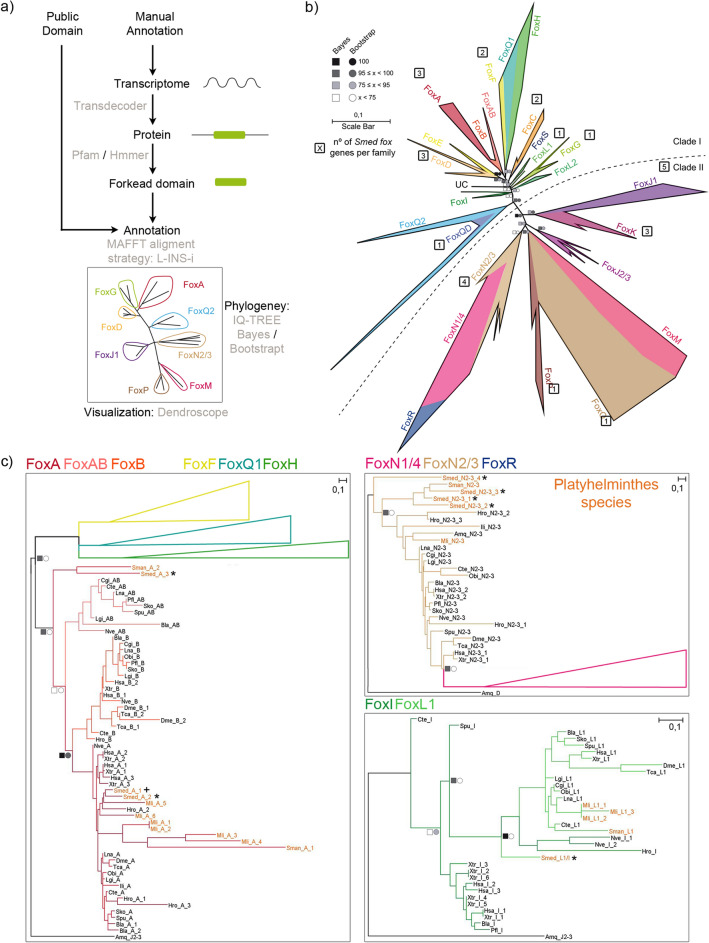
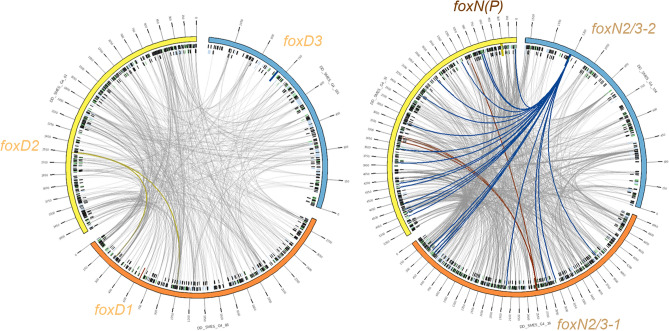
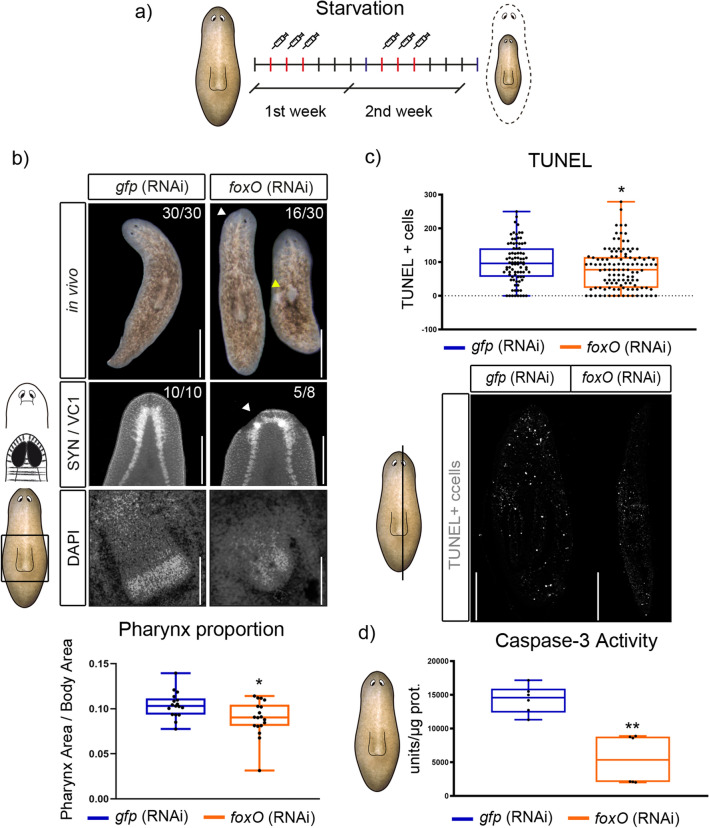
The forkhead box (Fox) genes encode transcription factors that control several key aspects of development. Present in the ancestor of all eukaryotes, Fox genes underwent several duplications followed by loss and diversification events that gave rise to the current 25 families. However, few Fox members have been identified from the Lophotrochozoa clade, and specifically from planarians, which are a unique model for understanding development, due to the striking plasticity of the adult. The aim of this study was to identify and perform evolutionary and functional studies of the Fox genes of lophotrochozoan species and, specifically, of the planarian Schmidtea mediterranea. Generating a pipeline for identifying Forkhead domains and using phylogenetics allowed us the phylogenetic reconstruction of Fox genes. We corrected the annotation for misannotated genes and uncovered a new family, the QD, present in all metazoans. According to the new phylogeny, the 27 Fox genes found in Schmidtea mediterranea were classified into 12 families. In Platyhelminthes, family losses were accompanied by extensive gene diversification and the appearance of specific families, the A(P) and N(P). Among the newly identified planarian Fox genes, we found a single copy of foxO, which shows an evolutionary conserved role in controlling cell death.


Conflict of interest statement

The authors declare no competing interests.

Figures

Figure 1
Figure 1
Fox family evolution in Metazoa reveals 27 Fox genes in Schmidtea mediterranea divided in 12 families. (a) pipeline annotate Fox genes. (b) The ML phylogenetic trees based on FKH. Number of genes per family in Schmidtea mediterranea is indicated inside a square next to each family. At nodes, values for the approximate Bayes (square) and Likelihood (circle) ratio test are shown. Colour indicates % of confidence. Family tree branches were collapsed at the base of the common node. One gene was unclassified in any family (UC). Dashed line divides Clade I and Clade II Fox genes. (c) For each node-sharing families, a phylogenetic tree was created using an Amq gene from the opposite clade as out group. Family branches are painted with the same colour as they are represented in the trees. Platyhelminthes genes are coloured light orange. Dark crosses indicate previous characterized genes and dark asterisks indicate new fox characterized in Schmidtea mediterranea (Smed). Aminoacidic sequences used are found in S1 File. Scale indicates expected aminoacidic substitution per site.
Figure 2
Figure 2
Distribution of Fox homologs in Metazoan clade indicating gene and family losses and some gene duplications in Schmidtea mediterranea. Coloured boxes indicate the presence of an ortholog based on the phylogenetic analysis. When there were no evidences of ortholog, the box remained white. A number (x Nº) inside a box indicates paralogs per family and species. Families are divided in Clade I and II. Number of genes and number of families per species are indicated. Metazoan and Lophotrochozoa phylogenies were used. Light purple lines indicate lophotrochozoan species and within light orange indicate Platyhelminthes superphylum species. Gains (+) and losses (−) of genes are placed next to each clade. Main Clade I Fox acquisition was at the base of Eumetazoa and different events of gains and losses happened through evolution. Specifically, many families were lost in Platyhelminthes (red dashed polygon).
Figure 3
Figure 3
Fox family evolution in Platyhelminthes indicates family diversification. (a) The ML phylogenetic trees based on FKH of Fox family evolution in Lophotrochozoan clade. Number of genes per family in Schmidtea mediterranea is indicated inside a square next to each family. At nodes, values for the approximate Bayes (square) and Likelihood (circle) ratio test are shown. Colour indicates % of confidence. Family tree branches were collapsed at the base of the common node. Dashed line divides Clade I and Clade II Fox genes. (b) For each node-sharing families, a phylogenetic tree was created using an Amq gene from the opposite clade as out group. Family branches are painted with the same colour as they are represented in the trees. Dark cross indicates previous characterized gene and dark asterisk indicates new fox characterized in Schmidtea mediterranea (Smed). Aminoacidic sequences used are placed in S3 File. Scale indicates expected aminoacidic substitution per site.
Figure 4
Figure 4
Distribution of Fox homologs reveals huge family loss and gene diversification in Platyhelminthes. Coloured boxes indicate the presence of an ortholog based on the phylogenetic analysis. When there were no evidences of ortholog, the box remained white. A number (x Nº) inside a box indicates paralogs per family and species. Families are divided in Clade I and II. Number of genes and number of families per species are indicated. Species were classified into Platyhelminthes and Tricladida phylogeny accordingly to and, respectively. Light orange indicates Platyhelminthes species within turquoise lines indicate Tricladida species; grey box indicates Dugesiidae family. Species belonging to the Tricladida order show different losses, gains and specialization events. Gains (+) and losses (−) of genes are indicated. Specifically, many families were lost in Platyhelminthes (red dashed polygon). FoxA(P) and FoxN(P) origin seems to predate Proseriata and Tricladida order, respectively.
Figure 5
Figure 5
New family FoxQD is broadly found in Metazoa but missing in Vertebrata and Porifera. The ML phylogenetic trees based on FKH of Q2 and QD family evolution in all metazoan species studied in this work. At nodes, values for the approximate Bayes (square) and Likelihood (circle) ratio test are shown. Colour indicates % of confidence. An Amq-J2/3 from the opposite clade was used as out group. Family branches are painted with the same colour as they are represented in the trees. Dark asterisk indicates a new fox characterized in Schmidtea mediterranea (Smed). Red cross indicates Saccoglossus kowalewski foxQD gene. Platyhelminthes QD genes are coloured light orange. Aminoacidic sequences used are placed in S1 and S3 File. Scale indicates expected aminoacidic substitution per site.
Figure 6
Figure 6
Fox paralogs do not present syntenic relationships in Smed genome. Alignments between scaffolds containing same-family Fox genes are represented with Circos. The Circos representation is composed of two tracks: In the outer ring the scaffolds containing Fox genes are labelled with their name (each tick representing 150 kb); in the inner ring, the repeating elements coloured in green (LINEs), blue (TLR) and black (simple repeats and other). Repeats are filtered to be shown only when greater than 1 kb. Grey lines connecting the scaffolds are the representation of the alignments, filtered to be shown only when greater than 1 Kb. In each scaffold, the region corresponding to the Fox gene (+ -5 Kb) is represented as a perpendicular darker region, and all the links that fall onto it are coloured accordingly.
Figure 7
Figure 7
Starving foxO (RNAi) animals show tissue disruption and a reduction of cell death. (a) Schematic depicting RNAi procedure. (b) 50% of in vivo foxO knockdown animals presented unpigmented regions (white arrow), neural tissue disappearance (yellow arrow in synapsin immunoassayed animals, and pharynx size reduction, as shown by DAPI staining and relative size quantification (controls, n = 17; RNAi, n = 18; *P < 0.05). (c) Quantification of TUNEL + cells on transversal sections show a reduction of positive cells in foxO (RNAi) animals compared to controls (controls, n = 86; RNAi, n = 117; *P < 0.05). (d) Quantification of caspase-3 activity in foxO (RNAi) animals and controls shows cell death reduction (controls, n > 6; RNAi, n > 6; **P < 0.01). Scale bars: b up and mid = 100 µm and down = 10 µm; c = 100 µm.

Similar articles

Cited by

References

    1. Golson ML, Kaestner KH. Fox transcription factors: From development to disease. Development. 2016;143:4558–4570. doi: 10.1242/dev.112672. - DOI - PMC - PubMed
    1. Ré B, Benayoun A, Caburet S, Veitia RA. Forkhead transcription factors: key players in health and disease. Trends Genet. 2011 doi: 10.1016/j.tig.2011.03.003. - DOI - PubMed
    1. Jackson BC, Carpenter C, Nebert DW, Vasiliou V. Update of human and mouse forkhead box (FOX) gene families. Human Genom. 2010;4:345–352. doi: 10.1186/1479-7364-4-5-345. - DOI - PMC - PubMed
    1. Hannenhalli S, Kaestner KH. The evolution of Fox genes and their role in development and disease. Nat. Rev. Genet. 2009;10:233–240. doi: 10.1038/nrg2523. - DOI - PMC - PubMed
    1. Enard W, et al. Molecular evolution of FOXP2, a gene involved in speech and language. Nature. 2002;418:869–872. doi: 10.1038/nature01025. - DOI - PubMed

Publication types

Substances