. 2021 Feb 3;11(1):2927.
doi: 10.1038/s41598-021-82421-y.

Scientific, societal and pedagogical approaches to tackle the impact of climate change on marine pollution

Affiliations

Scientific, societal and pedagogical approaches to tackle the impact of climate change on marine pollution

Tiago M Alves et al. Sci Rep. .

Abstract

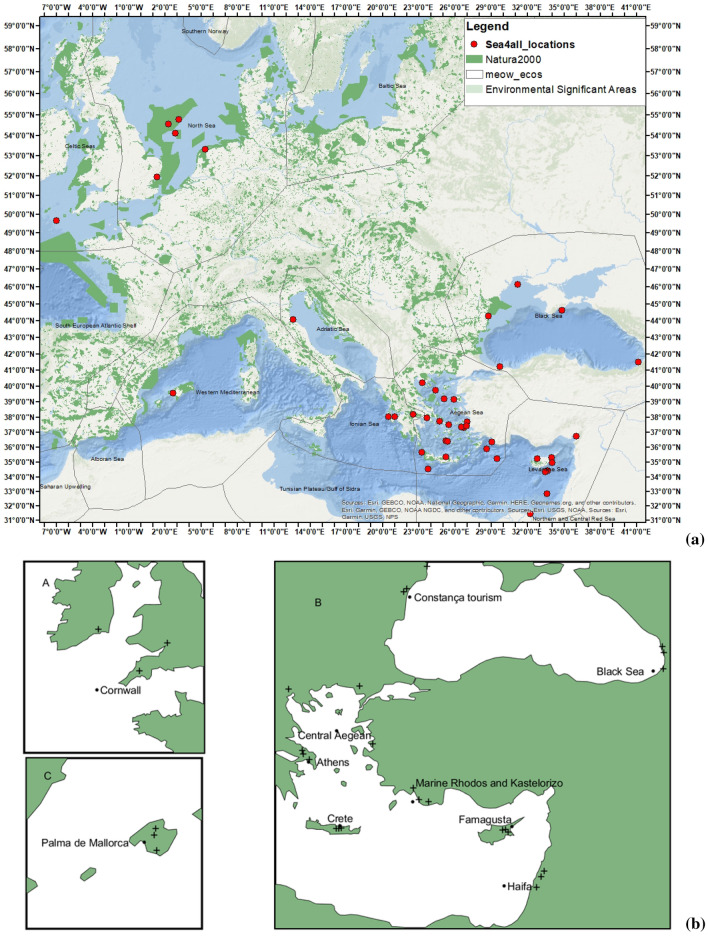
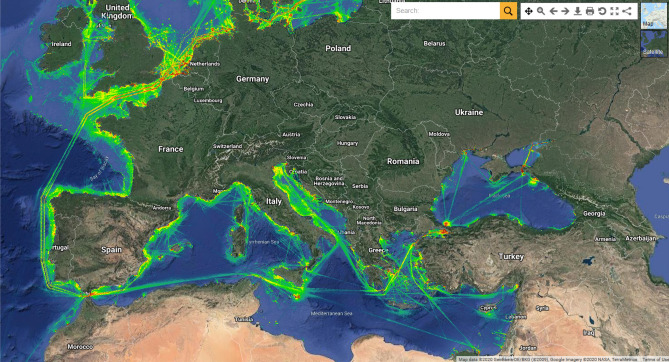
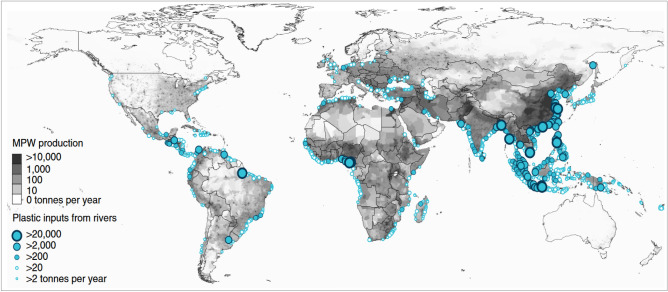
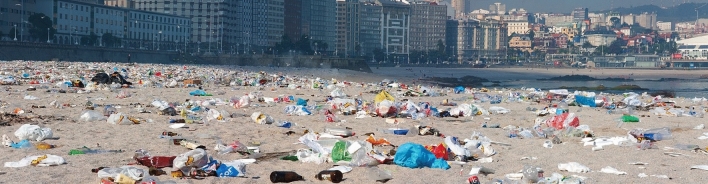
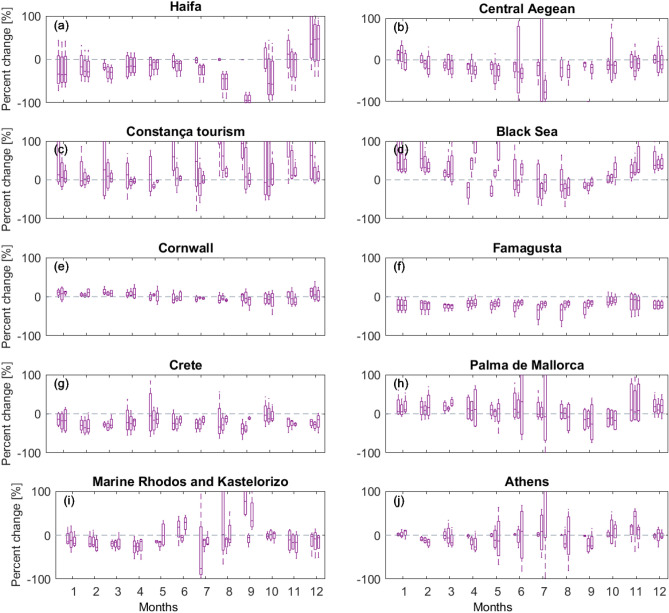
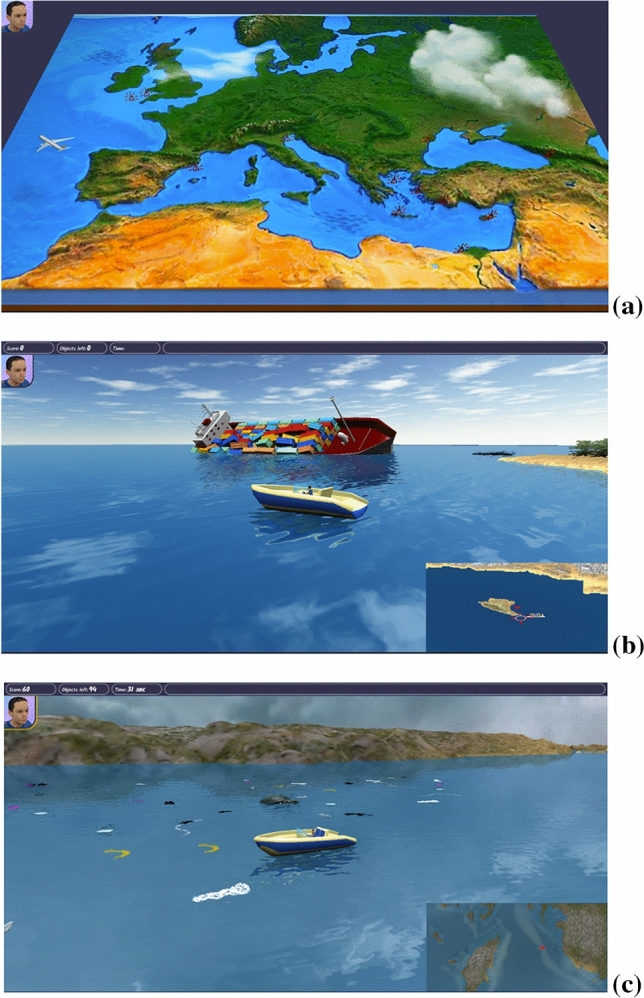
Marine pollution impacts coastal nations around the world, and more so: (a) in confined maritime areas with significant marine traffic, (b) where exploitation of natural and mineral resources is taking place, or (c) in regions witnessing pressure from tourism, local population growth, and industry. In this work, Digital Elevation Models, hydrographic, and climatic data are used together with computer simulations to understand the control of climate change on marine pollution. The results show that different climate change signals can potentially alter the flow and concentration of pollution in the European Seas, when compared to the present day. Ultimately, this work identifies the main sources of marine pollution as: (1) rivers and streams near cities and industrialised areas, (2) coastal areas experiencing sudden demographic pressures, (3) offshore shipping lanes in which oil and other marine debris are released, and (4) areas of rugged seafloor where industrial fishing takes place. This paper finishes by describing new educational material prepared to teach school children around the world. It explains why how a new training curriculum and e-game developed by Sea4All can be crucial in future Environmental Education and Education for a Sustainable Development.


Conflict of interest statement

The authors declare no competing interests.

Figures

Figure 1
Figure 1
General maps of the study area. (a) Environmentally significant areas and Natura 2000 sites in Europe shown together with the locations of the 43 pollution scenarios implemented in the context of the Sea4All project (www.sea4all-project.eu). (b) Relative location of sites in which river flow data were gathered from the Service for Water Indicators in Climate Change Adaptation (SWICCA) database. Figure (a) was created using ArcGIS (https://pro.arcgis.com/en/pro-app/get-started/get-started.htm#:~:text=ArcGIS%20Pro%20is%20the%20latest,elements%20of%20the%20user%20interface and https://www.marathondata.gr/). Natura2000 data are from http://www.eea.europa.eu/data-and-maps/data/natura-2/natura-2000-spatial-data/.
Figure 2
Figure 2
Ship density map for the seas surrounding Europe for 2018. The map illustrates the high density of vessels in confined maritime areas. The brighter colours indicate the presence of shipping corridors where ship density is the greatest. Map was taken from EMODnet data visualisation portal at https://www.emodnet-humanactivities.eu/view-data.php.
Figure 3
Figure 3
Map illustrating the mass of river plastic flowing into oceans in tonnes per year in different parts of the world. River contributions were estimated from individual watershed characteristics such as population density (in inhabitants per km−2), mismanaged plastic waste (MPW) production per country (in kg inhab−1 day−1) and monthly averaged run off (in mm day−1). The model is calibrated against river plastic concentration measurements from Europe, Asia, North and South America.
Figure 4
Figure 4
Panoramic photograph of the beach front at La Coruña, Spain, showing the impact cultural events may have on the coast. The image, highlighting the large amount of litter gathered on the Orzán Beach after the city’s Patron Saint celebrations (https://commons.wikimedia.org/wiki/File:Estado_de_la_playa_del_Orz%C3%A1n_despu%C3%A9s_de_la_noche_de_San_Juan_-_A_Coru%C3%B1a,_Galicia,_Spain_-_24_June_2010.jpg) was modified from an original photo taken by Carlos de Paz, an inhabitant of the city of La Coruña, on 24 June 2010. The image is licensed under the Creative Commons Attribution-Share Alike 2.0 Generic license, https://creativecommons.org/licenses/by-sa/2.0/.
Figure 5
Figure 5
Underwater photograph showing Scuba divers removing derelict nets from a seafloor reef off NW Hawaii, United States of America. Water depth reaches 30 feet (~ 9 m) around this reef. After being swept by the North Pacific Gyre, a number of nets were bundled together to form a debris pile at this location. The photograph was taken by Dr. Dwayne Meadows, on 21 October 2010, is part of NOAA’s Photo Library (https://commons.wikimedia.org/wiki/File:Reef3038_-_Flickr_-_NOAA_Photo_Library.jpg). It licensed under the Creative Commons Attribution-Generic 2.0 license at Wikipedia Commons https://creativecommons.org/licenses/by/2.0/.
Figure 6
Figure 6
Example of bathymetric analyses for the Eastern Mediterranean Sea showing: (a) slope gradients and (b) aspects. Areas presenting slopes higher than 60° are indicated by the ellipses in (a), while aspects have been categorised according to the direction of aspect in (b), aiming at highlighting the role of the aspect direction in shaping the structure of the modern sea floor. Seafloor topography severely alters the ocean circulation, especially in areas with rugged sea floor, further affecting pollution dispersion. The Figures were compiled from Matlab-r2010a (http://matlab-r2010a.software.informer.com/). Bathymetric data are from the open database EMODnet (http://www.emodnet-hydrography.eu/).
Figure 7
Figure 7
Bar graphs of simulated mean monthly flow (m3/s) for three catchments at each selected incident sites (see Fig. 1b for location). Orange colours represent discharge for a current time horizon (1971–2000). The indigo coloured bars represent discharge for a 30-year time horizon in the future, centered on 2080 following the RCP8.5 emission scenario. Most locations represented in this figure record a drier summer half-year compared to the winter half-year (November to March). Estimates of future change indicate much uncertainty, sometimes indicating that both decreases and increases are plausible futures. Graphs suggest a drying signal in the east of Mediterranean, particularly clear for Haifa and Famagusta. Further to the west and north, the change-pattern in catchment river flow is largely reversed, with increases more likely in the wetter winter months.
Figure 8
Figure 8
Bar graphs of relative change (%) in simulated annual flood frequency magnitudes for different return periods for three catchments for each selected incident sites. Relative change is estimated as the percent difference between indices estimated for a current climate period 1971–2000 and those for a 30-year period centered on 2080 following emission scenario RCP8.5. Axes are cut at 100% change to improve readability. Flood magnitude is predicted to increase in Athens, Palma de Maiorca and the Aegean Sea as a whole (including Crete) until 2018, and similarly so for Constança. Minor increases are estimated for Rhodos and Kastelorizo, together with Famagusta in Cyprus and Cornwall (UK). Estimates for the Black Sea differ from those for Constança, indicating only a slight increase in flood magnitudes for all return periods.
Figure 9
Figure 9
Bar graphs of relative change (%) in simulated mean monthly flow for different return periods for three catchments for each selected incident sites. Relative change is estimated as the percent difference between indices estimated for a current climate period 1971–2000 and those for a 30-year period centered on 2080 following emission scenario RCP8.5. Axes are cut at 100% change to improve readability. Monthly catchment flows are expected to decrease in Famagusta, Crete, Rhodos and Kastelorizo, with variations recorded amongst this locations. The Central Aegean is predicted to record drier summers but slightly wetter winters. The Black Sea and Constança will record increases in monthly catchment flow, likely in association with the capture of thawing water and river flow from surrounding mountains.
Figure 10
Figure 10
Screen images of the web-based game for PCs (using WebGL technology) compiled for the Sea4All project. (a) General map showing the relative location of tasks to be completed by users, with rewards/bonus provided upon completion (e.g. inventory items, puzzles, new information about marine pollution, the possibility of unlocking new scenarios). (b) Example of a scenario in the game concerning the capsizing of a cargo ship and ensuing oil spill. The game users will have to confine the oil spill using equipment (booms) available on the imaged boat. (c) Example of a scenario that concerns the collection of marine litter close to an area with sea turtles. Note the presence of a moving sea turtle behind the main character’s boat, between this latter and the coast.

References

    1. Sheavly SB, Register KM. Marine debris and plastics: Environmental concerns, sources, impacts and solutions. J. Polym. Environ. 2007;15:301–305. doi: 10.1007/s10924-007-0074-3. - DOI
    1. Willis K, Hardesty BD, Kriwoken L, Wilcox C. Differentiating littering, urban runoff and marine transport as sources of marine debris in coastal and estuarine environments. Sci. Rep. 2017;7:44479. doi: 10.1038/srep44479. - DOI - PMC - PubMed
    1. Brady JP, Ayoko GA, Martens WN, Goonetilleke A. Development of a hybrid pollution index for heavy metals in marine and estuarine sediments. Environ. Monit. Assess. 2015;187:306. doi: 10.1007/s10661-015-4563-x. - DOI - PubMed
    1. Polidoro BA, Comeros-Raynal MT, Cahill T, Clement C. Land-based sources of marine pollution: Pesticides, PAHs and phthalates in coastal stream water, and heavy metals in coastal stream sediments in American Samoa. Mar. Poll. Bull. 2017;116:501–507. doi: 10.1016/j.marpolbul.2016.12.058. - DOI - PubMed
    1. Tiquio MGJP, Marmier N, Francour P. Management frameworks for coastal and marine pollution in the European and South East Asian regions. Ocean Coast. Manag. 2017;135:65–78. doi: 10.1016/j.ocecoaman.2016.11.003. - DOI

LinkOut - more resources