

Urine lipoarabinomannan in HIV uninfected, smear negative, symptomatic TB patients: effective sample pretreatment for a sensitive immunoassay and mass spectrometry
- PMID: 33536495
- PMCID: PMC7859189
- DOI: 10.1038/s41598-021-82445-4
Urine lipoarabinomannan in HIV uninfected, smear negative, symptomatic TB patients: effective sample pretreatment for a sensitive immunoassay and mass spectrometry
Abstract
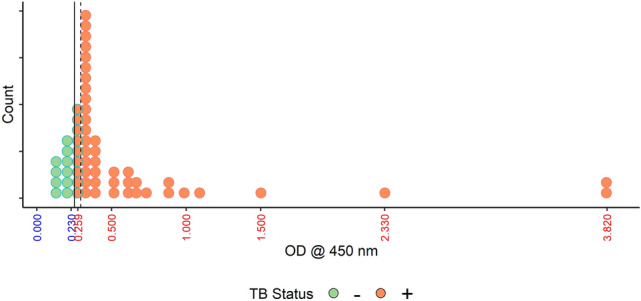
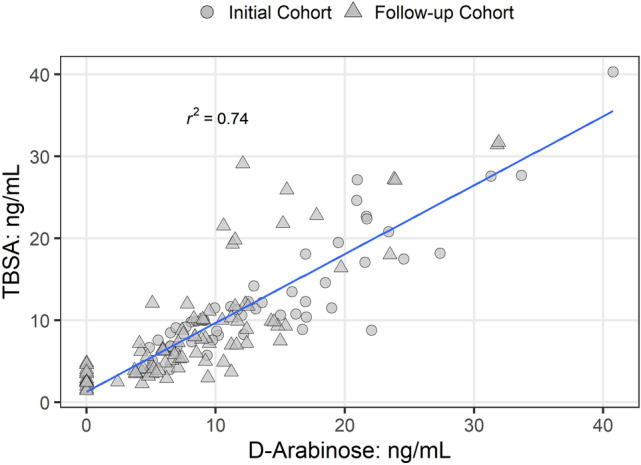
Our study sought to determine whether urine lipoarabinomannan (LAM) could be validated in a sample cohort that consisted mainly of HIV uninfected individuals that presented with tuberculosis symptoms. We evaluated two tests developed in our laboratory, and used them on clinical samples from Lima, Peru where incidence of HIV is low. ELISA analysis was performed on 160 samples (from 140 adult culture-confirmed TB cases and 20 symptomatic TB-negative child controls) using 100 μL of urine after pretreatment with Proteinase K. Two different mouse monoclonal antibodies-CS35 and CHCS9-08 were used individually for capture of urine LAM. Among cases, optical density (OD450) values had a positive association with higher bacillary loads. The 20 controls had negative values (below the limit of detection). The assay correctly identified all samples (97-100% accuracy confidence interval). For an alternate validation of the ELISA results, we analyzed all 160 urine samples using an antibody independent chemoanalytical approach. Samples were called positive only when LAM surrogates-tuberculostearic acid (TBSA) and D-arabinose (D-ara)-were found to be present in similar amounts. All TB cases, including the 40 with a negative sputum smear had LAM in detectable quantities in urine. None of the controls had detectable amounts of LAM. Our study shows that urinary LAM detection is feasible in HIV uninfected, smear negative TB patients.
Conflict of interest statement
The authors declare no competing interests.
Figures


Similar articles
-
Lateral flow urine lipoarabinomannan assay for detecting active tuberculosis in HIV-positive adults.Cochrane Database Syst Rev. 2016 May 10;2016(5):CD011420. doi: 10.1002/14651858.CD011420.pub2. Cochrane Database Syst Rev. 2016. PMID: 27163343 Free PMC article.
-
Low-complexity manual nucleic acid amplification tests for pulmonary tuberculosis in children.Cochrane Database Syst Rev. 2025 Jun 25;6(6):CD015806. doi: 10.1002/14651858.CD015806.pub2. Cochrane Database Syst Rev. 2025. PMID: 40557818 Free PMC article. Review.
-
Performance of stool Xpert MTB/RIF Ultra for detection of Mycobacterium tuberculosis among adults living with HIV: a multicentre, prospective diagnostic study.Lancet Microbe. 2025 Jul;6(7):101085. doi: 10.1016/j.lanmic.2025.101085. Epub 2025 Apr 4. Lancet Microbe. 2025. PMID: 40194533 Free PMC article.
-
Xpert® MTB/RIF assay for pulmonary tuberculosis and rifampicin resistance in adults.Cochrane Database Syst Rev. 2013 Jan 31;(1):CD009593. doi: 10.1002/14651858.CD009593.pub2. Cochrane Database Syst Rev. 2013. Update in: Cochrane Database Syst Rev. 2014 Jan 21;(1):CD009593. doi: 10.1002/14651858.CD009593.pub3. PMID: 23440842 Free PMC article. Updated.
-
Xpert® MTB/RIF assay for pulmonary tuberculosis and rifampicin resistance in adults.Cochrane Database Syst Rev. 2014 Jan 21;2014(1):CD009593. doi: 10.1002/14651858.CD009593.pub3. Cochrane Database Syst Rev. 2014. Update in: Cochrane Database Syst Rev. 2019 Jun 07;6:CD009593. doi: 10.1002/14651858.CD009593.pub4. PMID: 24448973 Free PMC article. Updated.
Cited by
-
Immobilization of Proteinase K for urine pretreatment to improve diagnostic accuracy of active tuberculosis.PLoS One. 2021 Sep 21;16(9):e0257615. doi: 10.1371/journal.pone.0257615. eCollection 2021. PLoS One. 2021. PMID: 34547058 Free PMC article.
-
Simple manipulation of enzyme-linked immunosorbent assay (ELISA) using an automated microfluidic interface.Anal Methods. 2022 May 13;14(18):1774-1781. doi: 10.1039/d2ay00326k. Anal Methods. 2022. PMID: 35481474 Free PMC article.
-
Collected Thoughts on Mycobacterial Lipoarabinomannan, a Cell Envelope Lipoglycan.Pathogens. 2023 Oct 26;12(11):1281. doi: 10.3390/pathogens12111281. Pathogens. 2023. PMID: 38003746 Free PMC article. Review.
-
Monoclonal antibodies to lipoarabinomannan/arabinomannan - characteristics and implications for tuberculosis research and diagnostics.Trends Microbiol. 2023 Jan;31(1):22-35. doi: 10.1016/j.tim.2022.07.001. Epub 2022 Jul 30. Trends Microbiol. 2023. PMID: 35918247 Free PMC article. Review.
-
Monoclonal antibodies from humans with Mycobacterium tuberculosis exposure or latent infection recognize distinct arabinomannan epitopes.Commun Biol. 2021 Oct 12;4(1):1181. doi: 10.1038/s42003-021-02714-w. Commun Biol. 2021. PMID: 34642445 Free PMC article.
References
-
- WHO . Global Tuberculosis Report 2019. Geneva: WHO; 2019.
-
- Elliott AM, et al. The impact of human immunodeficiency virus on presentation and diagnosis of tuberculosis in a cohort study in Zambia. J. Trop. Med. Hyg. 1993;96:1–11. - PubMed
Publication types
MeSH terms
Substances
Grants and funding
LinkOut - more resources
Full Text Sources
Other Literature Sources
Medical
