. 2021 Feb 3;11(1):2953.
doi: 10.1038/s41598-021-82308-y.

Salicylic acid stabilizes Staphylococcus aureus biofilm by impairing the agr quorum-sensing system

Affiliations

Salicylic acid stabilizes Staphylococcus aureus biofilm by impairing the agr quorum-sensing system

Cristian Dotto et al. Sci Rep. .

Abstract

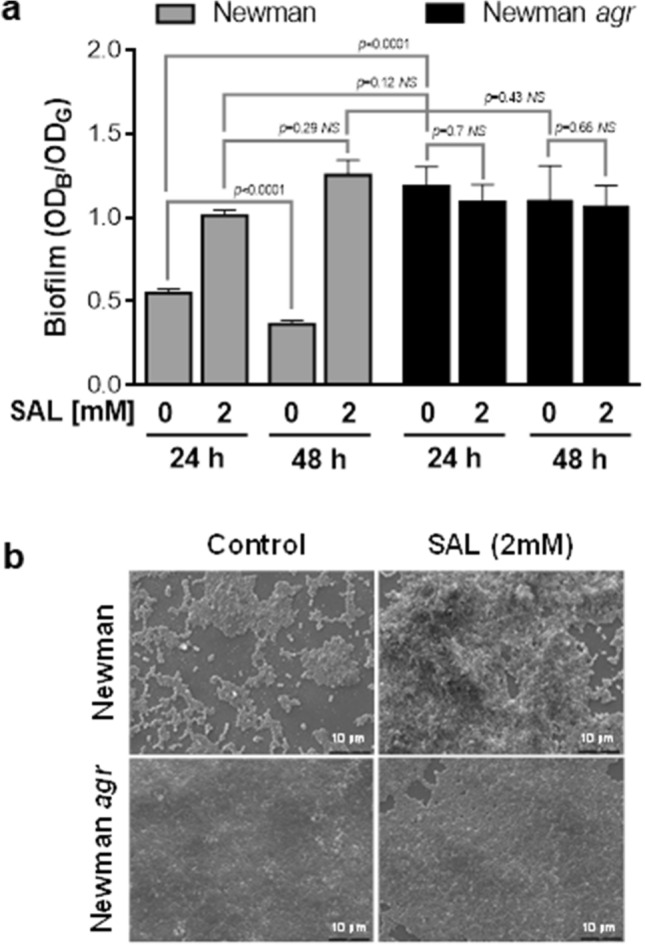
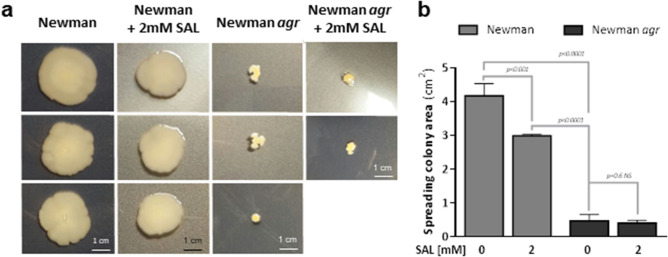
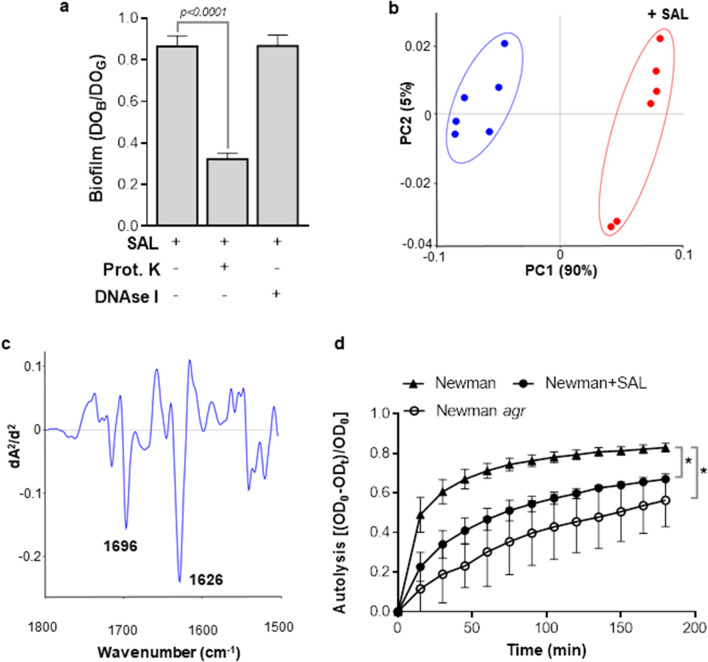
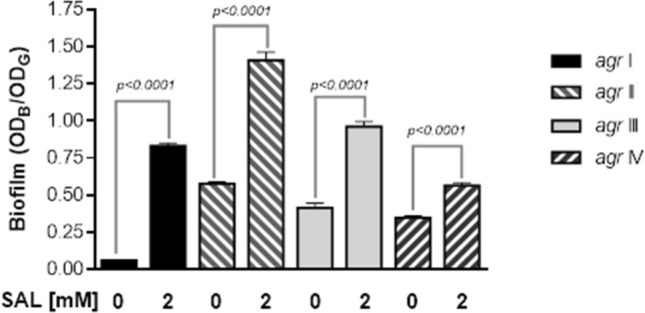
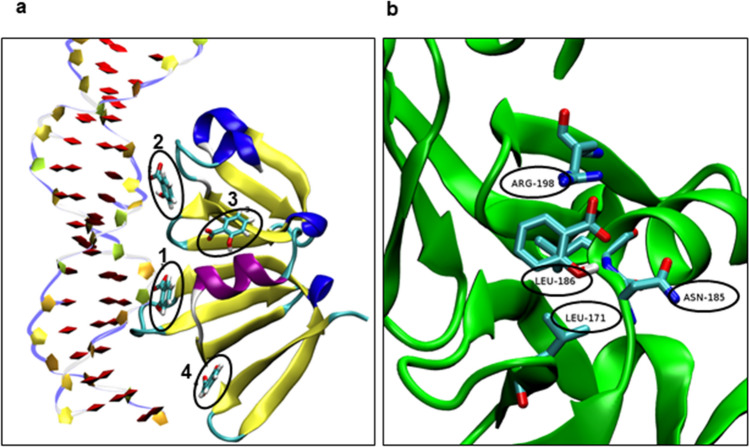
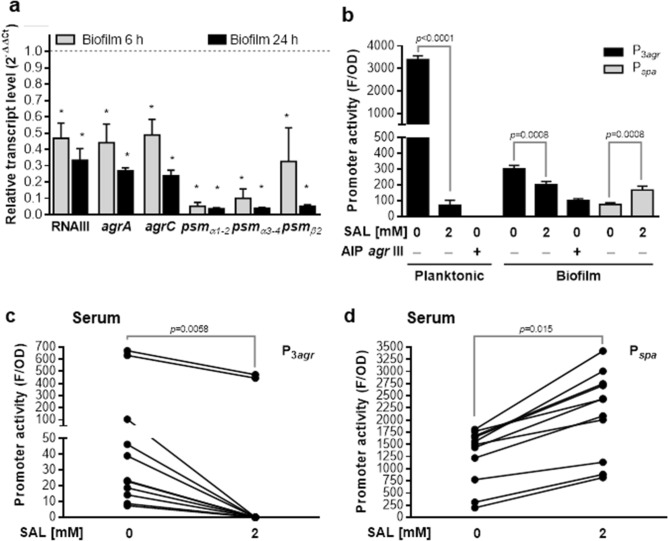
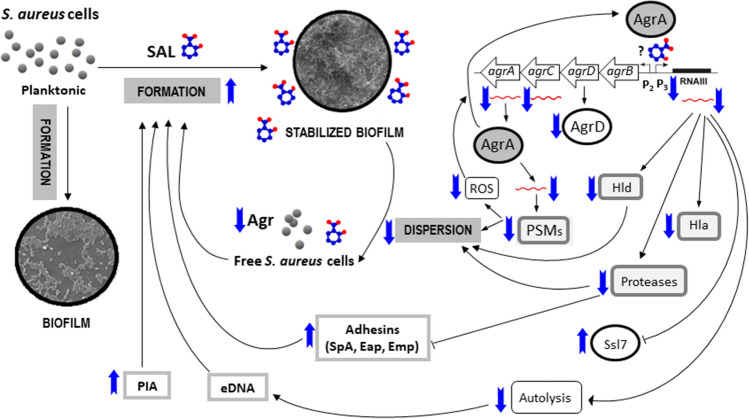
Salicylic acid (SAL) has recently been shown to induce biofilm formation in Staphylococcus aureus and to affect the expression of virulence factors. This study was aimed to investigate the effect of SAL on the regulatory agr system and its impact on S. aureus biofilm formation. The agr quorum-sensing system, which is a central regulator in S. aureus pathogenicity, plays a pivotal role in the dispersal of S. aureus mature biofilms and contributes to the creation of new colonization sites. Here, we demonstrate that SAL impairs biofilm dispersal by interfering with agr expression. As revealed by our work, protease and surfactant molecule production is diminished, and bacterial cell autolysis is also negatively affected by SAL. Furthermore, as a consequence of SAL treatment, the S. aureus biofilm matrix revealed the lack of extracellular DNA. In silico docking and simulation of molecular dynamics provided evidence for a potential interaction of AgrA and SAL, resulting in reduced activity of the agr system. In conclusion, SAL stabilized the mature S. aureus biofilms, which may prevent bacterial cell dissemination. However, it may foster the establishment of infections locally and consequently increase bacterial persistence leading to therapeutic failure.


Conflict of interest statement

The authors declare no competing interests.

Figures

Figure 1
Figure 1
SAL prevents S. aureus biofilm dispersion. (a) Biofilm formation by the Newman strain or Newman agr mutant exposed to 2 mM of SAL measured after 24 and 48 h of static incubation at 37 °C. Each bar represents the mean ± SEM of 8 wells from 4 independent experiments. Biofilm formation values correspond to the OD595 of crystal violet (ODB) measured relative to the final culture density (ODG) after 24 or 48 h incubation. Comparison of Newman treated with SAL and Newman agr treated with SAL at both time points showed no significant differences. Statistical analysis was performed with the Mann–Whitney test. (b) Scanning electron microscopy (SEM) representative images of Newman and Newman agr biofilms grown statically for 24 h at 37 °C in the presence or absence of 2 mM of SAL. The black bars correspond to 10 μm. The magnification is 2000×.
Figure 2
Figure 2
SAL affects S. aureus spreading colonies ability. (a) The spreading colonies from overnight cultures cultured with or without 2 mM of SAL spotted in the middle of LB soft agar plates supplemented or not with 2 mM of SAL. Pictures are representative of three independent experiments with three replicates each. After 24 h of incubation at 37 °C, the plates were photographed and (b) the spreading colony areas (cm2) were determined using ImageJ software. Each bar represents the mean ± SD from 3 independent experiments. Statistical analyses were performed with one-way ANOVA and Holm’s test for multiple comparisons.
Figure 3
Figure 3
SAL alters the extracellular matrix components and autolysis. (a) Treatments with proteinase K (prot. K) or DNAse I of Newman biofilms formed for 24 h with 2 mM of SAL. Biofilm formation values correspond to the OD595 of crystal violet (ODB) measured relative to the final culture density (ODG) after 24 h incubation. Each bar represents the mean ± SEM of 6–8 wells from 3 to 4 independent experiments. Statistical analysis was performed with the Mann–Whitney test. (b) Principal component analysis (PCA) was carried out using the second derivative of vector normalized FTIR spectra in the range corresponding to amide bonds (1500–1800 cm−1) recorded from Newman biofilms. Biofilms were formed in TSBg with 2 mM of SAL during 24 h (red symbols) or without SAL (blue symbols). Different groups were indicated by ellipses in the figure. The relative contribution of each principal component is indicated in parenthesis. (c) Loading plot of SAL effect on S. aureus biofilm in the spectral region for protein constituents (1800–1500 cm−1). Spectral changes at 1626 cm−1 and 1696 cm−1 are related to alterations in the protein’s β-sheet conformation as well as anti-parallel pleated sheets and β-turn structures, respectively. (d) The Newman and Newman agr strain cultures were grown in TSBg with or without 2 mM of SAL to exponential phase. Bacterial lysis mediated by Triton X-100 was measured spectrophotometrically as a decrease in OD600 over time. Autolysis was defined as Eq. 1. The curves represent 2 independent experiments, with significant changes in comparisons: control vs SAL treatment and wild type vs agr mutant, denoted with asterisks (t-test).
Figure 4
Figure 4
SAL promotes biofilm formation among S. aureus strains of agr types I to IV. Biomass quantification of the biofilms generated by the S. aureus BRA (agr I), CBS (agr II), MW2 (agr III) and RN8540 (agr IV) strains formed for 24 h at 37 °C in the presence or absence of 2 mM of SAL. Each bar represents the mean ± SEM from 4 independent experiments with 8 wells for each condition. Statistical analysis was performed with the Mann–Whitney test.
Figure 5
Figure 5
In silico determination of potential interaction sites on AgrA with SAL. (a) The figure depicts 4 interaction sites between SAL and AgrA overlapping a DNA fragment, determined by the AutoDock4 v4.2.6 and AutoDock Vina v1.1.2 softwares,. The AgrA regulator is shown with a “New Cartoon” representation with α-helixes, β-sheets and loops are represented in magenta, yellow and blue colors, respectively. The DNA fragment is shown with a “PapeChain” representation with phosphates groups, deoxyribose residues and nitrogen bases shown in blue, yellow and red colors, respectively. SAL is shown in each site (1–4) with an ellipse, with a “Licorice” representation with C, O and H atoms shown in cyan, red and white colors, respectively. (b) The figure depicts the predicted complex between AgrA and SAL in site 1, with the main amino acid residues involved in the interaction denoted by ellipses (Leu-186, Leu-171, Arg-198, and Asn-185).
Figure 6
Figure 6
SAL modifies agr, psm and, spa transcription. (a) RNAIII, agrA, agrC, psmα1-2, psmα3-4 and psmβ2 transcripts were quantified in immature (6 h) and mature (24 h) Newman biofilms formed in TSBg with 2 mM SAL. Genic expression changes were informed as fold changes (2−∆∆Ct). Data were related to the expression of the housekeeping gene gyrB. Values of 2−∆∆Ct < 1 represent a decreased expression with SAL treatment. Each bar represents the mean ± SEM from duplicates of 3 independent experiments. The asterisk symbol means a significant change (t-test). (b) Planktonic and biofilms cultures of NewmanP3agr and NewmanPspa grown for 24 h in TSBg with 2 mM of SAL or supernatants of S. aureus agr type III cultures, enriched in AIP type III. Promoter P3agr y Pspa activities were determined by gfp fusion and quantification of fluorescence (F) corresponding to GFP. F values were related to the final growing optical density (OD). Each bar represents the mean ± SEM of 6–8 wells from 3 to 4 independent experiments. Statistical comparisons are represented by lines with the p values denoted above (t-test). (c) Eight-hour planktonic cultures of NewmanP3agr and (d) NewmanPspa strains grown in human serum from 11 donors with 2 mM of SAL. The lines link each donor represented with a dot, in both conditions and the p values denoted above (t- test).
Figure 7
Figure 7
Schematic representation of SAL effects on stabilization of biofilm formed by S. aureus. Summary of changes determined in mRNA or protein expression, biochemical and phenotypic levels. Black lines with arrowheads endings denote stimulation and flat endings inhibition. Up and down blue arrows represent an increased or diminished change induced by SAL, respectively.

Similar articles

Cited by

References

    1. Yadav MK, Song JJ, Singh BP, Vidal JE. Microbial biofilms and human disease: a concise review. In: Yadav MK, Singh BP, editors. New and Future Developments in Microbial Biotechnology and Bioengineering: Microbial Biofilms. Ch 1. Amsterdam: Elsevier; 2020. pp. 1–13.
    1. Conlon BP. Staphylococcus aureus chronic and relapsing infections: evidence of a role for persister cells: an investigation of persister cells, their formation and their role in S. aureus disease. BioEssays. 2014;36:991–996. doi: 10.1002/bies.201400080. - DOI - PubMed
    1. Crabbé A, Jensen P, Bjarnsholt T, Coenye T. Antimicrobial tolerance and metabolic adaptations in microbial biofilms. Trends Microbiol. 2019;27:850–863. doi: 10.1016/j.tim.2019.05.003. - DOI - PubMed
    1. Otto M. Staphylococcal infections: mechanisms of biofilm maturation and detachment as critical determinants of pathogenicity. Annu. Rev. Med. 2013;64:1–14. doi: 10.1146/annurev-med-042711-140023. - DOI - PubMed
    1. Cramton SE, Gerke C, Schnell NF, Nichols WW, Götz F. The intercellular adhesion (ica) locus is present in Staphylococcus aureus and is required for biofilm formation. Infect. Immun. 1999;67:5427–5433. doi: 10.1128/IAI.67.10.5427-5433.1999. - DOI - PMC - PubMed

Publication types

MeSH terms