. 2021 Feb 3;11(1):2938.
doi: 10.1038/s41598-021-82459-y.

Data-driven identification of ageing-related diseases from electronic health records

Affiliations

Data-driven identification of ageing-related diseases from electronic health records

Valerie Kuan et al. Sci Rep. .

Abstract

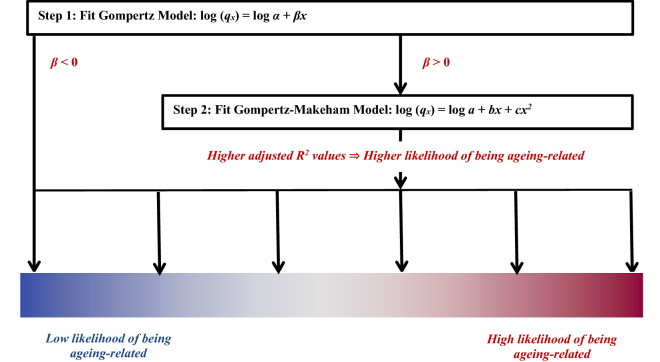
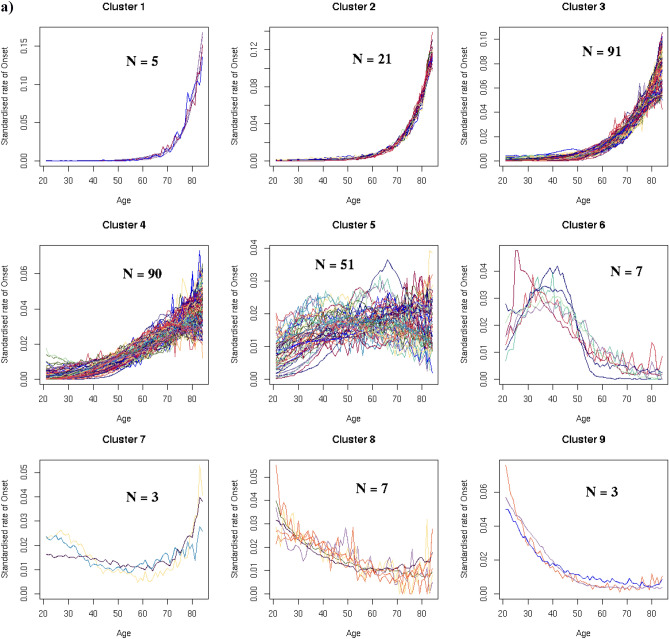
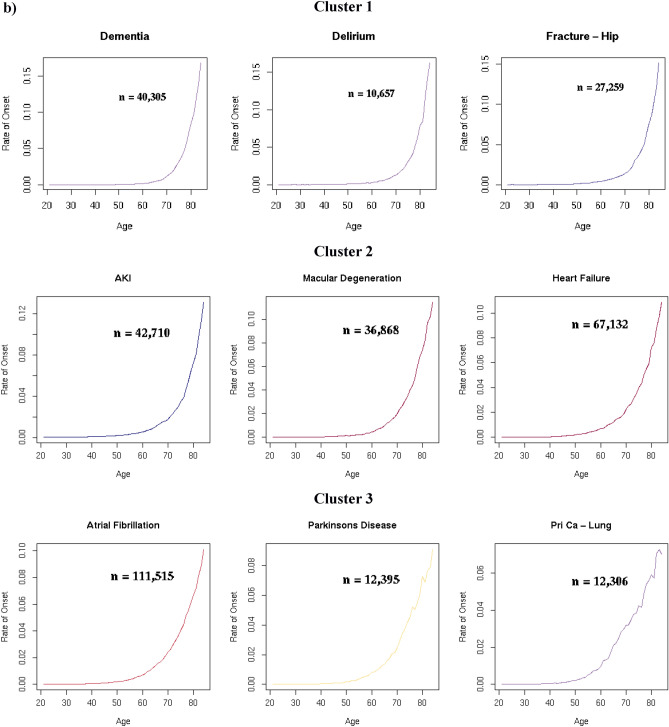
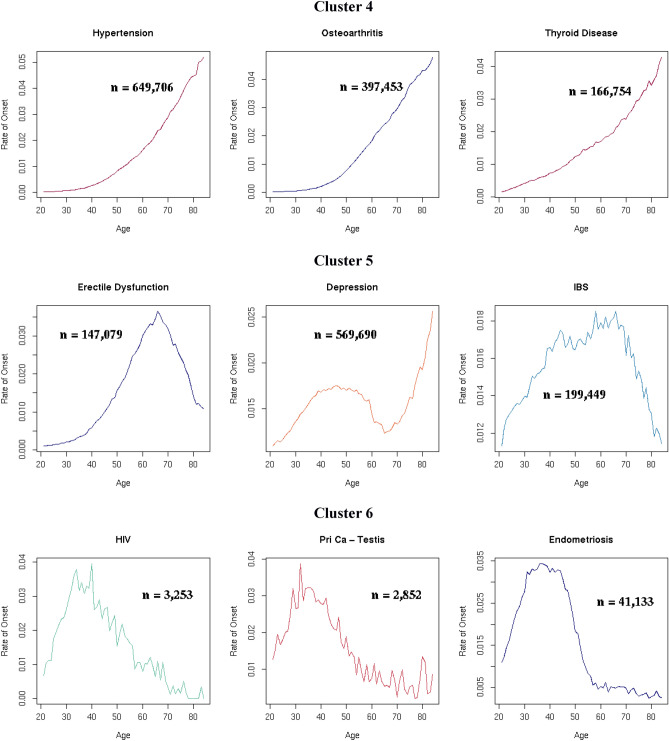
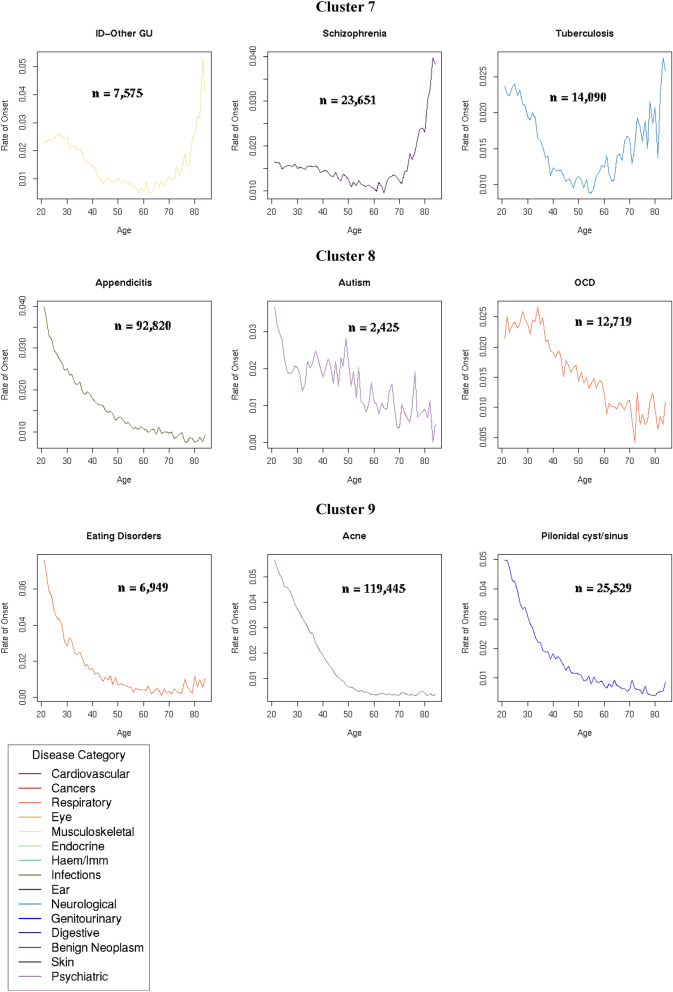
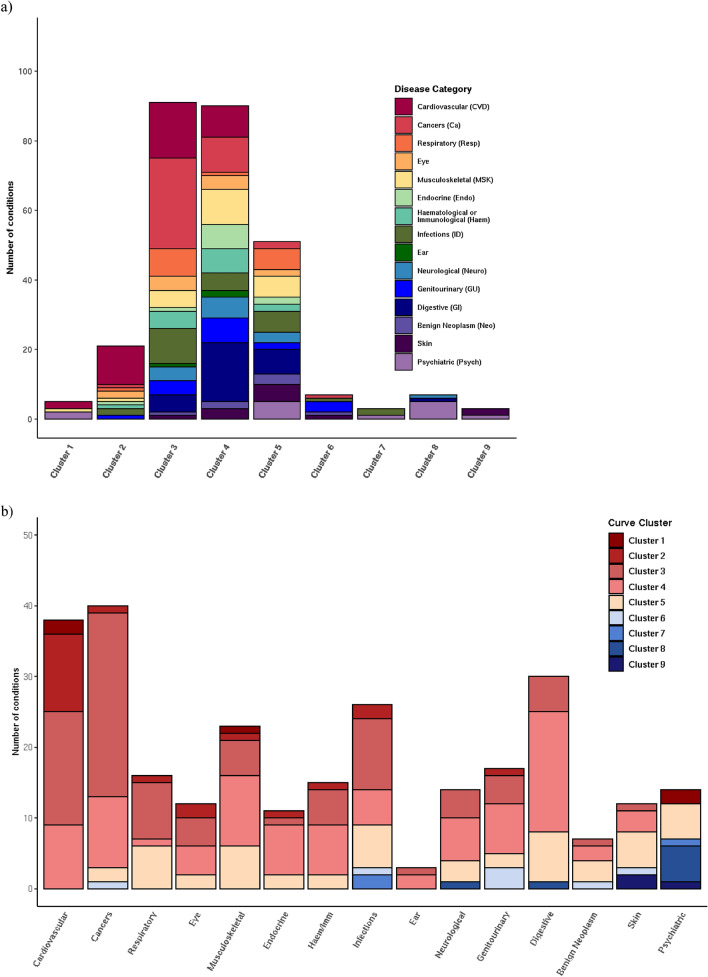
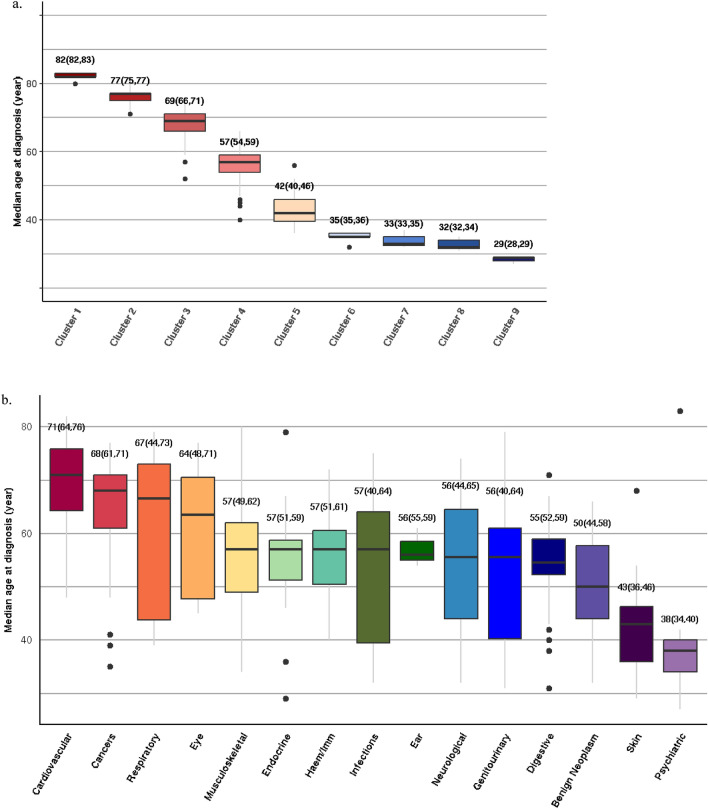
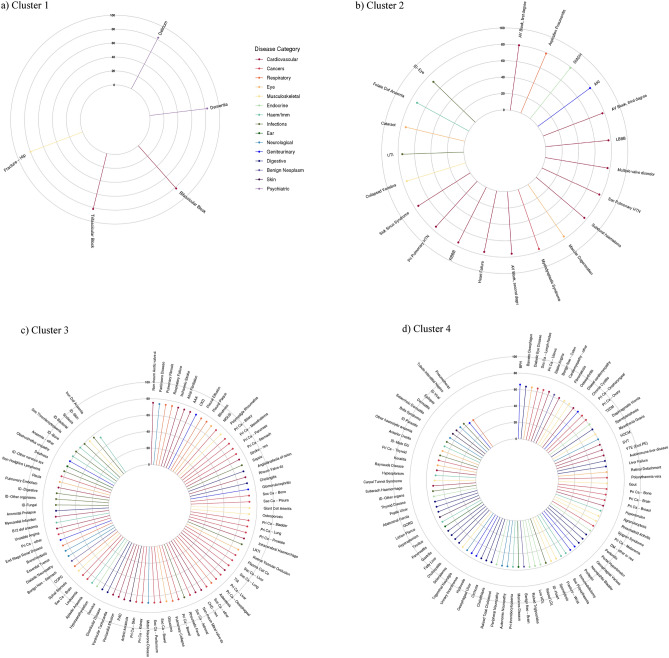
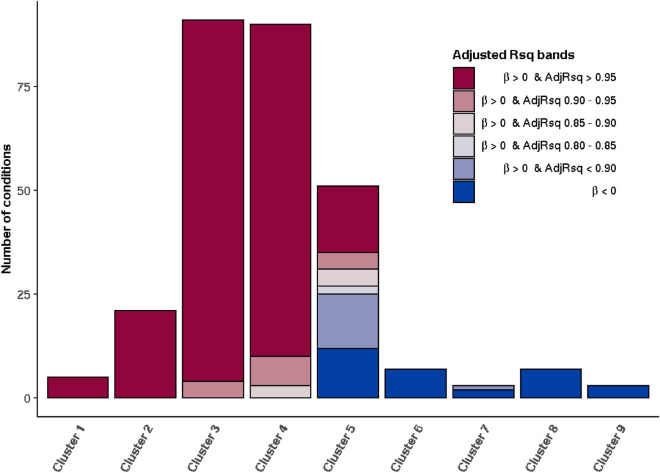
Reducing the burden of late-life morbidity requires an understanding of the mechanisms of ageing-related diseases (ARDs), defined as diseases that accumulate with increasing age. This has been hampered by the lack of formal criteria to identify ARDs. Here, we present a framework to identify ARDs using two complementary methods consisting of unsupervised machine learning and actuarial techniques, which we applied to electronic health records (EHRs) from 3,009,048 individuals in England using primary care data from the Clinical Practice Research Datalink (CPRD) linked to the Hospital Episode Statistics admitted patient care dataset between 1 April 2010 and 31 March 2015 (mean age 49.7 years (s.d. 18.6), 51% female, 70% white ethnicity). We grouped 278 high-burden diseases into nine main clusters according to their patterns of disease onset, using a hierarchical agglomerative clustering algorithm. Four of these clusters, encompassing 207 diseases spanning diverse organ systems and clinical specialties, had rates of disease onset that clearly increased with chronological age. However, the ages of onset for these four clusters were strikingly different, with median age of onset 82 years (IQR 82-83) for Cluster 1, 77 years (IQR 75-77) for Cluster 2, 69 years (IQR 66-71) for Cluster 3 and 57 years (IQR 54-59) for Cluster 4. Fitting to ageing-related actuarial models confirmed that the vast majority of these 207 diseases had a high probability of being ageing-related. Cardiovascular diseases and cancers were highly represented, while benign neoplastic, skin and psychiatric conditions were largely absent from the four ageing-related clusters. Our framework identifies and clusters ARDs and can form the basis for fundamental and translational research into ageing pathways.


Conflict of interest statement

DN is on the steering group for grants funded by Glaxo Smith Kline and her team was subcontracted by Informatica to carry out the analyses of the National CKD Audit. RTL reports grants from Pfizer. ICKW is a member of the Independent Scientific Advisory Committee (ISAC) of Clinical Practice Research Datalink (CPRD). VK, HCF, MH, SD, AGI, KD, RM, CAP, RS, JPC, JMT, HH, LP and ADH declare no potential competing interest.

Figures

Figure 1
Figure 1
Algorithm for determining the likelihood that a disease is ageing-related. This depends on β, the age coefficient of the Gompertz model and the adjusted R2 of the Gompertz–Makeham model for each disease. qx is the age-specific rate of disease onset at age x. α, β, a, b, and c are constants.
Figure 2
Figure 2
(a) In a data-driven approach, hierarchical clustering techniques were used to derive nine clusters of standardised age-specific rate of disease onset curves. The y-axis scales differ for each cluster. N (number of conditions in each cluster) is indicated in each cluster plot. (b) Age-specific rate of onset curves (not standardised) for examples from each cluster. The y-axis scales differ for each disease. The number of individuals between the ages of 20 and 85 years with the disease (n) is indicated in each plot.
Figure 2
Figure 2
(a) In a data-driven approach, hierarchical clustering techniques were used to derive nine clusters of standardised age-specific rate of disease onset curves. The y-axis scales differ for each cluster. N (number of conditions in each cluster) is indicated in each cluster plot. (b) Age-specific rate of onset curves (not standardised) for examples from each cluster. The y-axis scales differ for each disease. The number of individuals between the ages of 20 and 85 years with the disease (n) is indicated in each plot.
Figure 3
Figure 3
The relationship between disease category and age curve cluster for 278 diseases: (a) Diseases in each age cluster by disease category. (b) Diseases in each disease category by age curve cluster. The number of diseases in each disease category and age curve cluster is shown in Table 1.
Figure 4
Figure 4
Median age of onset for 278 diseases in each curve cluster and disease category: (a) Box and whisker plots of the median age of first recorded diagnosis above the age of 20 years for diseases in each curve cluster; (b) Box and whisker plots of the median age of first recorded diagnosis (above the age of 20 years) for the 289 conditions grouped into 15 disease categories. The horizontal line inside the boxes represents the median, the upper and lower edges of the boxes represent the 25th and 75th percentiles, and the end-points of the upper and lower whiskers represent the highest and lowest values within 1.5*IQR, where IQR is the interquartile range. Numbers above the boxes indicate the median (25th percentile, 75th percentile).
Figure 5
Figure 5
Median age of first recorded diagnosis above the age of 20 years for diseases in (a) Cluster 1, (b) Cluster 2, (c) Cluster 3 and (d) Cluster 4. Diseases are arranged in descending order of median age of first recorded diagnosis. AAA = abdominal aortic aneurysm; AKI = acute kidney injury; AV = atrioventricular; Benign Neo = benign neoplasm; CHD = coronary heart disease; CKD = chronic kidney disease; COPD = chronic obstructive pulmonary disease; DM = diabetes mellitus; dz = disease; GORD = gastroesophageal reflux disease; GU = genitourinary; HDL = high density lipoprotein cholesterol; HOCM = hypertrophic obstructive cardiomyopathy; HTN = hypertension; ID = infectious disease; LBBB = left bundle branch block; LDL = low density lipoprotein cholesterol; LRTI = lower respiratory tract infection; MGUS = monoclonal gammopathy of undetermined significance; nos = not otherwise specified; PAD = peripheral arterial disease; Pri Ca = primary cancer; RBBB = right bundle branch block; Sec Ca = secondary cancer; SIADH = syndrome of inappropriate antidiuretic hormone; SVT = supraventricular tachycardia; T2DM = type 2 diabetes; TIA = transient ischaemic attack; UTI = urinary tract infection; VTE (Excl PE) = venous thromboembolism excluding pulmonary embolism.
Figure 6
Figure 6
Number of diseases in each curve cluster for different adjusted R2 bands where β is positive, and number of diseases where β is negative. β is the coefficient of the age variable in the Gompertz model and the adjusted R2 value measures the goodness-of-fit of the Gompertz–Makeham model.

References

    1. Lopez-Otin C, et al. The hallmarks of aging. Cell. 2013;153(6):1194–1217. doi: 10.1016/j.cell.2013.05.039. - DOI - PMC - PubMed
    1. Partridge L, Deelen J, Slagboom PE. Facing up to the global challenges of ageing. Nature. 2018;561(7721):45–56. doi: 10.1038/s41586-018-0457-8. - DOI - PubMed
    1. Wheeler HE, Kim SK. Genetics and genomics of human ageing. Philos. Trans. R. Soc. Lond. B Biol. Sci. 2011;366(1561):43–50. doi: 10.1098/rstb.2010.0259. - DOI - PMC - PubMed
    1. Johnson SC, Dong X, Vijg J, Suh Y. Genetic evidence for common pathways in human age-related diseases. Aging Cell. 2015;14(5):809–817. doi: 10.1111/acel.12362. - DOI - PMC - PubMed
    1. Kennedy BK, Berger SL, Brunet A, Campisi J, Cuervo AM, Epel ES, et al. Geroscience: Linking aging to chronic disease. Cell. 2014;159(4):709–713. doi: 10.1016/j.cell.2014.10.039. - DOI - PMC - PubMed

Publication types