. 2021 Feb 3;4(1):155.
doi: 10.1038/s42003-020-01469-0.

DNA methylation patterns identify subgroups of pancreatic neuroendocrine tumors with clinical association

Collaborators, Affiliations

DNA methylation patterns identify subgroups of pancreatic neuroendocrine tumors with clinical association

Vanessa Lakis et al. Commun Biol. .

Abstract

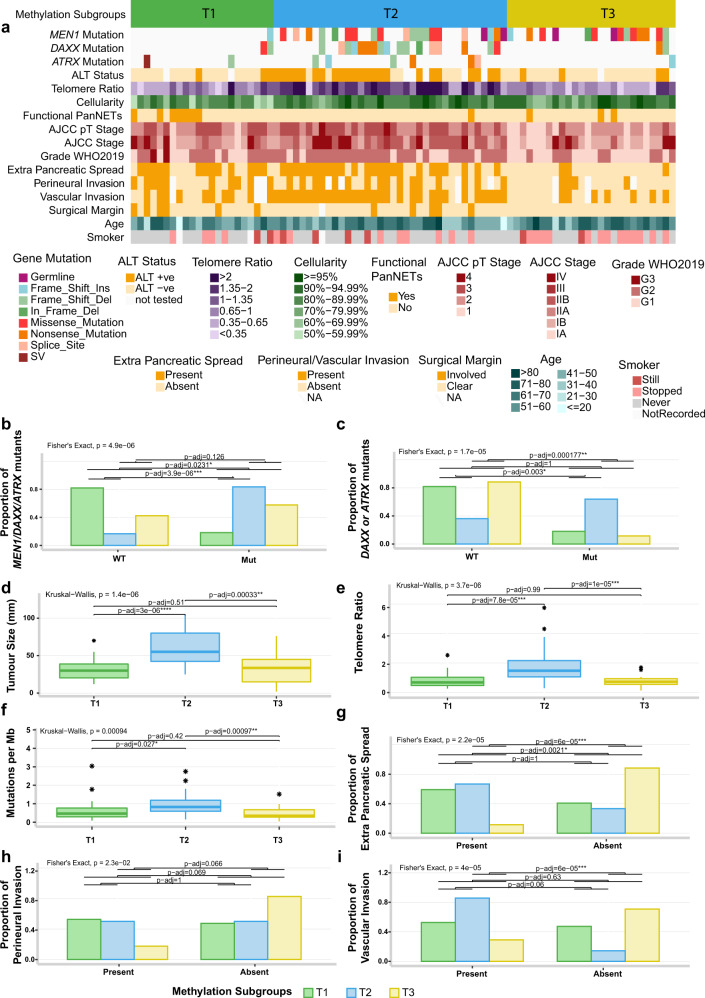
Here we report the DNA methylation profile of 84 sporadic pancreatic neuroendocrine tumors (PanNETs) with associated clinical and genomic information. We identified three subgroups of PanNETs, termed T1, T2 and T3, with distinct patterns of methylation. The T1 subgroup was enriched for functional tumors and ATRX, DAXX and MEN1 wild-type genotypes. The T2 subgroup contained tumors with mutations in ATRX, DAXX and MEN1 and recurrent patterns of chromosomal losses in half of the genome with no association between regions with recurrent loss and methylation levels. T2 tumors were larger and had lower methylation in the MGMT gene body, which showed positive correlation with gene expression. The T3 subgroup harboured mutations in MEN1 with recurrent loss of chromosome 11, was enriched for grade G1 tumors and showed histological parameters associated with better prognosis. Our results suggest a role for methylation in both driving tumorigenesis and potentially stratifying prognosis in PanNETs.


Conflict of interest statement

N.W. and J.V.P are co-founders and Board of genomiQa pty ltd. The other authors declare no competing interests.

Figures

Fig. 1
Fig. 1. PanNET subgroups identified by methylation profile and unsupervised hierarchical clustering across 84 primary tumours.
Tumours (columns) are presented in the same order as dichotomized clustering presented in Supplementary Fig. 1. a Relationship of subgroups with genomic and clinical features. b T1 subgroup shows significant enrichment of tumours wild-type for MEN1/DAXX/ATRX genes (Fisher’s exact test). c T2 subgroup tumours are enriched for mutations in ATRX and DAXX genes (Fisher’s exact test). d T2 subgroup tumours were larger than those in the other two subgroups (Wilcoxon’s rank-sum test). e T2 subgroup tumours had significant longer telomeres (Wilcoxon’s rank-sum test). f T2 subgroup tumours harboured more mutations per megabase (Mb) than tumours in other subgroups (Wilcoxon’s rank-sum test). g T3 subgroup tumours presented significant less extra-pancreatic spread than tumours in the other subgroups (Fisher’s exact test). h T3 subgroup tumours had a trend towards less perineural invasion. i T3 subgroup tumours had less vascular invasion than the other two subgroups. ALT status: alternative lengthening of telomeres assessed using C-Tailing qPCR; ALT+ve: positive for ALT, ALT−ve: negative for ALT; Telomere Ratio: reads with telomeric repeats were counted in both the tumour and matched normal sample and normalized to the mean genomic coverage of the sample using qMotif for both the tumour and matched normal sample and the ratio gives us an indication of shortening or lengthening in relation to normal sample. Functional PanNETs: tumours that overproduce biologically active hormone. The box within the boxplots represents a range of values from the first to third quantile and the line within represents the median value of the distribution. The whiskers represent the maximum and minimum values of the distribution excluding outliers and an asterisk represents any outlier.
Fig. 2
Fig. 2. Association of methylation subgroups with genomic features.
Tumour (columns) are presented in the same order as dichotomized clustering presented in Supplementary Fig. 1. a Mutations in ATRX, DAXX and MEN1 genes, alternative lengthening of telomeres (ALT) and telomere length. b Proportion of the chromosomes arms affected by LOH. c Median logR ratio across chromosome arms as a reference to copy number changes (by providing an estimate of the allelic ratio). Chromosomal arm copy number and LOH (rows) were clustered using Euclidian distances and Ward’s clustering method.
Fig. 3
Fig. 3. Methylation levels of the MGMT gene.
Tumour (columns) are presented in the same order as dichotomized clustering presented in Supplementary Fig. 1. a Heat map showing methylation levels across 156 CpG sites mapped to the MGMT gene, which passed the filters. Probes are plotted by genomic coordinates from 5′ to 3′ direction. Forty-six CpGs sites indicated on the left were differentially methylated between tumour subgroups and correlated with MGMT gene expression as assessed in 47 cases with RNASeq data. Levels of methylation in normal adjacent pancreata of CpG sites mapped to the MGMT gene is presented on the right. b Correlation of methylation median levels of 44 CpG sites located in the MGMT gene body and MGMT expression in the 47 cases with RNASeq data. c Average levels of methylation of MGMT gene body CpG sites for tumours in subgroup T2 (n = 36) vs. subgroups T1 and T3 (n = 48). d Gene expression levels of MGMT gene across 47 cases with RNASeq data (T2 n = 17, T1 and T3 n = 30). The box within the boxplots represents a range of values from the first to third quantile and the line within represents the median value of the distribution. The whiskers represent the maximum and minimum values of the distribution excluding outliers and an asterisk represents any outlier.

References

    1. Klöppel, G. et al. in WHO Classification of Tumours. Digestive System Tumours (ed. World Health Organization) 5th edn, 343–372 (International Agency for Research on Cancer, 2019).
    1. Scarpa A, et al. Whole-genome landscape of pancreatic neuroendocrine tumours. Nature. 2017;543:65–71. doi: 10.1038/nature21063. - DOI - PubMed
    1. Marinoni I, et al. Hypo-methylation mediates chromosomal instability in pancreatic NET. Endocr. Relat. Cancer. 2017;24:137–146. doi: 10.1530/ERC-16-0554. - DOI - PubMed
    1. Chan CS, et al. ATRX, DAXX or MEN1 mutant pancreatic neuroendocrine tumors are a distinct alpha-cell signature subgroup. Nat. Commun. 2018;9:4158. doi: 10.1038/s41467-018-06498-2. - DOI - PMC - PubMed
    1. Lawrence B, et al. Recurrent loss of heterozygosity correlates with clinical outcome in pancreatic neuroendocrine cancer. NPJ Genome Med. 2018;3:18. doi: 10.1038/s41525-018-0058-3. - DOI - PMC - PubMed

Publication types

Substances