Review
. 2021 Mar;22(3):167-179.
doi: 10.1038/s41583-021-00428-w. Epub 2021 Feb 3.

Cognitive and behavioural flexibility: neural mechanisms and clinical considerations

Affiliations
Review

Cognitive and behavioural flexibility: neural mechanisms and clinical considerations

Lucina Q Uddin. Nat Rev Neurosci. 2021 Mar.

Abstract

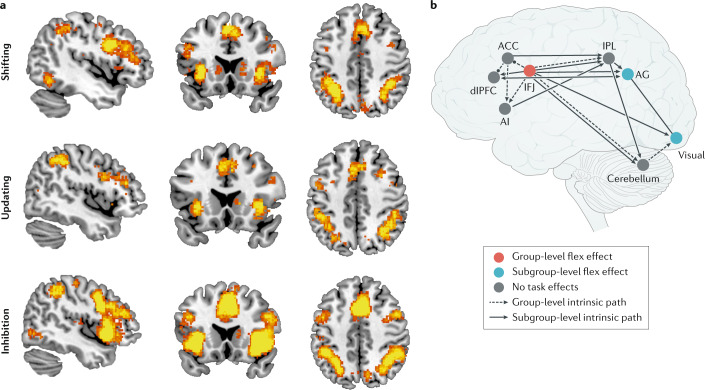
Cognitive and behavioural flexibility permit the appropriate adjustment of thoughts and behaviours in response to changing environmental demands. Brain mechanisms enabling flexibility have been examined using non-invasive neuroimaging and behavioural approaches in humans alongside pharmacological and lesion studies in animals. This work has identified large-scale functional brain networks encompassing lateral and orbital frontoparietal, midcingulo-insular and frontostriatal regions that support flexibility across the lifespan. Flexibility can be compromised in early-life neurodevelopmental disorders, clinical conditions that emerge during adolescence and late-life dementias. We critically evaluate evidence for the enhancement of flexibility through cognitive training, physical activity and bilingual experience.


Conflict of interest statement

The author declares no competing interests.

Figures

Fig. 1
Fig. 1. Core cognitive processes and brain network interactions underlying flexibility in the human brain.
a | Three latent variables that constitute executive function are referred to as ‘shifting (flexibility)’, ‘updating (working memory)’ and ‘inhibition’. Automated meta-analyses of published functional neuroimaging studies can be conducted with Neurosynth, a Web-based platform that uses text mining to extract activation coordinates from studies reporting on a specific psychological term of interest and machine learning to estimate the likelihood that activation maps are associated with specific psychological terms, thus creating mapping between neural and cognitive states (see ref. for detailed methods). Neurosynth reveals that brain imaging studies including the terms ‘shifting’, ‘updating’ and ‘inhibition’ report highly overlapping patterns of activation in lateral frontoparietal and midcingulo-insular brain regions, underscoring the difficulty of isolating the construct of flexibility from associated executive functions. a | Maps created by first, entering the terms ‘shifting’, ‘updating’ and ‘inhibition’ individually into Neurosynth; second, displaying the ‘uniformity test’ results to view z scores corresponding to the degree to which each voxel in the brain is consistently activated in studies that use each of the selected terms; third, downloading the resulting brain images (with thresholding at a false discovery rate of 0.01) in the form of NIfTi files; and fourth, displaying the brain images using the image viewer MRIcron with the following settings: 2.3 < z < 8 (scale); x = 45 (Montreal Neurological Institute (MNI) coordinate for sagittal slice), y = 19 (MNI coordinate for coronal slice) and z = 45 (MNI coordinate for axial slice). The uniformity test map depicts z scores from a one-way ANOVA testing whether the proportion of studies that report activation at a given voxel differs from the rate that would be expected if activations were uniformly distributed throughout grey matter. b | Brain regions supporting executive function and flexibility operate within the context of the broader networks shown in part a. During performance of a flexible item selection task, participants directly engage the inferior frontal junction (IFJ), which influences activity in other lateral frontoparietal and midcingulo-insular regions. ACC, anterior cingulate cortex; AG, angular gurus; AI, anterior insula; dlPFC, dorsolateral prefrontal cortex; IPL, inferior parietal lobule. Part b adapted with permission from ref., Massachusetts Institute of Technology.
Fig. 2
Fig. 2. Brain dynamics underlying individual differences in flexibility.
a | In sliding window dynamic functional connectivity analyses, time-varying patterns of connectivity between brain regions are quantified as follows. Whole-brain functional connectivity matrices computed for each window (for example, 45 seconds of functional MRI time-series data) are subjected to clustering, and each window is assigned to a ‘brain state’, here labelled 1, 2 and 3. b | Dynamic metrics, including frequency, dwell time and transitions between states, can then be computed on the basis of trajectories of brain state evolution over time. c | Brain states are ordered from most frequently occurring on the left (state 1, characterized by weak correlations among brain regions) to least frequently occurring on the right (state 5, characterized by strong correlations among brain regions). Higher executive function performance measured outside the scanner is associated with greater episodes of more frequently occurring states and fewer episodes of less frequently occurring states. In the colour bar, hot colours (red) represent high correlation values and cool colours (blue) represent low correlation values. WCST, Wisconsin Card Sorting Test. Parts a, b and c adapted with permission from, Elsevier.
Fig. 3
Fig. 3. Quantifying brain signal variability.
a | Mean squared successive difference is one approach for computing brain signal variability. Applied to neural time-series data, mean squared successive difference is calculated according to the equation shown. b | Regionally specific increases and decreases in brain signal variability across the lifespan may be associated with changes in behavioural performance. Brain signal variability decreases linearly across the lifespan in most brain regions, with the exception of the anterior insula, which exhibits linear age-related increases in variability. In early and late life, the speculation is that larger differences in variability between brain regions may lead to suboptimal behavioural performance. Optimal behavioural performance may be associated with a balance between high and low variability in different brain regions (black arrows) during midlife. Part b is adapted from ref., CC BY 4.0 (https://creativecommons.org/licenses/by/4.0/).

Similar articles

Cited by

References

    1. Moradian N, et al. The urgent need for integrated science to fight COVID-19 pandemic and beyond. J. Transl Med. 2020;18:205. doi: 10.1186/s12967-020-02364-2. - DOI - PMC - PubMed
    1. Diamond A, Lee K. Interventions shown to aid executive function development in children 4 to 12 years old. Science. 2011;333:959–964. doi: 10.1126/science.1204529. - DOI - PMC - PubMed
    1. Burt KB, Paysnick AA. Resilience in the transition to adulthood. Dev. Psychopathol. 2012;24:493–505. doi: 10.1017/S0954579412000119. - DOI - PubMed
    1. Burke SN, et al. What are the later life contributions to reserve, resilience, and compensation? Neurobiol. Aging. 2019;83:140–144. doi: 10.1016/j.neurobiolaging.2019.03.023. - DOI - PMC - PubMed
    1. Scott WA. Cognitive complexity and cognitive flexibility. Sociometry. 1962;25:405–414. doi: 10.2307/2785779. - DOI

Publication types