. 2021 Feb;590(7847):642-648.
doi: 10.1038/s41586-020-03147-x. Epub 2021 Feb 3.

A gene-environment-induced epigenetic program initiates tumorigenesis

Affiliations

A gene-environment-induced epigenetic program initiates tumorigenesis

Direna Alonso-Curbelo et al. Nature. 2021 Feb.

Abstract

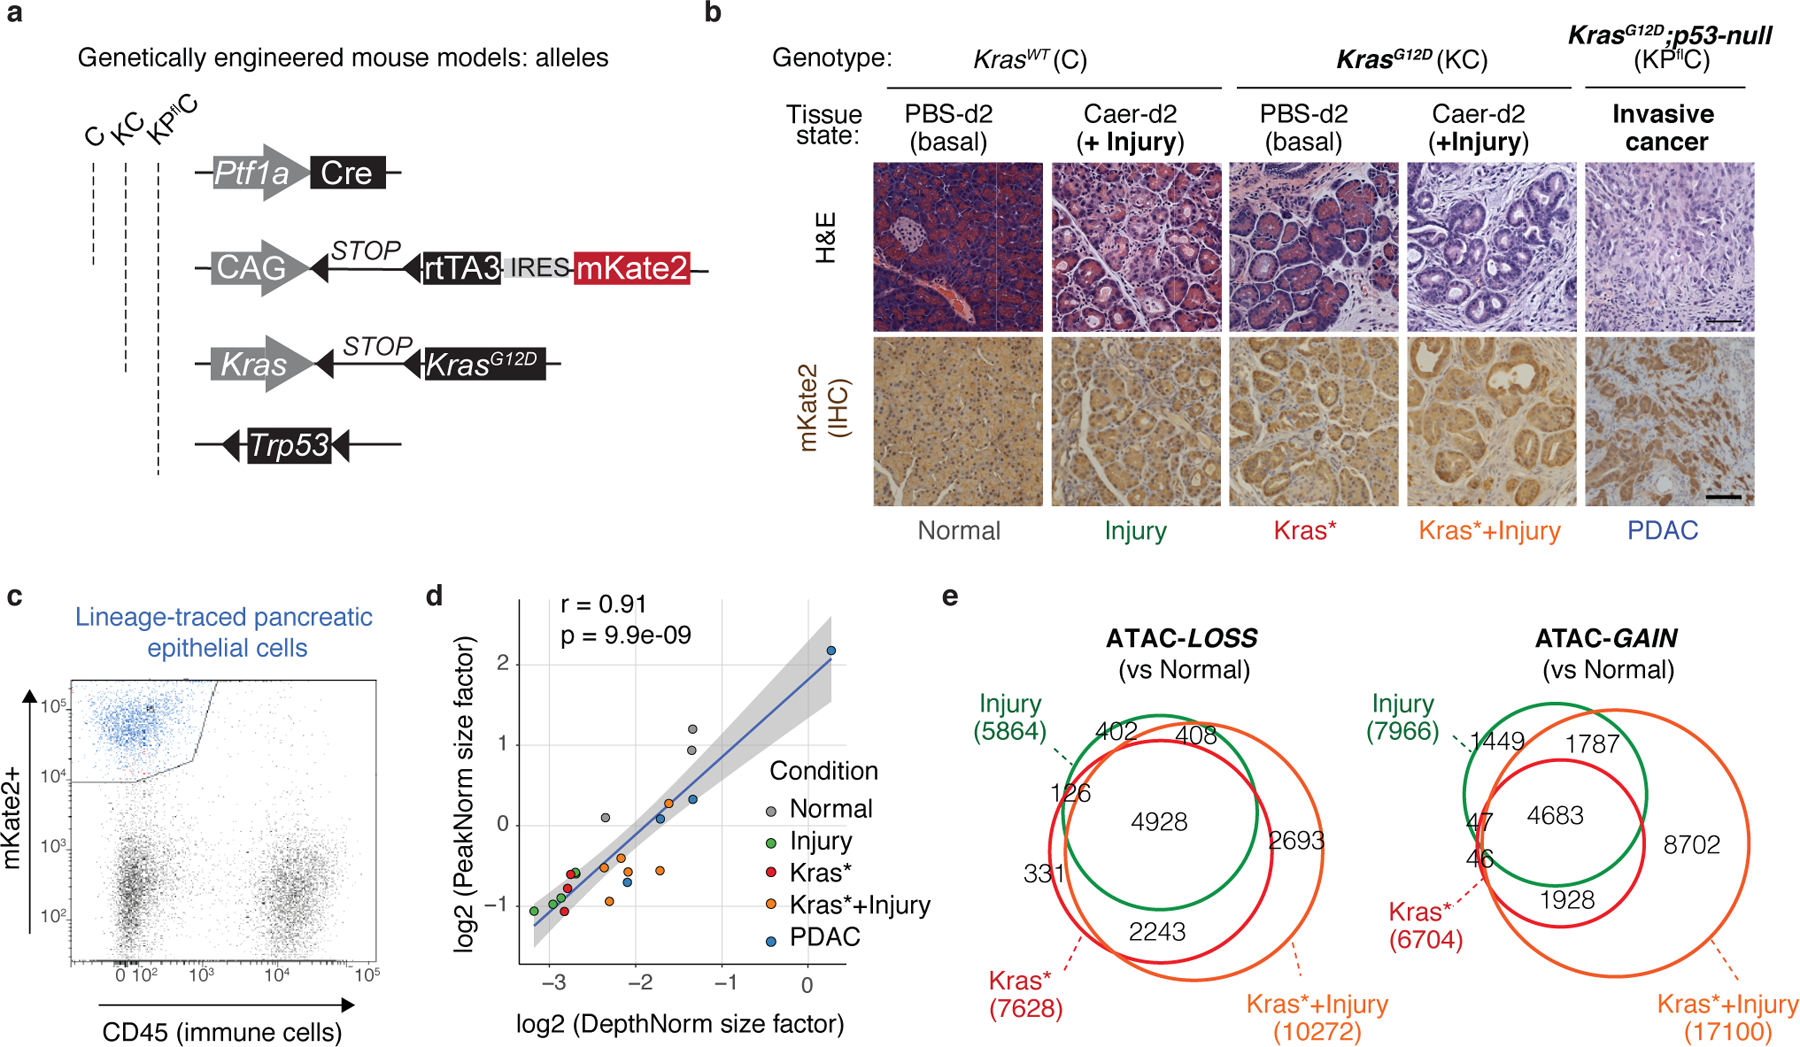
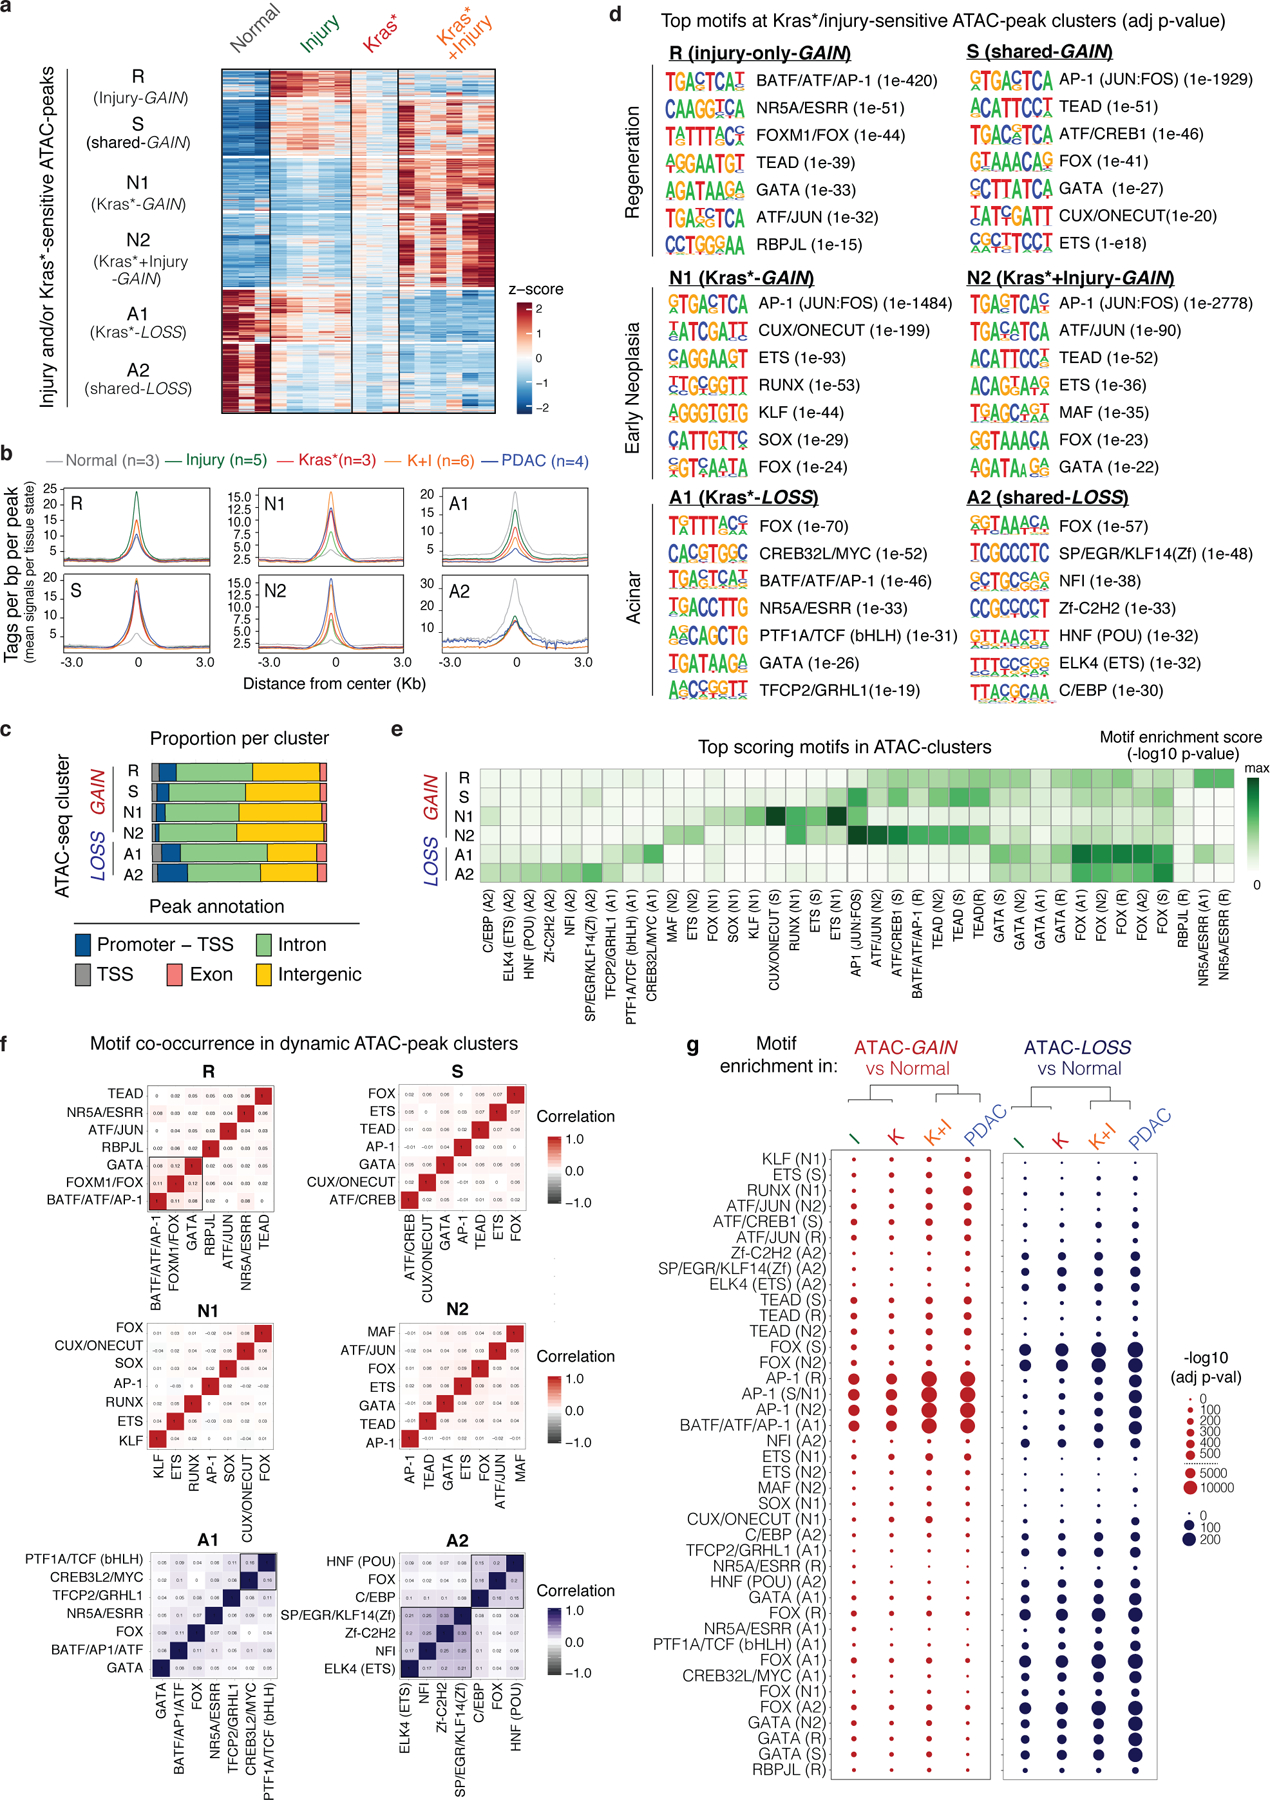
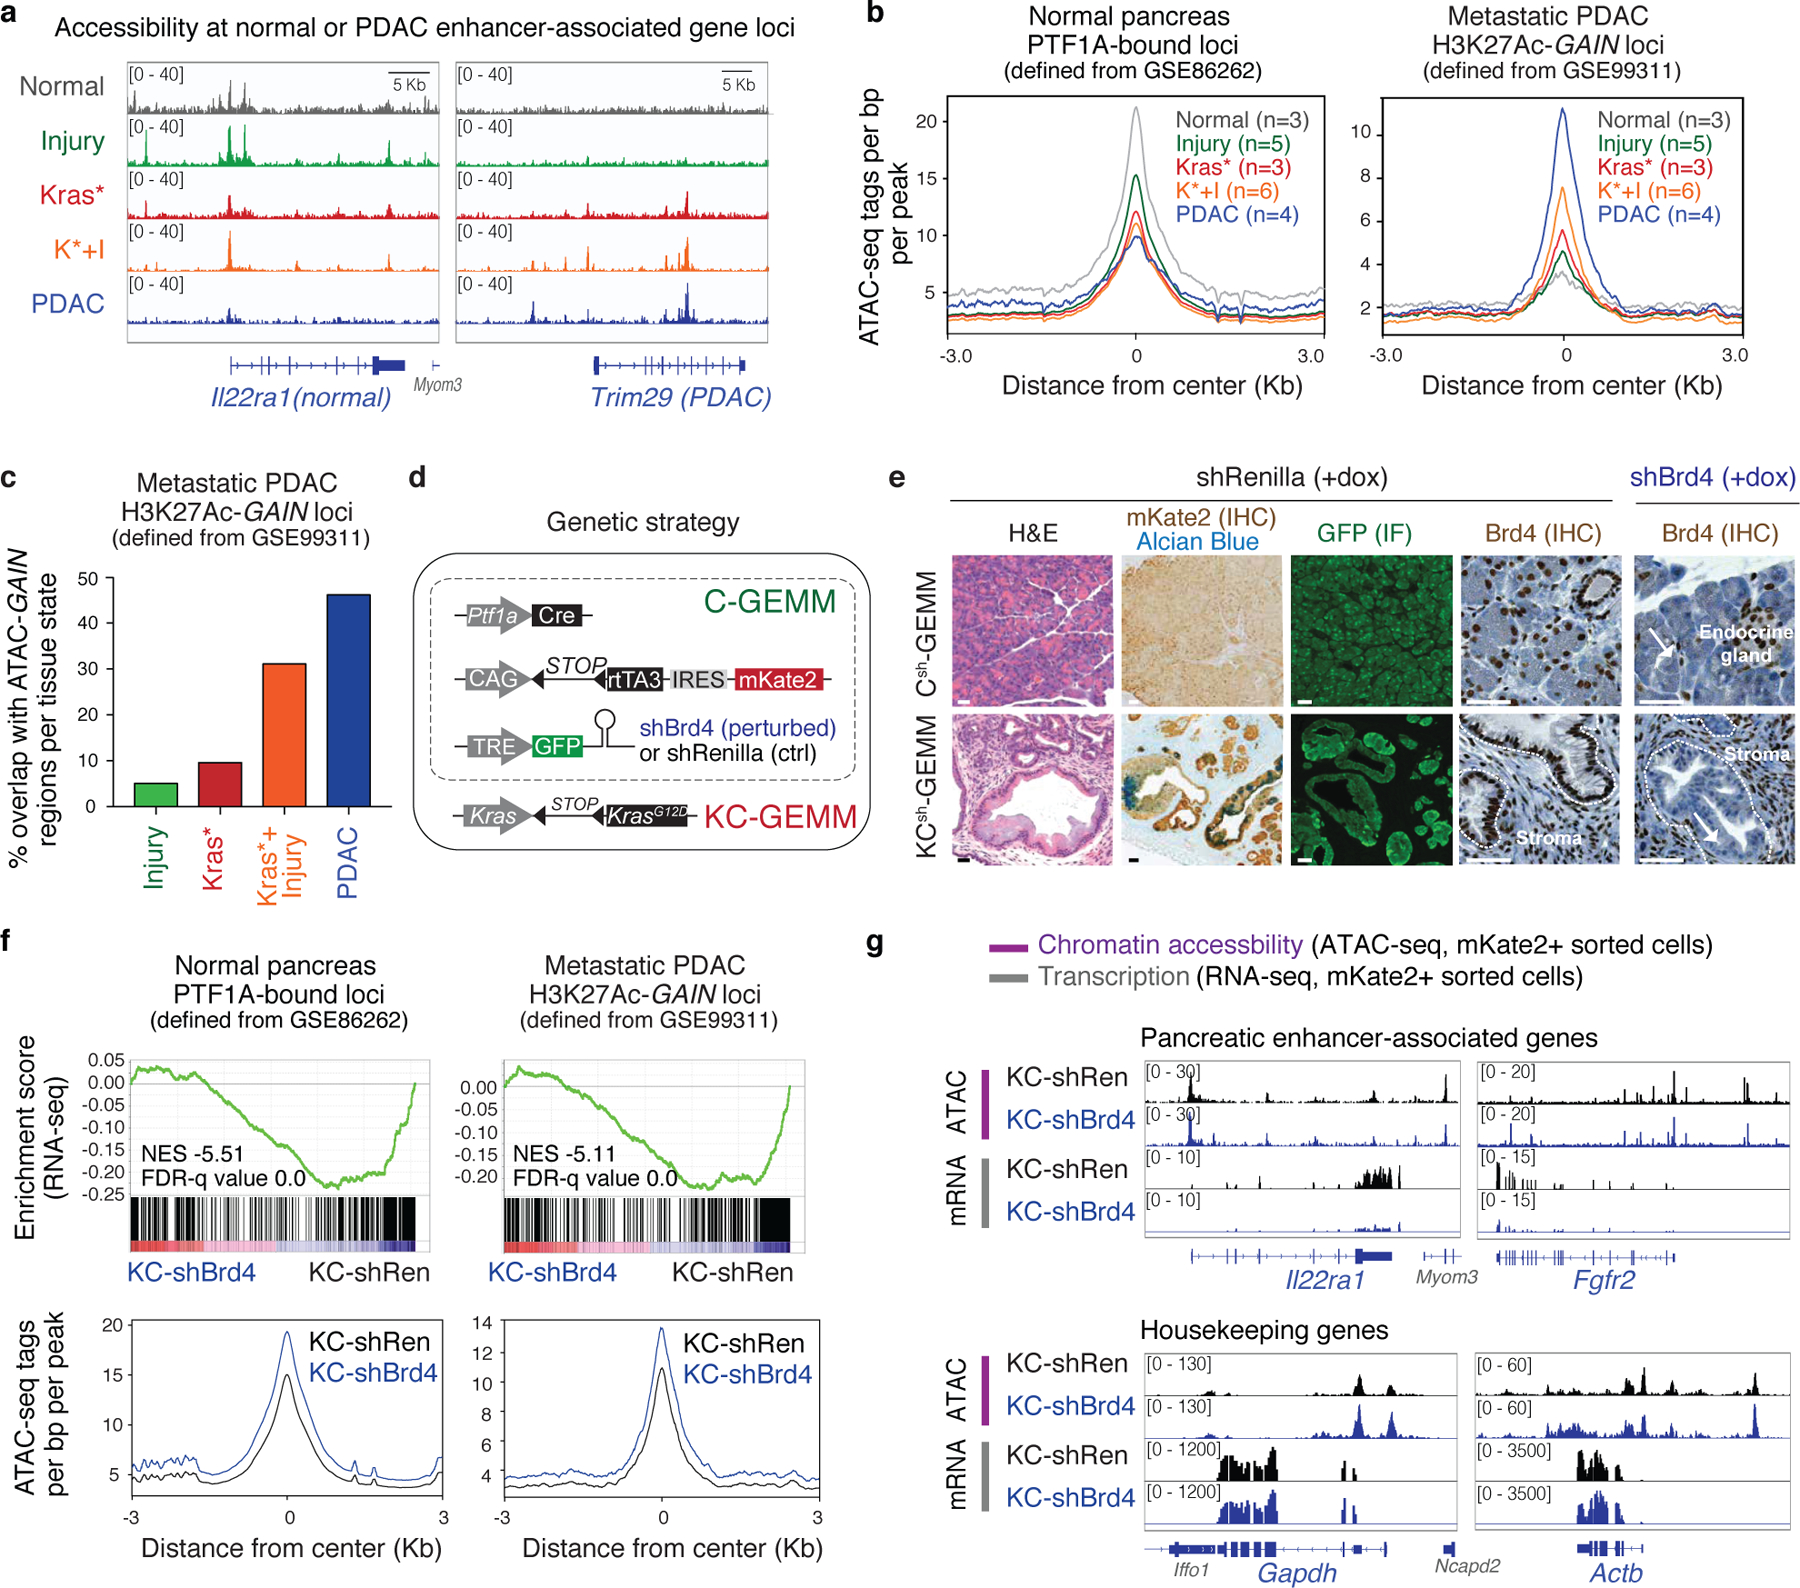
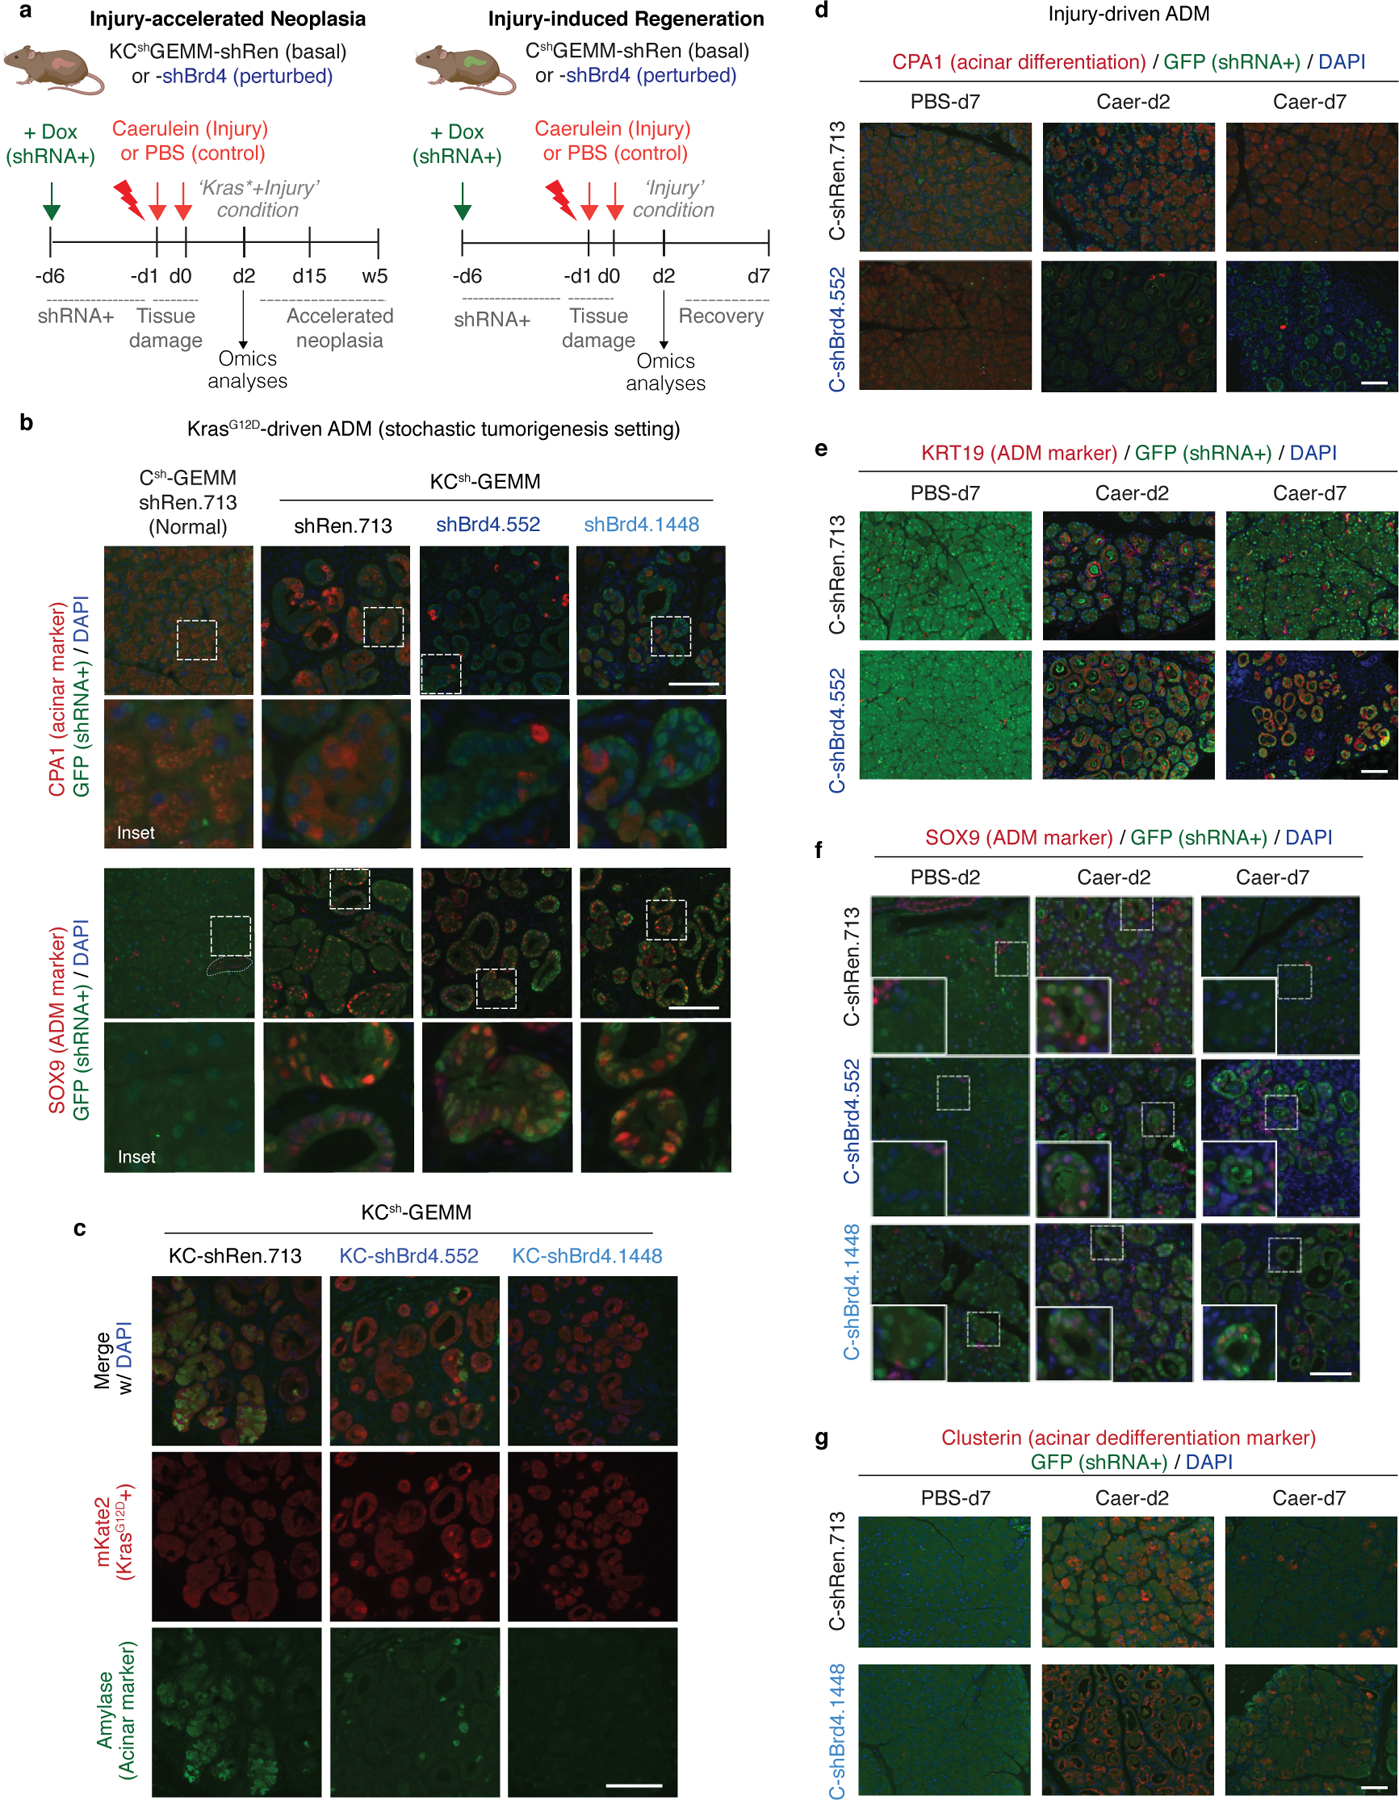
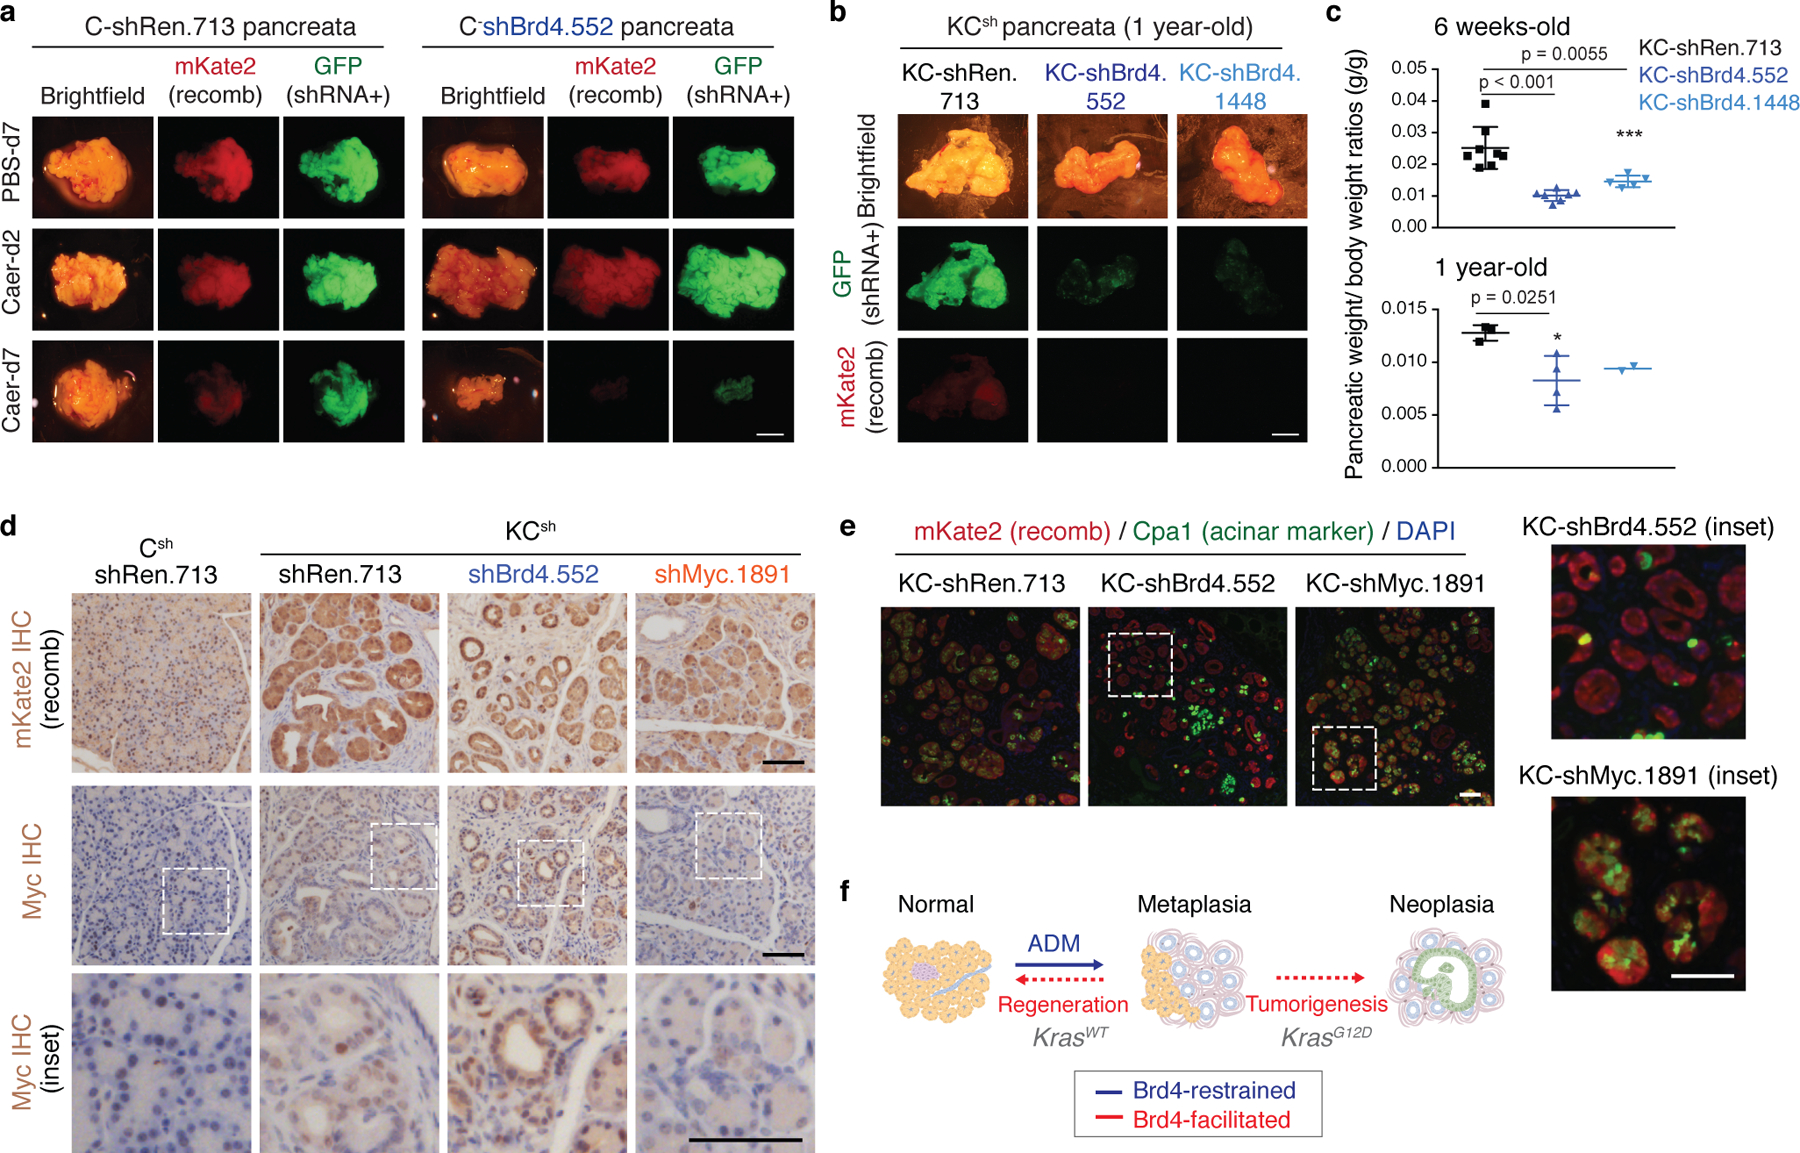
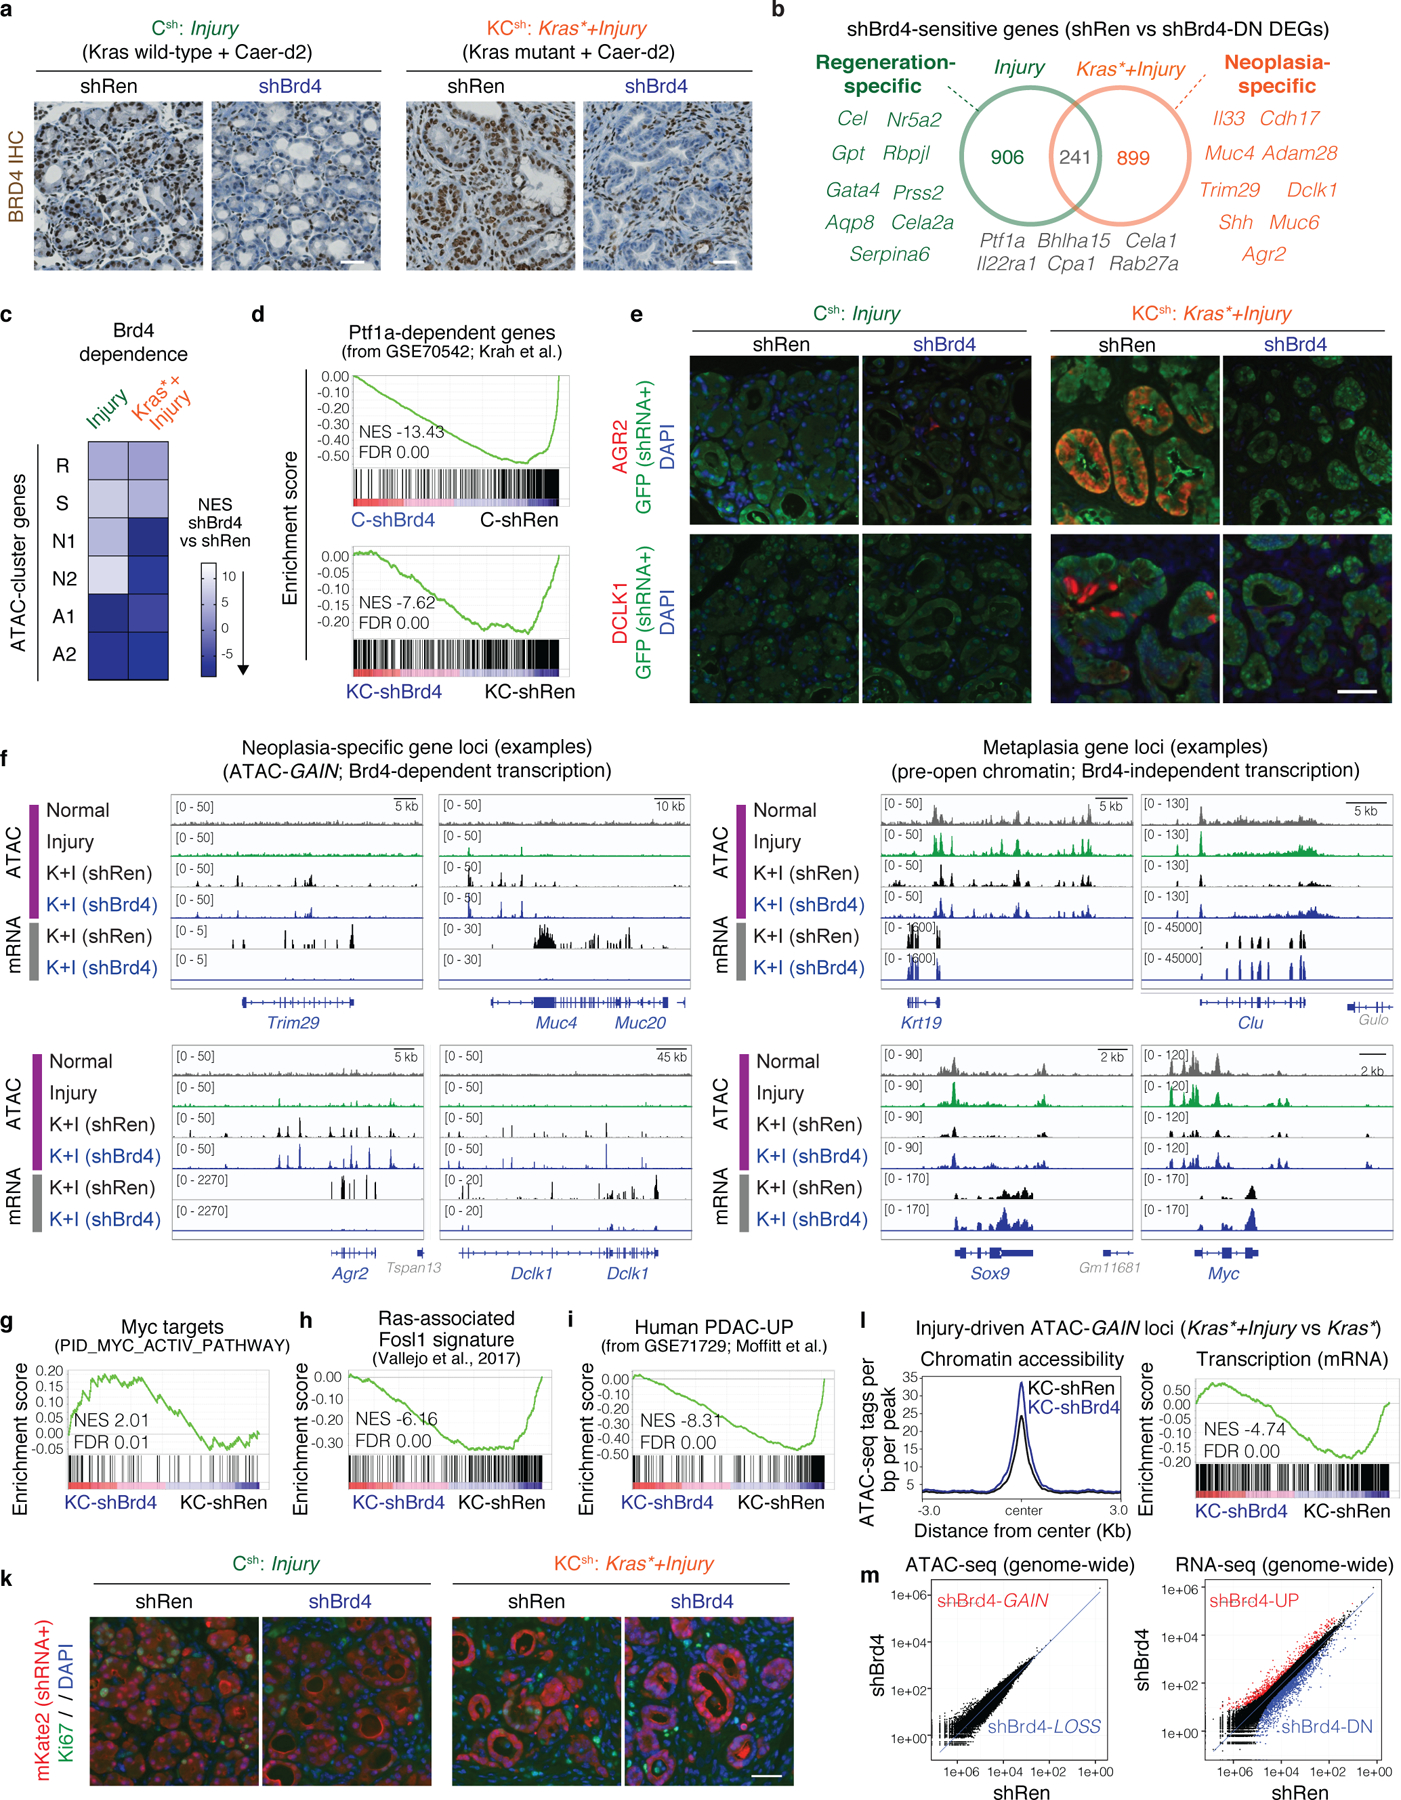
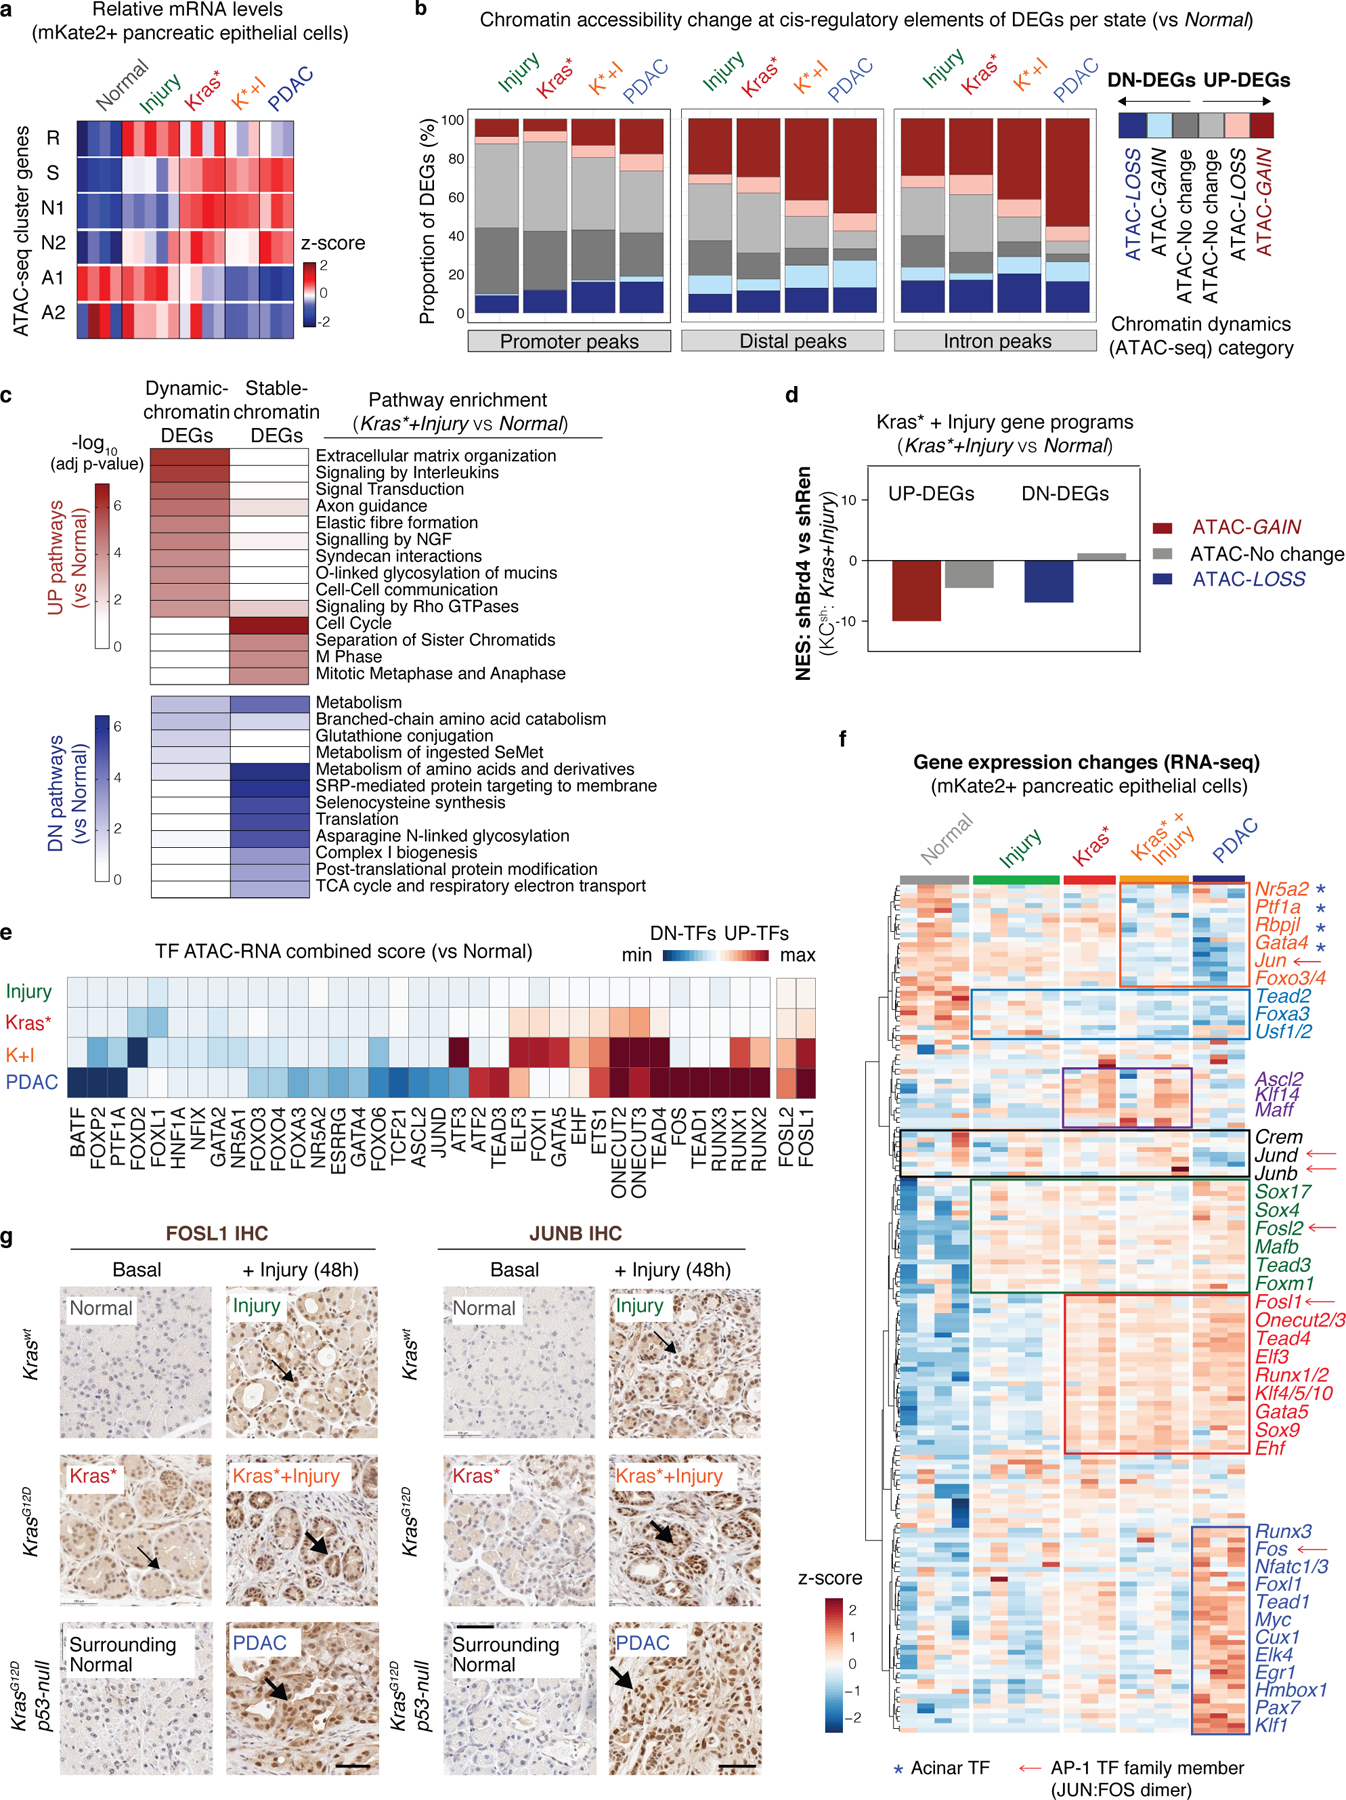
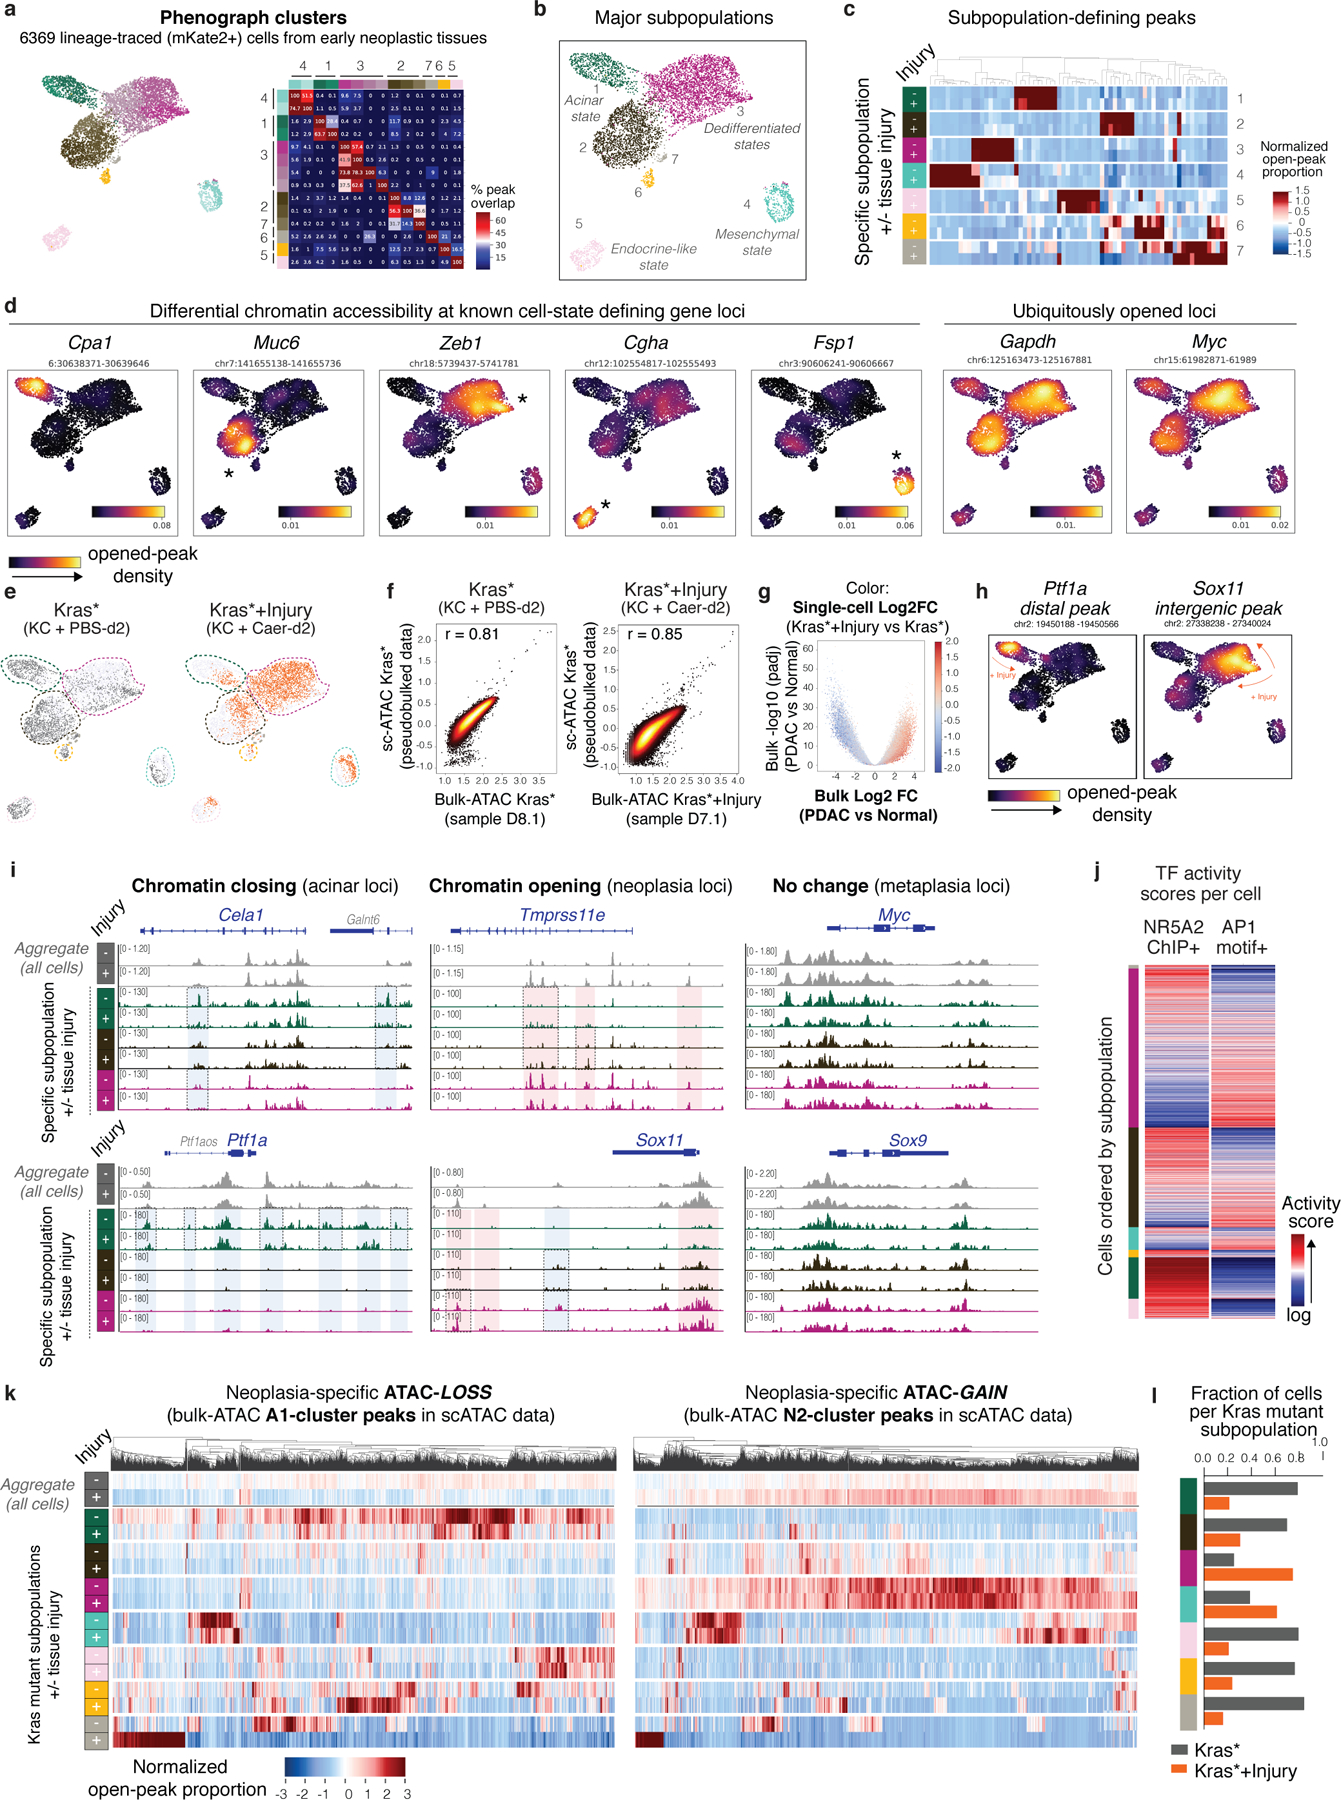
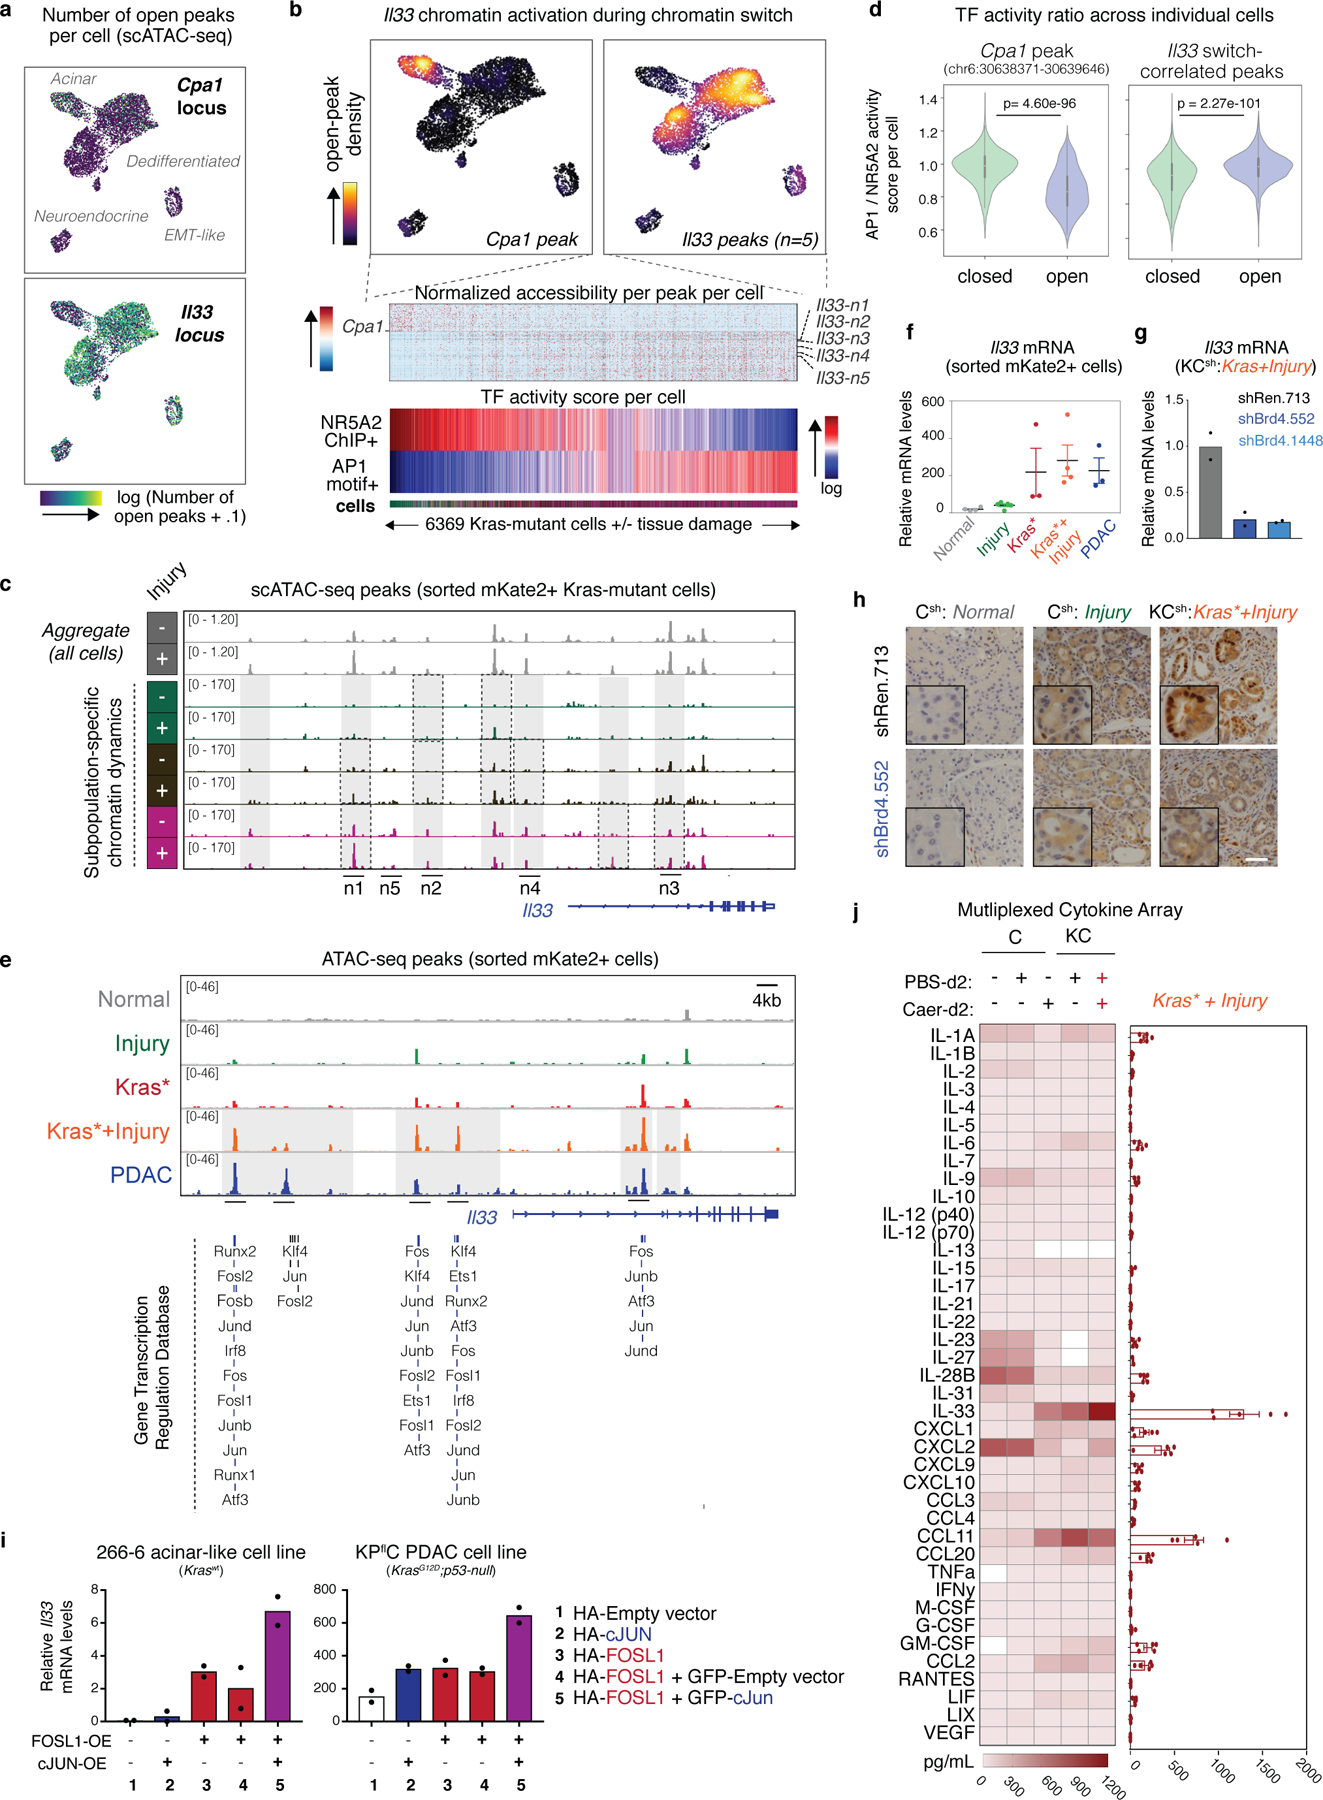
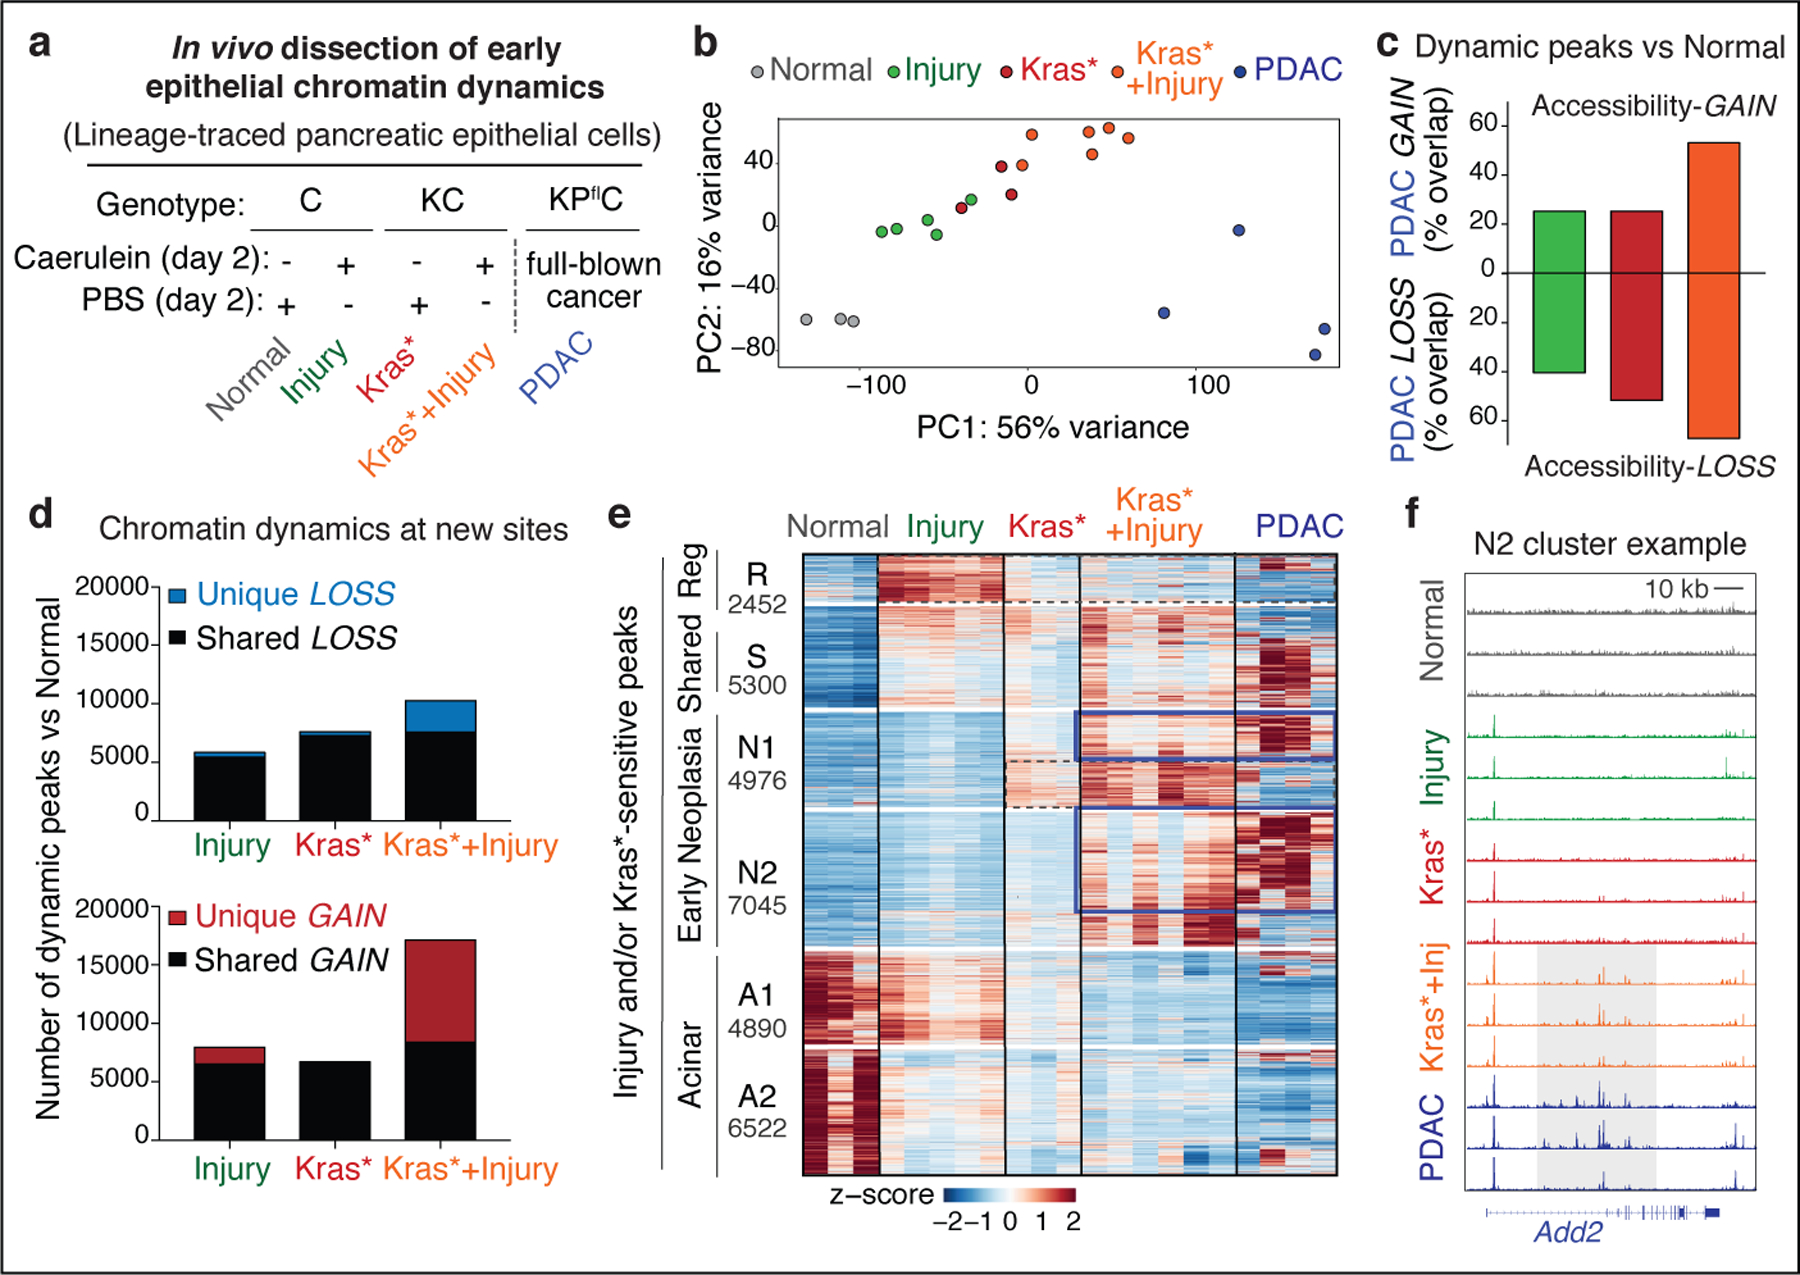
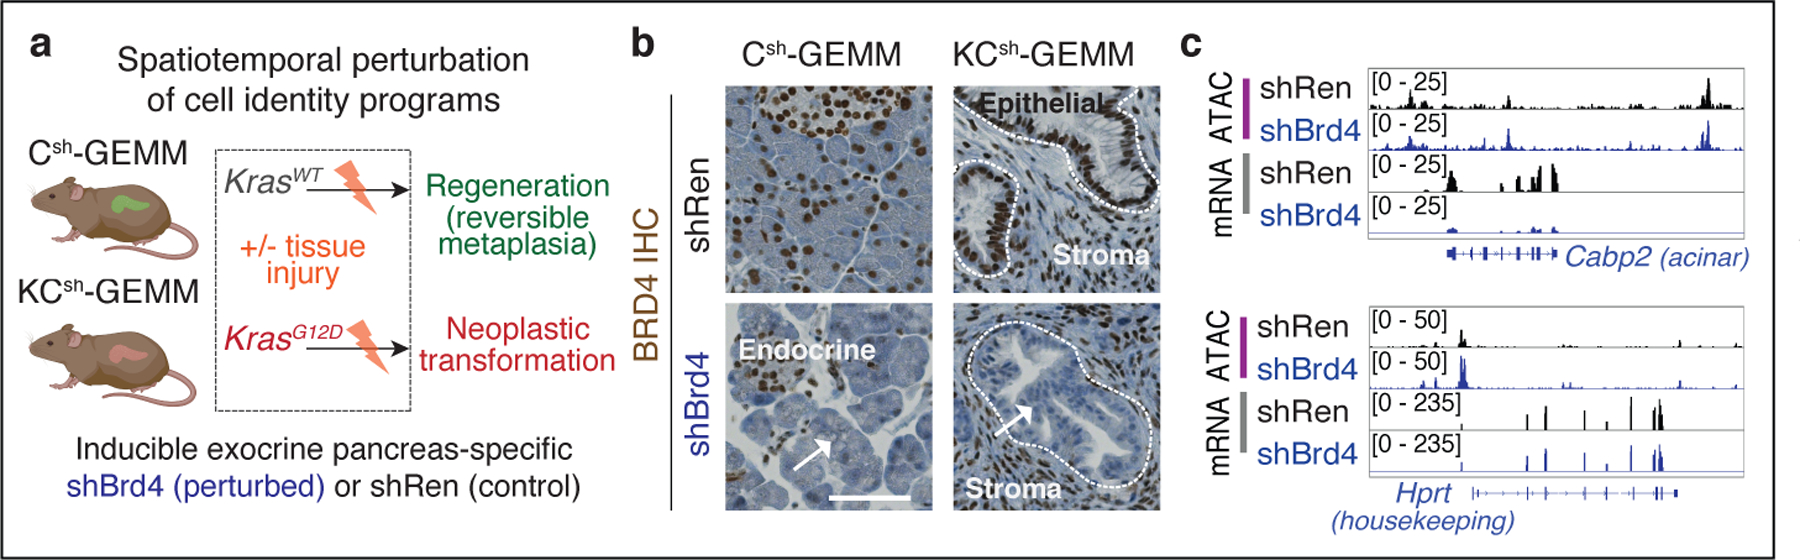
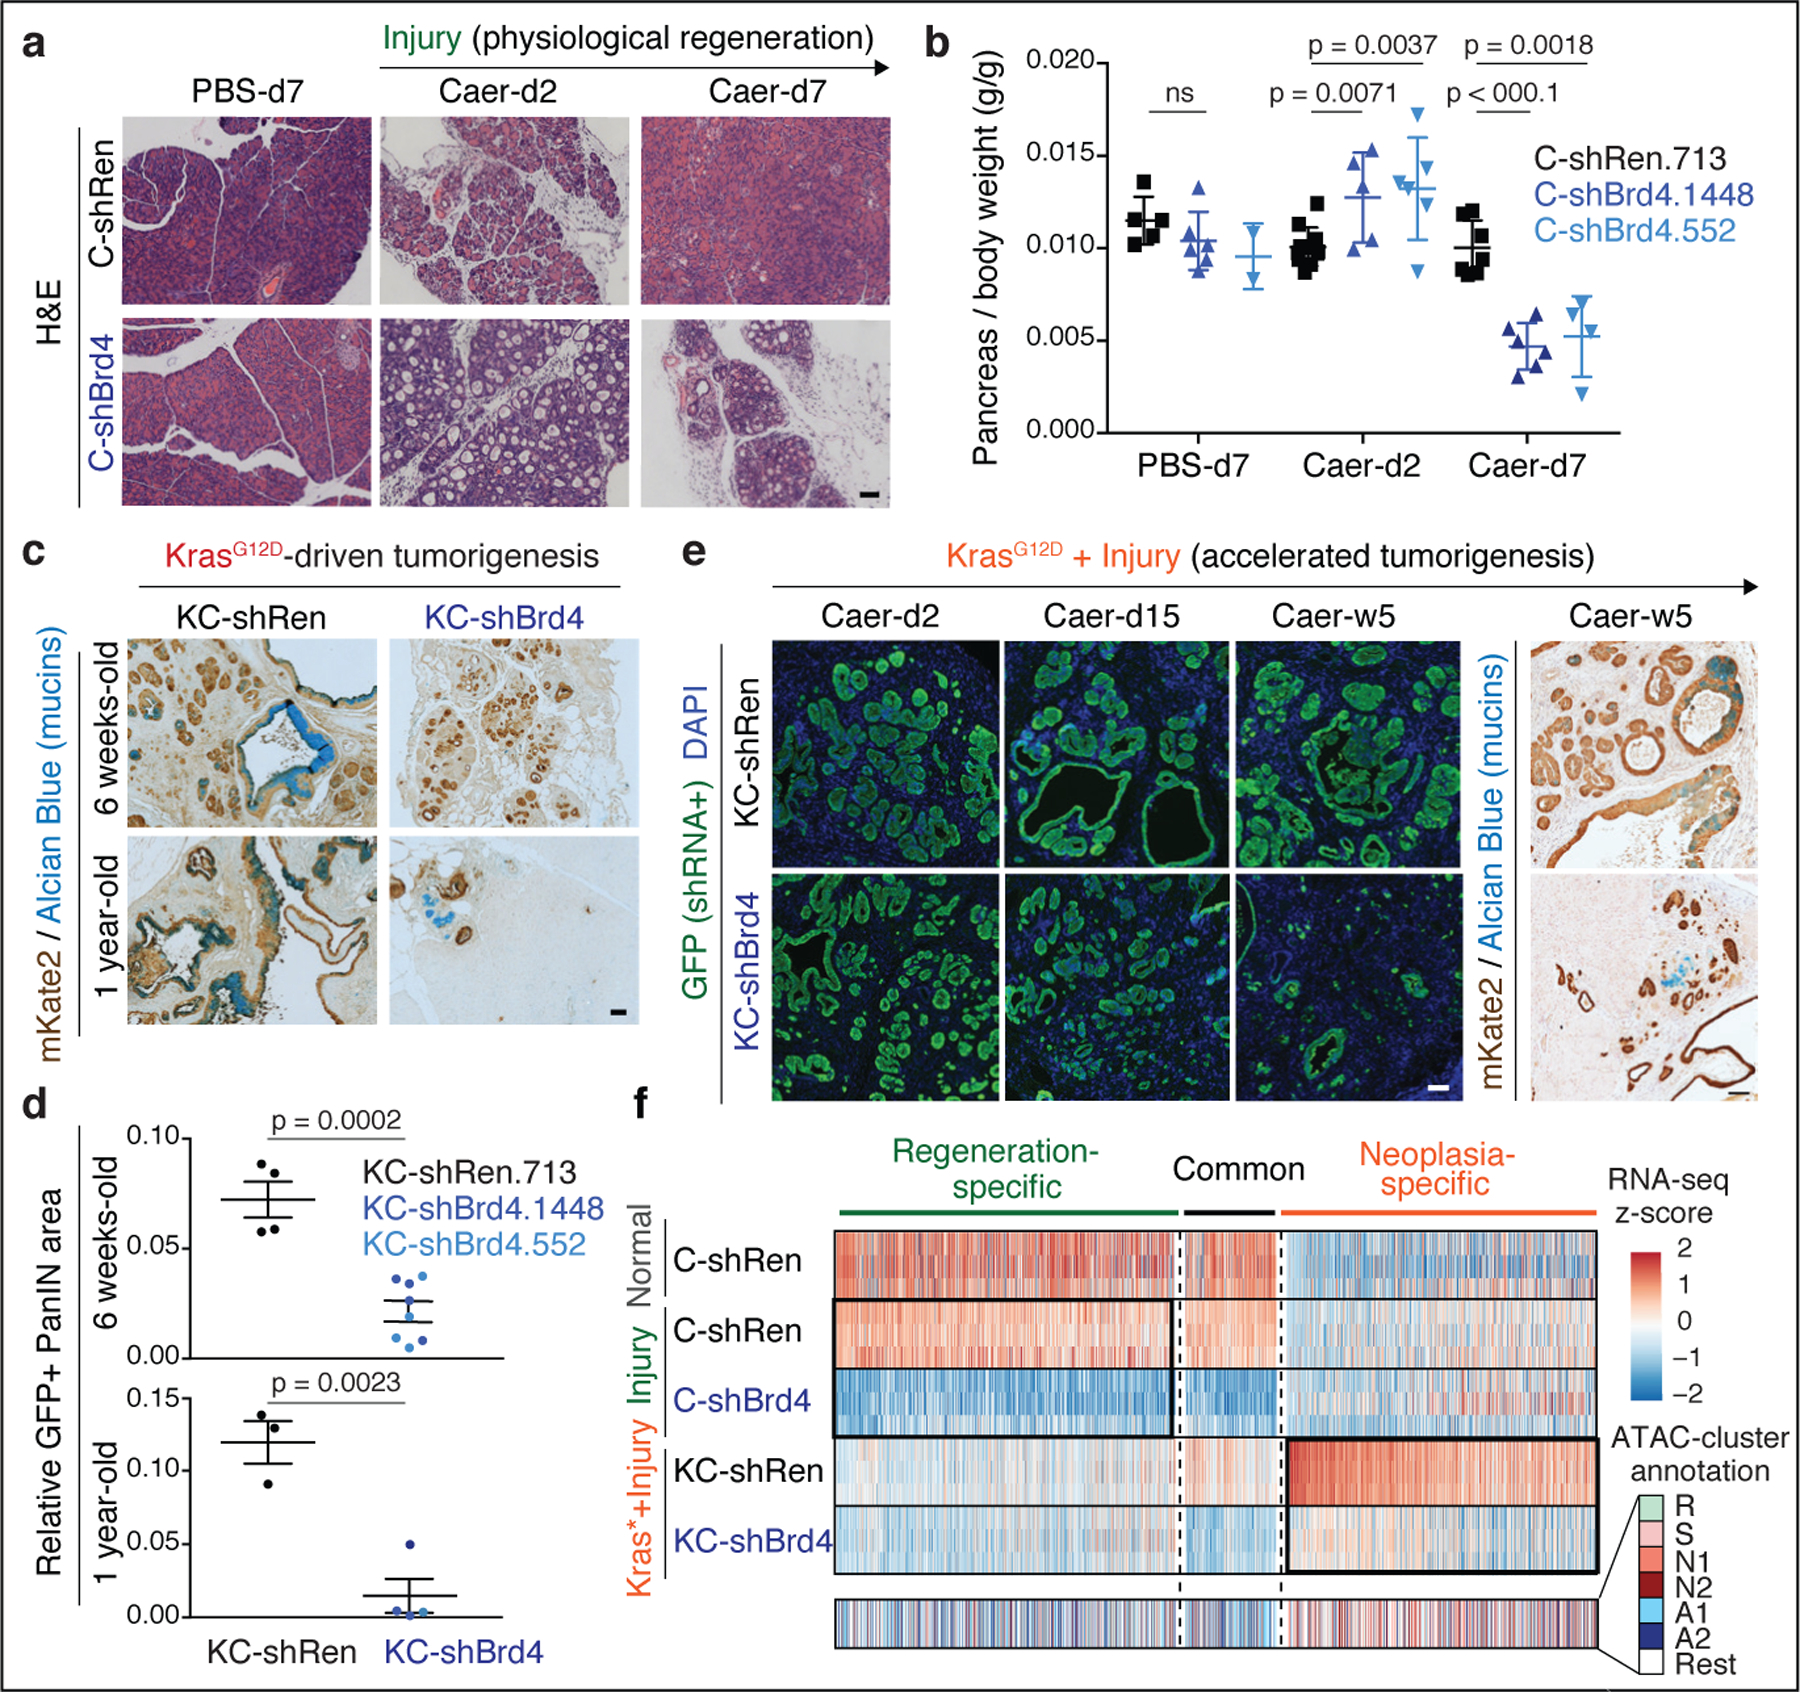
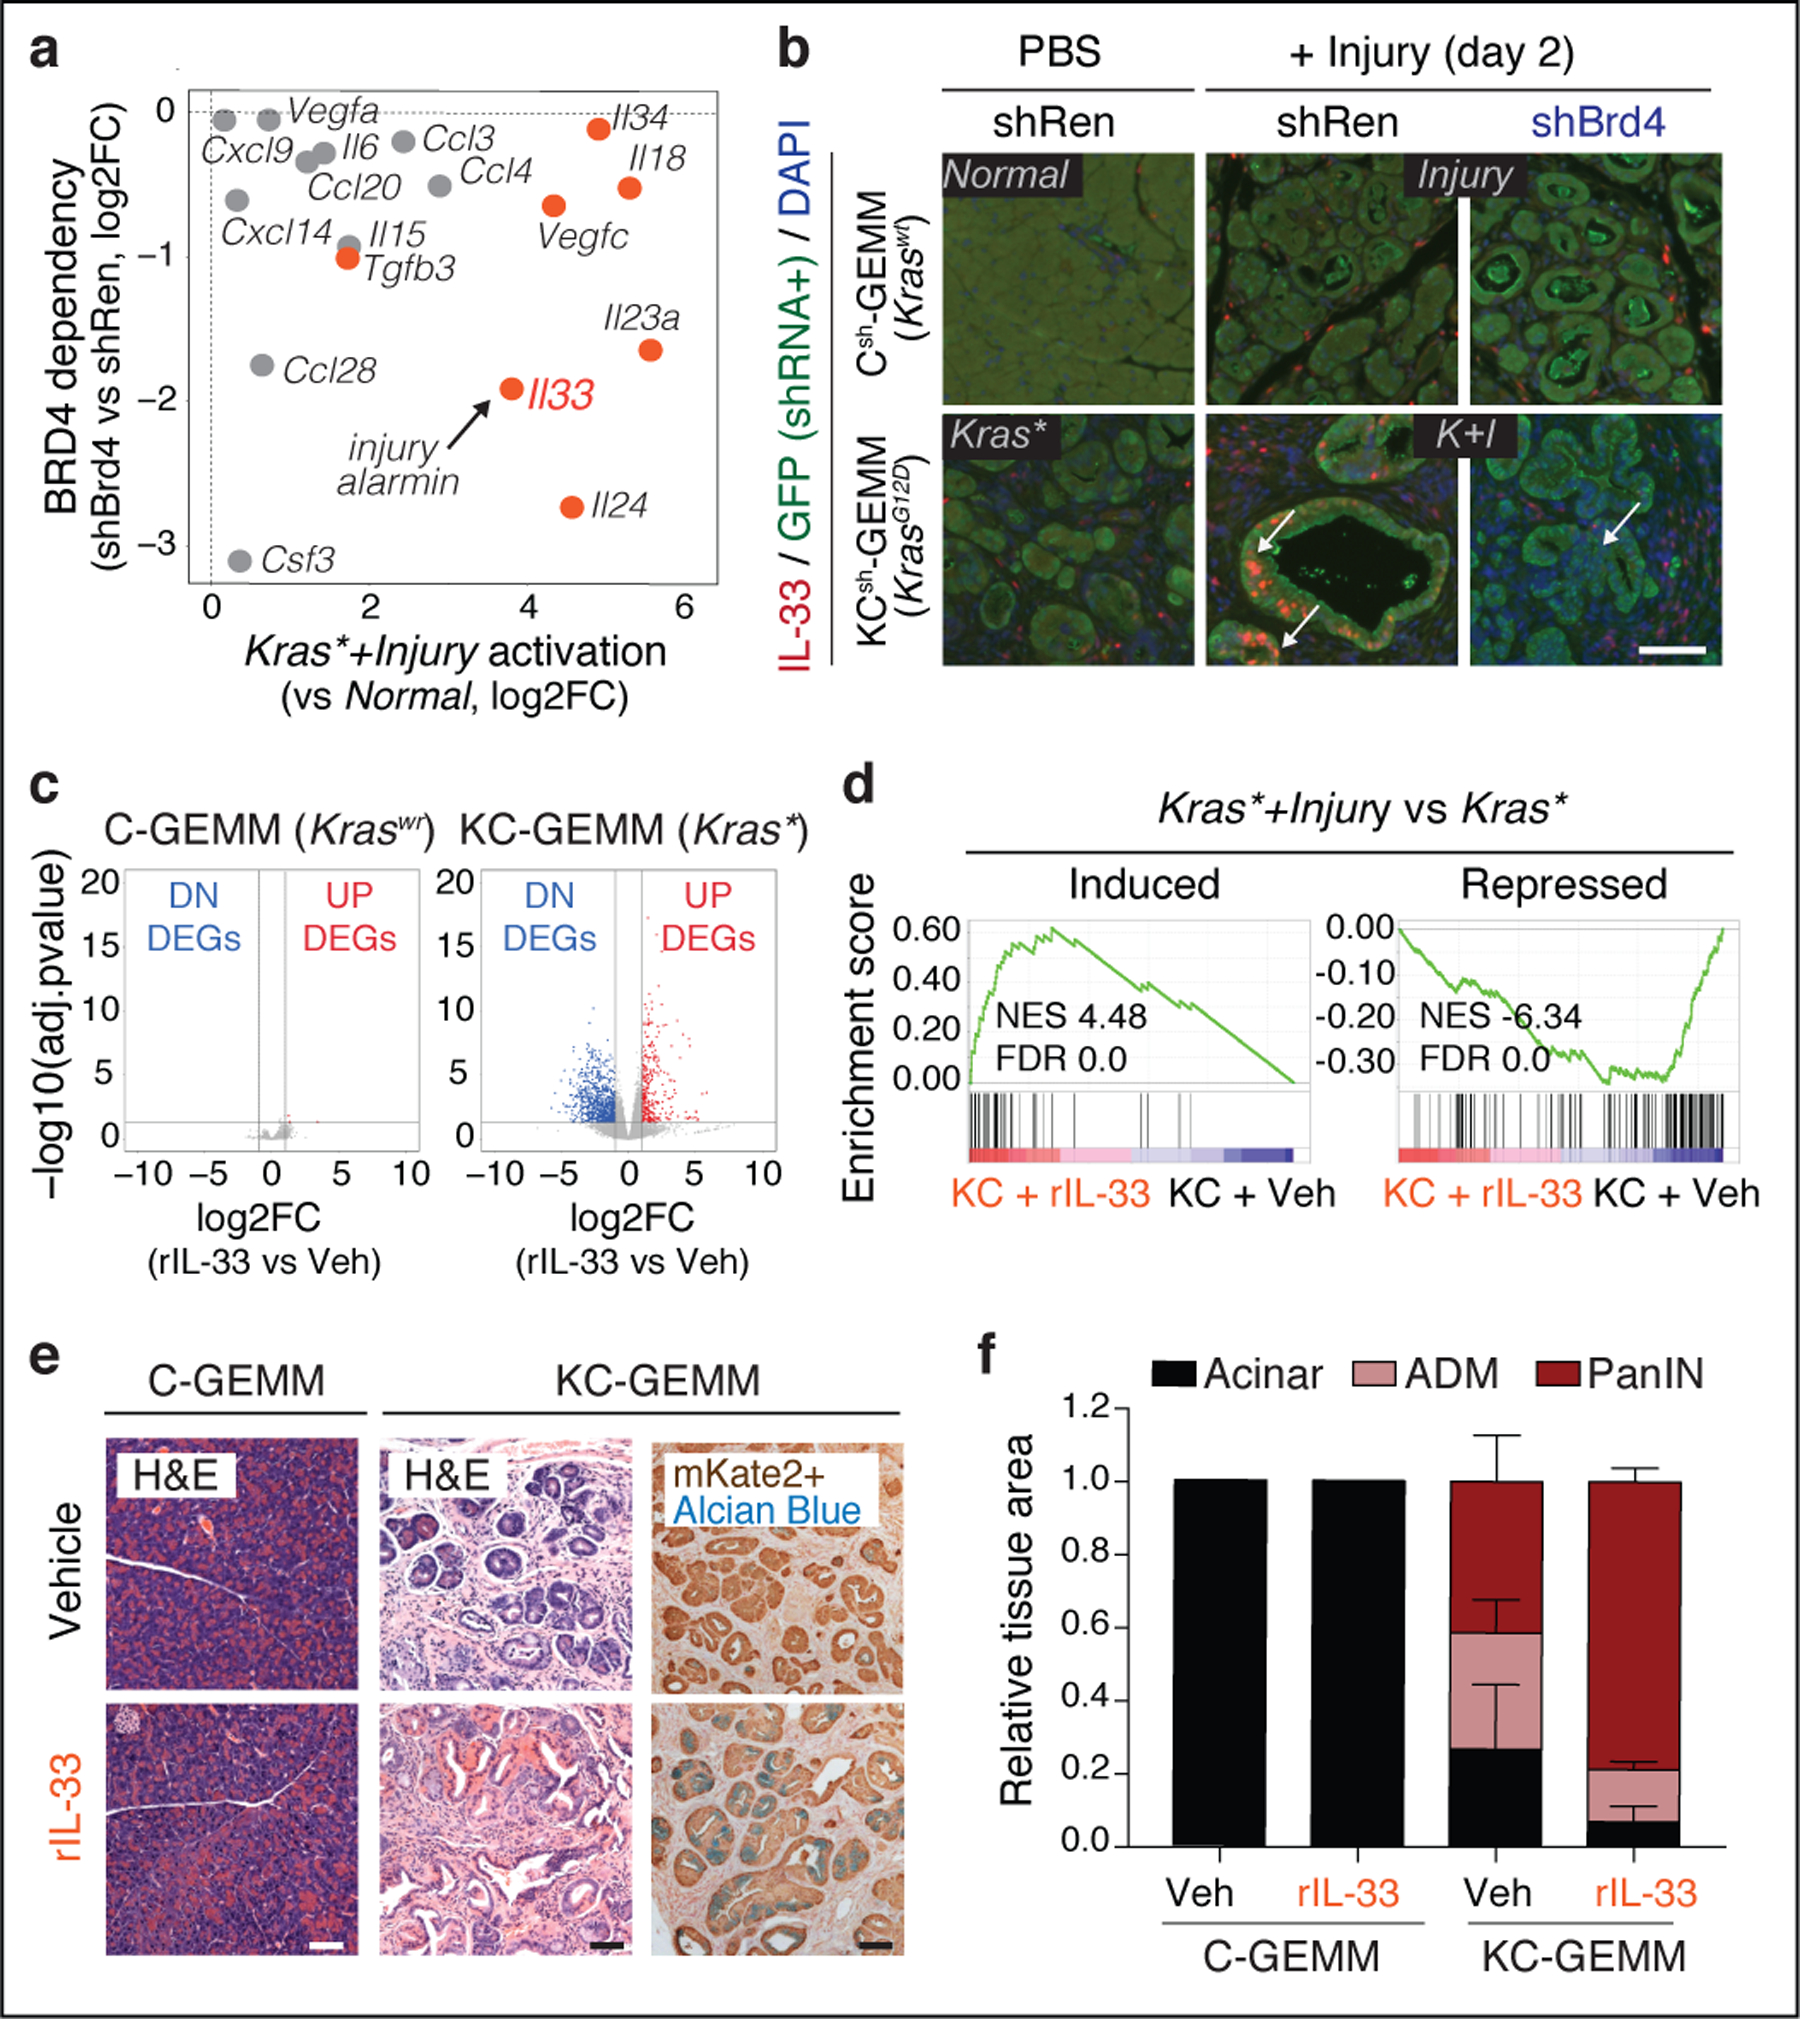
Tissue damage increases the risk of cancer through poorly understood mechanisms1. In mouse models of pancreatic cancer, pancreatitis associated with tissue injury collaborates with activating mutations in the Kras oncogene to markedly accelerate the formation of early neoplastic lesions and, ultimately, adenocarcinoma2,3. Here, by integrating genomics, single-cell chromatin assays and spatiotemporally controlled functional perturbations in autochthonous mouse models, we show that the combination of Kras mutation and tissue damage promotes a unique chromatin state in the pancreatic epithelium that distinguishes neoplastic transformation from normal regeneration and is selected for throughout malignant evolution. This cancer-associated epigenetic state emerges within 48 hours of pancreatic injury, and involves an 'acinar-to-neoplasia' chromatin switch that contributes to the early dysregulation of genes that define human pancreatic cancer. Among the factors that are most rapidly activated after tissue damage in the pre-malignant pancreatic epithelium is the alarmin cytokine interleukin 33, which recapitulates the effects of injury in cooperating with mutant Kras to unleash the epigenetic remodelling program of early neoplasia and neoplastic transformation. Collectively, our study demonstrates how gene-environment interactions can rapidly produce gene-regulatory programs that dictate early neoplastic commitment, and provides a molecular framework for understanding the interplay between genetic and environmental cues in the initiation of cancer.


Conflict of interest statement

Competing interest

A patent application (PTC/US2019/041670, internationally filing date 12 July 2019) has been submitted based in part on results presented in this manuscript covering methods for preventing or treating KRAS mutant pancreas cancer with inhibitors of Type 2 cytokine signaling. D.A.C and S.W.L are listed as the inventors. S.W.L. is a founder and scientific advisory board member of Blueprint Medicines, Mirimus Inc., and ORIC pharmaceuticals, and Faeth Therapeutics, and on the scientific advisory board of Constellation Pharmaceuticals and PMV Pharmaceuticals. S.D.L. is on the scientific advisory board of Nybo Therapeutics and Episteme Prognostics.

Figures

Extended Data Fig. 1.
Extended Data Fig. 1.. Chromatin accessibility dynamics during pancreatic regeneration and early neoplasia.
a, Schematic representation of the allele configurations used to trace Cre-recombined wild-type, Kras-mutant or Kras-mutant;p53-null pancreatic epithelial cells in transgenic mice. b, Representative H&E (top) or mKate2 IHC (bottom) of pancreata from the indicated mouse models and treatment conditions (n=3 mice per group), illustrating the defined tissue states, spanning normal healthy (Normal), regenerating (reversible metaplasia, Injury), early neoplastic (Kras*; Kras*+Injury) and malignant (PDAC) tissues, used for in vivo profiling of chromatin and transcriptional dynamics underlying physiological or pathological exocrine pancreas plasticity. Mouse model genotype abbreviations are as follows: C = Ptf1a-Cre / RIK; KC = Ptf1a-Cre / RIK / LSL-KrasG12D; KPflC = Ptf1a-Cre / RIK / LSL-KrasG12D / p53fl/+. The RIK allele enables tracing of Cre-recombined pancreatic epithelial cells through the reporter mKate2. Scale bar, 100 μm. c, Example of gating strategy to isolate pancreatic epithelial cells expressing the lineage-tracing marker mKate2. Live mKate2+;CD45-;DAPI- cells were isolated from single-cell suspensions of pancreata from the autochthonous models of PDAC tumorigenesis (KC or KPflC) or normal pancreas counterparts (C) described in a, b (see also Supplementary Fig. 1). d, Correlation plot showing ATAC-seq size factors used for data normalization of the indicated experimental conditions with two different methods (n=3, 5, 3, 6 or 4 mice per group, as labeled from top to bottom). PeakNorm uses the in-built DESeq2 normalization for all filtered reads mapped to the peak atlas, whereas DepthNorm uses the number of filtered mapped reads irrespective of if reads are within or outside the peak atlas. The shaded region represents the 95% confidence interval for the regression between normalization types. e, Overlap between the dynamic ATAC-peaks lost (left) or gained (right) in the indicated tissue conditions vs Normal. Numbers reflect peaks in each category.
Extended Data Fig. 2.
Extended Data Fig. 2.. Shared and distinctive features of accessibility-GAIN and -LOSS regions induced by mutant Kras, tissue damage or their combination.
a, Heatmap representation of chromatin accessibility at ATAC-peaks significantly gained or lost between Normal, Injury, Kras* and Kras*+Injury conditions, as assessed by DESeq2 analyses of ATAC-seq data. Unsupervised clustering identified 6 major modules of peaks, that are either shared (S, A2) or specifically altered during physiological regenerative metaplasia (R) versus neoplastic transformation (N1, N2, A1). Each column represents one independent biological replicate (animal). Fig. 1e shows these same clusters plotted with the PDAC condition to illustrate their accessibility status in advanced disease. b, Metagene representation of the mean ATAC-seq signal for 6 ATAC-cluster regions identified in the above analyses in the indicated epithelial states, with the number of mice analyzed per condition indicated in the brackets. c, Genomic annotations of dynamic peaks comprising each ATAC-seq cluster. Note accessibility dynamics predominantly occur at intronic and distal intergenic cis-regulatory elements, with an enriched contribution of promoter or transcriptional start site (TSS) regions in regeneration-associated gained (R) or lost (A2) clusters. d, Top-scoring transcription factor motifs identified by HOMER de novo motif analyses per ATAC-seq cluster. The number in the brackets indicates enrichment p-values. e, Heatmap representing the relative motif enrichment for the top-scoring motifs across the same clusters of peaks sensitive to effects of injury and/or mutant Kras shown in d. Injury and mutant Kras cooperatively produce gain (e.g. AP-1, KLF, ETS, RUNX, SOX, MAF), loss (e.g. HNF), and redistribution (e.g. FOX, GATA) of accessible putative TF binding sites for a multi-pronged network of TF families, including TFs known to control pro-oncogenic (e.g. AP-1, RUNX3, KLF4/5,, SOX9/17,) or tumor-suppressive programs (e.g. HNF1A, KLF14, NR5A2, PTF1A) in PDAC. f, Correlation matrices showing the differential degree of co-occurrence of motifs from different classes of TFs at the peaks comprising each ATAC-seq cluster (defined in a), revealing TF modules (marked with black rectangles). Note that AP-1-motif positive peaks gained uniquely during regenerative metaplasia (R cluster) show co-occurrence with pancreas lineage TF (GATA, FOX) motifs, whereas those gained during pro-neoplastic (Kras-mutant) metaplasia (S, N1, N2) do not. g, Bubble plots showing the relative enrichment of the indicated motifs (identified as top-scoring by HOMER analyses described in d) in the ATAC-peaks that are significantly gained (left, right) or lost (blue, right) in the Injury (I, n=5 mice), Kras* (K, n=3 mice), Kras*+Injury (K+I, n=6 mice) or advanced cancer (PDAC, n=4 mice) conditions vs normal healthy pancreas (Normal, n=3), as defined in Fig. 1a.
Extended Data Fig. 3.
Extended Data Fig. 3.. Early chromatin accessibility changes impact cell-identity genes associated with experimentally-validated enhancers of normal and malignant pancreatic epithelial cells.
a, Representative ATAC-seq tracks showing dynamic accessibility at gene loci previously described to harbour active enhancers (top) in normal acinar (left, Il22ra) or advanced PDAC (right, Trim2917) cells across mKate2+ sorted cells freshly-isolated from the indicated tissue states as defined in Fig. 1. n=3, 5, 3, 6 or 4 (from top to bottom) mice per group. b, Metagene representation of the mean ATAC-seq signal for regions bound by the acinar lineage-determining TF PTF1A in normal pancreas (left) (defined from GSE86262) or H3K27ac-GAIN regions of metastasis-derived PDAC organoids vs normal pancreas counterparts (defined from GSE99311) in mKate2+ sorted cells freshly-isolated from the indicated tissue states. The number of mice analyzed per condition is indicated in the brackets. c, Proportion of genomic regions showing a significant gain of H3K72Ac signal in metastasis-derived cultured organoids compared to their normal counterparts (H3K27Ac ChIP-seq data from GSE99311) that gain accessibility in pancreatic epithelial (mKate2+) cell populations freshly-isolated from Injury (n=5 mice), Kras* (n=3 mice), Kras*+Injury (n=6 mice) or PDAC (n=4 mice) tissue states as compared to Normal pancreas counterparts (n=3 mice), as defined by overlapping ChIP-seq and ATAC-seq datasets. d, Schematic representation of the genetic configuration used to induce exocrine pancreas-specific suppression of the chromatin reader Brd4. We generated mice (KCsh-GEMM) harboring the following alleles: (i) a pancreas-specific Cre driver (Ptf1a-Cre), (ii) a Cre-activatable LSL-KrasG12D allele and (iii) two additional alleles [LSL-rtTA3-IRES-mKate (RIK) and the collagen homing cassette, (CHC)] that allow for inducible expression of a GFP-linked shRNA targeting Brd4 (shBrd4) or a neutral shRNA (shRenilla) in Cre-recombined cells labeled by the fluorescent reporter mKate2. Upon receiving a doxycycline (dox)-containing diet, a GFP-linked shRNA targeting Brd4 (or Renilla, control) is induced selectively in mKate2-labeled pancreatic epithelial cells. Analogous models harboring the dox-inducible shRNAs without the LSL-KrasG12D allele (referred to as Csh-GEMM) were generated to compare and contrast epigenetic requirements of pro-neoplastic vs regenerative pancreas plasticity. e, Representative H&E, immunohistochemistry (IHC) or immunofluorescence (IF) analyses of the indicated proteins in pancreata from Csh (top) or KCsh (top) mice (n=3 per group) placed on dox fed at 5 weeks old and analyzed 9 days later. mKate2 staining marks Kras-wild-type (bottom) or Kras-mutant (bottom) pancreatic exocrine cells where Ptf1a-Cre has been expressed. GFP staining corresponds to shRNA expression and is coupled with Brd4 suppression in that same compartment (but not in surrounding stroma) in mice harbouring shRNAs targeting Brd4 (shown for the shBrd4.552 strain) but not Renilla (control). Dashed lines demark boundaries between epithelium and stroma, and arrows point to Brd4-suppressed exocrine pancreas compartment of shBr4 mice. The same Brd4 IHC panels are shown in Fig. 2b. Scale bar, 50 μm. f, GSEA and metagene plots showing the relative expression (top) and accessibility (bottom) status, respectively, of the same loci defining normal acinar state (left, with top-500 PTF1A-bound peaks) or harbouring activated enhancers in metastatic PDAC cells (right) shown in (b) in shBrd4 vs shRen mKate2+ metaplastic epithelial cells isolated from KCsh-GEMM mice (Kras*+Injury) described above (n=3 mice per genotype). Brd4 suppression selectively impairs transcription of lineage-specific and PDAC enhancer-associated genes in the Kras-mutant metaplastic epithelium without impairing chromatin accessibility at those loci. Genome-wide profiles of these same conditions are shown in Extended Data Fig. 6m. g, Representative ATAC-seq and RNA-seq tracks of genes known to be associated with active lineage-specific enhancers (top) of acinar (e.g. Cabp2) or pancreatic progenitor cells (e.g. Fgfr2) in shRen.713 (black) or shBrd4.552 (blue) mKate2+ epithelial cells freshly-isolated from metaplastic pancreata from KCsh-GEMM mice (n=3 per genotype) at the 48h post-caerulein treatment time-point (thus matching the Kras*+Injury condition). Brd4 suppression impairs transcription of pancreatic enhancer-associated genes without altering chromatin accessibility at that same loci. Tracks of housekeeping genes (bottom) are shown as specificity controls. Mice were placed on dox 6 days prior to the caerulein treatment, to induce ADM in the presence or absence of Brd4 (as summarized in Extended Data Fig. 4a below). See also Extended Data Fig. 6l,m.
Extended Data Fig. 4.
Extended Data Fig. 4.. Brd4 suppression is dispensable for both regenerative and neoplasia-associated ADM.
a, Experimental strategy to address the functional impact of spatiotemporally-controlled perturbation of Brd4 during injury-accelerated tumorigenesis or physiological regeneration in KCsh or Csh mice, respectively. 4 weeks old mice were placed on dox diet to induce expression of shRNA targeting Brd4 or Ren (control) in the pancreatic epithelium, and pancreatic injury was induced by caerulein treatment 6 days thereafter to trigger synchronous ADM throughout the organ in the presence or absence of epithelial Brd4 function, respectively. Tissue responses were evaluated at the indicated days (d) or weeks (w) post-caerulein or PBS (control) treatment. Specifically, to match our previous profiling experiments, we examined pancreatic ADM at 48 hours post-caerulein treatment, a time point corresponding to the distinct, genotype-specific chromatin accessibility profiles identified above. Subsequent regeneration (Kras wild-type context) or neoplasia (Kras mutant context) were evaluated 5 days or 2–3 weeks thereafter, respectively. In addition, separate cohorts of dox-treated KCsh mice placed were analyzed at 6 weeks and 1 year of age to track effects the context of stochastic Kras-driven neoplasia. Mouse illustrations were made using ©BioRender - biorender.com. b-c, shBrd4 perturbation does not impair mutant Kras-driven ADM. Representative immunofluorescence stains of the acinar markers (CPA1, Amylase) or the ductal metaplasia marker SOX9 co-stained with lineage-tracer markers (mKate2/GFP) in Kras-mutant pancreata from 6 weeks old KC-shRen or -shBrd4 mice (n=6 per group) in the stochastic tumorigenesis setting. d-g shBrd4 perturbation does not blunt injury-induced ADM but impairs subsequent acinar regeneration. Representative immunofluorescence (IF) staining of pancreata from Kras-wild type Csh mice expressing shRen or shBrd4 treated with Caerulein or PBS control and analyzed at the indicated days (d) post treatment for protein expression of the acinar marker CPA1 (d), metaplasia markers KRT19 (e), SOX9 (f) or clusterin (g) co-stained with GFP (marking shRNA expressing cells) and DAPI (nuclei). n=5 mice per group. Scale bar, 100 μm.
Extended Data Fig. 5.
Extended Data Fig. 5.. Brd4 suppression impairs regenerative and neoplastic fate outcomes of injury-driven pancreas plasticity.
a Representative bright-field and fluorescence images showing gross morphology of pancreata of C-shRen and -shBrd4 mice treated with caerulein or PBS control and analyzed at the indicated time points in days (d). Lineage-traced pancreatic epithelial cells expressing shRNA are marked by the fluorescent reporters mKate2 and GFP. Reduced mKate2 and GFP signals denote loss of pancreatic tissue expressing shBrd4. Scale bar, 5 mm. b, Representative bright-field and fluorescence images showing gross morphology of pancreata of KC-shRen and -shBrd4 mice placed on dox since postnatal day 10 to induce shRNA expression and analyzed at 1-year of age. Reduced mKate2 and GFP signals denote loss of shBrd4-expressing mutant Kras pancreatic epithelial cells. Scale bar, 5 mm. c, Quantification of pancreatic weight normalized to animal body weight by genotype. Data are presented as means ± s.e.m; n=8, 7 or 5 (top, from left to right) mice, or n=3, 4 or 2 (bottom, from left to right) mice; unpaired two-tailed Student’s t-test. d, Representative immunohistochemistry stains of mKate2 (top) and Myc (bottom) in pancreata from 6 weeks old mice KCsh of the indicated genotypes and placed on dox fed at day 10 after birth (stochastic tumorigenesis setting). Lower panels show high magnification images of regions marked with dashed line boxes for visualization of Myc nuclear localization. While oncogenic Myc expression can require Brd4-associated enhancers in some settings,, and is suppressed by systemic BET inhibition in KC mice, epithelial-specific Brd4 suppression did not reduce Myc protein in our model. Scale bar, 100 μm. e, Representative co-IF stains of mKate2 (red) and the acinar marker CPA1 (green) in pancreata from 6 weeks old mice KCsh mice of the indicated genotypes and placed on dox fed at day 10 after birth, as above. Right panels show high magnification images of regions marked with dashed line boxes. KCsh mice harboring a validated shRNA targeting Myc (instead of Brd4) exhibited impaired rather than accelerated ADM. The reduction of CPA1 observed in KC-shBrd4 mice is not phenocopied in KC-shMyc mice, which retain Cpa1 expression. Scale bar, 100 μm. f, Schematic representation of the phenotypic output of pancreas-specific suppression of Brd4 during mutant Kras-driven neoplasia and tissue injury-driven regeneration: Brd4 is dispensable for acinar-to-ductal metaplasia induction in both contexts but mediates subsequent neoplastic progression to PanIN or regenerative plasticity, respectively.
Extended Data Fig. 6.
Extended Data Fig. 6.. Brd4 suppression uncover distinct chromatin-associated transcriptional programs in normal vs Kras-mutant damaged pancreata.
a, Representative immunohistochemical staining (IHC) of Brd4 in pancreata from Csh-GEMM (left) or KCsh-GEMM (right) mice (n=3 per group) harbouring shRen.713 or shBrd4.1448 at 48 hours post-caerulein, placed on dox fed 6 days before caerulein treatment start. b, Overlap of DEGs downregulated upon Brd4 suppression in the Injury (regeneration) or Kras*+Injury (neoplastic transformation) settings. Examples of Brd4-dependent genes, shared or unique to each context are shown. c, Heatmap representation of normalized enrichment scores (NES) comparing the mRNA expression of genes associated with the ATAC-seq clusters identified in Fig. 1 between shBrd4.1448 vs shRen.713 pancreatic epithelial cells (mKate2/GFP+) isolated from Kras wild-type (Injury, left) or Kras-mutant (Kras*+Injury; right) metaplastic tissues, as analyzed by GSEA at the 48 hours post-caerulein time-point. Negative normalized enrichment scores (NES) indicate downregulation of gene set in shBrd4 cells as compared to shRen counterparts. Consistent with the accelerated ADM but blunted neoplastic transformation phenotype (Fig. 3), Brd4 suppression impairs the expression of genes linked to the acinar ATAC-seq clusters (A1/A2) in both WT and Kras-mutant cells and, additionally, of genes linked to the neoplasia-specific ATAC-seq clusters (N1, N2) in Kras-mutant cells. Shared (S) and regeneration-specific (R) and ATAC-seq clusters are not blunted in either context, suggesting these reflect injury-driven ADM states that can be induced in the absence of Brd4 in both WT and Kras-mutant contexts. d, GSEA comparing the expression of known Ptf1a-dependent genes between shBrd4 and shRen cells isolated from Kras-WT (Csh; top) or Kras-mutant (KCsh; bottom) mice triggered to undergo regenerative (Injury) or pro-neoplastic (Kras*+Injury) metaplasia, respectively. e-f, Impact of Brd4 suppression on the protein (e) or mRNA (f) levels of known drivers of pancreatic tumorigenesis linked to ATAC-GAIN loci specific to early neoplasia (Kras*+Injury; K+I) that remain in a closed chromatin state in both regenerative metaplasia (Injury) and normal pancreas. Panels in ‘e’ show representative immunofluorescence stains of the indicated neoplasia-activated factors (red) co-stained with GFP (green, marking epithelial cells) in pancreata from wild-type or Kras-mutant shRNA-expressing mice 2 days after tissue injury (caerulein) or control (PBS). Nuclei are counterstained with DAPI (blue). Representative ATAC-seq and RNA-seq tracks of these and other neoplasia-activated genes herein identified to be induced by during pancreatitis-induced neoplasia (Kras*+Injury condition) in a Brd4-independent manner are shown in ‘f’. g, GSEA comparing the expression of a mutant Kras-associated FOSL1 gene signature between shBrd4 and shRen cells isolated from KCsh-GEMM mice (Kras*+Injury condition). h, GSEA comparing the expression of genes upregulated in human PDAC specimens vs human normal pancreas between shBrd4 and shRen cells isolated from KCsh-GEMM mice (Kras*+Injury condition). Similar results were obtained with GSE62452 dataset. i, Representative ATAC-seq and RNA-seq tracks of classic metaplasia-associated genes that, in contrast to the above programs, pre-exist in an opened chromatin in normal pancreas and are induced in a Brd4-dependent manner, consistent with the dispensability of Brd4 for ADM. j, GSEA comparing the expression of Myc activated genes between Kras-mutant shBrd4 and shRen cells (Kras*+Injury condition), showing retained expression in shBrd4 populations. Similar results were obtained with additional Myc signatures, (not shown). k, Representative immunofluorescence stains the proliferation marker Ki67 (green) co-stained with mKate2 (red, marking epithelial cells) in pancreata from wild-type or Kras-mutant shRNA-expressing mice 2 days after tissue injury (caerulein) or control (PBS). Nuclei are counterstained with DAPI (blue). Brd4 suppression induces aberrant activation of Cdkn1a and other stress response p53-activated genes in both WT and Kras-mutant metaplastic cells (see Supplementary Table 4) which, accordingly, showed reduced proliferation. l, Metagene and GSEA plots showing the relative accessibility (left) and expression (right) status, respectively, of ATAC-GAIN regions induced by tissue damage in Kras-mutant pancreata (Kras*+Injury vs Kras*) in Kras-mutant shlBrd4 vs shRen cells isolated from the same Kras*+Injury tissue condition. m, Scatter plot comparing the genome-wide chromatin accessibility (left) and transcriptional (right) landscapes of Kras-mutant shBrd4 vs shRen cells isolated from the same Kras*+Injury tissue condition (n=3 mice per genotype). Each dot represented an ATAC-seq peak (left) or transcript (right; differentially accessible loci (log2FC >= 0.58, FDR <=0.1) or differentially expressed genes (FC>2, p-val <0.05) between genotypes are marked in red (gained) or blue (lost). shBrd4 populations display ATAC-seq profiles indistinguishable from those of shRen controls, ruling out that the observed Brd4-dependent transcriptional changes result from confounding secondary effects of acute Brd4 perturbation on chromatin state or epithelial tissue cell composition. Scale bar, 50 μm.
Extended Data Fig. 7.
Extended Data Fig. 7.. Early dysregulation of chromatin regulatory features of advanced PDAC.
a, Heatmap representation of RNA-seq data showing the relative expression of gene sets associated with ATAC clusters identified in Fig. 1 across mKate2+ pancreatic epithelial cells isolated from Normal, Injury, Kras*, Kras*+Injury and PDAC tissue states (as defined in Fig. 1a). Heatmap color represents median expression of all genes associated with each cluster, z-scored for comparison across conditions. Each colum represents an independent mouse. b, Chromatin dynamics at ATAC-peaks at promoter, distal, exon, or intro regions associated with differentially expressed genes (DEGs; RNA-seq Fold change>2, p-adj<0.05) between mKate2+ pancreatic epithelial cells isolated from the indicated tissue states vs normal pancreas (n = independent mice per condition as in a). DEGs were classified depending on whether they exhibit significant chromatin accessibility change (chromatin-dynamic DEGs) or no accessibility change (chromatin-stable DEGs, in grey) at associated peaks in the respective experimental condition vs normal pancreas. UP-DEGs, upregulated genes; DN-DEGs, downregulated genes. c, Heatmap of RNA-seq data showing top upregulated pathways in the Kras*+Injury condition, separated depending on whether they exhibit ATAC-GAINS at associated peaks (promoter or distal). Upregulated genes associated with accessibility-GAIN (left side) are linked to distinct biological traits commonly acquired in PDAC (e.g. differentiation, inflammation, fibrosis, signaling), whereas those with no ATAC change (i.e. ‘primed’ in normal pancreas) are linked to general cellular processes (e.g. cell proliferation, translation) (right side). See Supplementary Table 6 for additional tissue states and pathways. d, Relative enrichment of the indicated gene sets in shBrd4.1448 vs shRen.713-expressing pancreatic epithelial cells (mKate2/GFP+) isolated from KCsh-GEMM mice (n=3 per shRNA genotype, Kras+Injury) as determined by GSEA. UP-DEGs (left bars) and DN-DEGs (right bars) between the Kras*+Injury vs Normal conditions were classified depending on whether they exhibit or not significant accessibility changes (ATAC-GAIN, or ATAC-LOSS) at associated ATAC-peaks. Negative normalized enrichment scores (NES) indicate downregulation of gene sets in shBrd4 cells as compared to shRen counterparts. e, Heatmap representation of ATAC-RNA combined scores for the indicated TFs and tissue states. The ATAC-RNA combined score infers the probability of differential binding of a specific TF to a motif significantly enriched in the accessibility-GAIN or LOSS regions of each condition vs Normal, based on a consistent gene expression change in the same comparison (see Methods for details). Top TFs scoring for the Kras*+Injury or PDAC conditions vs Normal are shown. f, Heatmap of RNA-seq data from lineage-traced (mKate2+) pancreatic epithelial cells isolated from the indicated tissue states, showing the relative expression of transcription factors (TFs) whose binding motifs are enriched in loci that gain or lose accessibility by effects of tissue damage, mutant Kras or the combination of both (i.e. Fig. 1g-ATAC-clusters) or in the transition to full-blown adenocarcinoma PDAC (PDAC vs Kras*+Injury). Each column represents an individual animal. The boxes highlight modules of TFs that are: (i) similarly expressed in normal regeneration and cancer context (green, black); (ii) selectively induced in early neoplasia and PDAC (red); (iii) selectively overexpressed in late disease (dark blue); (iv) that become increasingly suppressed by effects of injury, mutant Kras (light blue) or both (orange); or (v) that are selectively induced in early-stage but not late disease (purple), with names of TF examples to the right. Injury and mutant Kras differentially induce diverse members of the same TF families, including several AP-1 JUN:FOS complex members (marked with arrows) and other TFs known known to also bind AP-1 motifs. In addition, note the Kras*/injury combination suppresses the expression of master regulators of acinar differentiation (marked with asterisks) more potently than either insult alone. g, Representative immunohistochemical (IHC) stains of two AP-1 family members in Kras-mutant or WT pancreatic tissues in the presence and absence of tissue damage (48 hours post-caerulein) and compared to advanced PDAC (n=4 mice per group). While AP-1 family member FOSL1 is induced in non-injured Kras mutant pancreata, JUNB protein levels increase only after injury with a potent co-activation occurring upon presence of both stimuli, suggesting cooperative gene – environment interactions shape AP-1 TF complex member expression. Scale bar, 100 μm.
Extended Data Fig. 8.
Extended Data Fig. 8.. Single cell analysis of chromatin dynamics in early-stage neoplasia.
a, UMAP representation of single-cell ATAC-seq (scATAC-seq) profiles of mKate2+ cells isolated from Kras* and Kras*+Injury tissue conditions (n=1 mice each) and co-embedded together, revealing chromatin heterogeneity across Kras-mutant pancreatic epithelial cells from pre-malignant tissue states. Dots represent individual cells (n=6369) and colors indicated cluster identity based on initial phenograph clustering (left). The heatmap shows the degree of intersection of significantly-enriched peaks (Fisher’s exact test, adjusted p-value<0.05) between each pair of phenograph cluster (colored matching UMAP plot), normalized by the total number of enriched peaks in the cluster for that row (left). Rows and columns are ordered according to their grouping into seven larger subpopulations derived from merging of Phenograph clusters based on the overlap of their differentially accessible peak sets (see Methods for details). b, UMAP representation of the same mKate2+ scATAC-seq profiles shown in (a) colored by major subpopulations (see Methods for details). c, Heatmaps showing patterns of accessibility at subpopulation-defining peaks, shown across each of the major subpopulations defined in (b) separated by tissue injury (+/−) condition. Color illustrates the proportion of all cells in each subpopulation and condition with an accessible peak, where values have been z-scored. The complete list of subpopulation-defining peaks are listed in Supplementary Table 8. d, Visualization of differential chromatin opening for the indicated peaks associated with known pancreatic cell-state defining markers or the housekeeping gene Gapdh, illustrated by opened-peak density plots for nearby proximal or distal elements within 50 kb of the transcription start site. Color scale indicates a Gaussian kernel density estimate of cells harboring the open peak in the UMAP visualization, with yellow signal marking increased density of cells with open chromatin at that specific locus. e, UMAP projection of scATAC-seq profiles of Kras-mutant (mKate2+) epithelial cells shown in (a-d) colored by the indicated tissue states. f, Correlation analysis comparing normalized accessibility signals per peak captured in scATAC- and bulk ATAC-seq analyses of in the indicated conditions. For scATAC-seq data, values representing pooling of all individual cells to generate depth-normalized accessibility signals per condition (pseudo-bulk) are shown. For bulk ATAC-seq data, values from a representative sample (independent animal) of a total of n=3 (Kras*) or n=6 (Kras*+Injury) are shown. g, Volcano plot showing dynamic peaks identified between PDAC and Normal conditions in bulk ATAC-seq analyses (Fig. 1), colored according to their relative accessibility fold change detected between Kras*+Injury and Kras* samples in scATAC-seq analyses. Peaks gained or lost in PDAC vs Normal are found differentially represented in scATAC-seq data from early stage neoplasia, correlating with tissue injury status. h, UMAP projection illustrating examples of peaks exhibiting chromatin closing (left) or opening (right) within the same mutant-Kras cell cluster upon tissue injury (+), visualized by opened-peak density plots in which color indicates a Gaussian kernel density estimate of cells harboring the open peak in the UMAP visualization. i, scATAC-seq tracks of the indicated loci showing chromatin accessibility patterns across the indicated subpopulations, marked with color labels matching (b) and separated by experimental condition. The first two rows (aggregate, in grey) show global patterns from pooling all cells from each condition, regardless of subpopulation identity, and population-specific dynamics are shown below. Blue- and red-colored boxes mark ATAC-GAINS or -LOSS detected in aggregate populations, and dashed boxes highlight examples of peaks displaying injury-associated accessibility changes between Kras-mutant cells from the same subpopulation. j, AP-1 and NR5A2 activity scores are anticorrelated across single cell epigenetic profiles, separated by subpopulation. Logged activity scores are plotted as a heatmap, with cells (columns) ordered by ratio of AP-1:NR5A2 activity within each subpopulation. k, Heatmaps showing accessibility signals for the indicated cluster of peaks (columns) identified from bulk ATAC-seq analyses (see Fig. 1e) across each major subpopulation of Kras-mutant cells, separated by experimental condition. The color scale represents the proportion of all cells in each subpopulation and condition with an accessible peak, where values have been z-scored. As above, the first two rows (aggregate) show global accessibility patterns from pooling all individual cells in each condition, regardless of subpopulation; and subpopulation-specific dynamics are shown below. l, Proportion of mKate2+ cells per cluster (marked with color labels matching Extended Data Fig. 8c) derived from Kras* (grey) or Kras*+Injury (orange) tissue conditions.
Extended Data Fig. 9.
Extended Data Fig. 9.. Epigenetic dysregulation of IL-33 during injury-facilitated neoplastic transformation.
a, UMAP visualization of the number (N) of total open peaks at the Il33 (top) of Cpa1 (locus) per individual Kras-mutant cell in the scATAC-seq analyses applied to 6369 individual cells freshly isolated from Kras* or Kras*+Injury conditions (n=1 mice each) and co-embedded together. Peaks nearby proximal or distal elements within 50 kb of the transcription start site were counted. Color scale indicates log-transformed counts of open peaks in the vicinity of the transcription start site. Note increased accessibility at Il33 gene regulatory loci in dedifferentiated populations, but not in the more differentiated acinar chromatin state or neuroendocrine-like subpopulations. b, scATAC-seq analyses identifies accessibility changes strongly correlated with AP-1/NR5A2 activity ratio across individual Kras-mutant cells isolated from pancreata undergoing early neoplastic cell fate transitions (Kras* and Kras*+Injury conditions). Bottom panels show normalized accessibility values for peaks (rows) displaying a strong (r>.1) positive (e.g. 5 Il33-associated peaks) or negative (r<−.1) (e.g. acinar Cpa1-associated peak) correlation with AP-1/NR5A2 activity scores (as in Fig. 4f) across individual Kras-mutant cells (columns, marked with color labels matching Extended Data Fig. 8b). The identified 5 switch-correlated peaks (n1-n5) at the Il33 locus which overlap with those captured as sensitive to effects of injury and/or mutant Kras in ATAC-seq analyses of bulk populations (see panel e, below). c, Signal tracks of the Il33 loci showing rapid chromatin accessibility gain (in grey boxes) in the mutant Kras epithelium upon tissue injury in single cell populations, separated by cluster (3 clusters shown) and condition (Kras* vs Kras*+Injury). Note accessibility gains are detected upon injury even within a defined cell cluster (examples marked with dashed lines), supporting bona fide chromatin remodeling at these loci. The 5 chromatin switch-correlated peaks identified in ‘b’ are labeled as n1-n5. All tracks show accessibility signals downsampled to same coverage to correct for cell count and sequencing depth disparities across conditions. d, Violin plots showing the AP-1/NR5A2 activity scores of Kras-mutant (mKate2+) pancreatic cells displaying an opened (blue) state for the indicated acinar Cpa1-associated peak, or any of the 5 chromatin switch-correlated Il33 peaks versus those that do not (green). Il33-accessible cell populations exhibit an enhanced AP-1 activity, whereas Cpa1-accessible cells do not. n=288, 6081, 2228 or 4141 (from left to right) individual cells obtained from n=2 mice (Kras*, Kras*+Injury conditions). Significance was assessed by unpaired two-tailed Student’s t-test. e, (Top) Representative ATAC-seq tracks of the Il33 locus in lineage traced (mKate2+) pancreatic epithelial cells isolated from normal (Normal, n=3 mice), regenerating (Injury, n=5 mice), stochastic neoplasia (Kras*, n=3 mice), synchronous injury-accelerated neoplasia (Kras*+Injury, n=6 mice) or cancer (PDAC, n=4) experimental conditions, as described in Fig. 1a. (Bottom) Independent ChIP-seq experiments (lines) from the 2019 GTRD database summarizing experimentally validated binding of certain AP-1 subunits (and other top scoring TFs associated with injury transitions) across different cellular contexts to Kras*/Injury-sensitive Il33 peaks identified in our study. f, Relative mRNA levels (RNA-seq DESeq2-normalized counts) of Il33 in FACS-sorted mKate2+;CD45- cell populations isolated from the indicated tissue states. Data are presented as means ± s.e.m. of n=4, 5, 3, 4 or 3 (from left to right) independent biological replicates (mice) per group. g, qRT-PCR analyses validating downregulation of Il33 mRNA in Brd4-suppressed mutant Kras pancreatic cell populations (mKate2+) isolated from mice (n=2 per genotype) triggered to undergo synchronous pro-neoplastic transitions upon tissue damage in KCsh mice placed on dox-diet 6 days before (as in Extended Data Fig. 4a). Cells were isolated for expression analysis at 48 hours after caerulein treatment, i.e. matching the Kras*+Injury condition of the omics analyses revealing rapid gain in accessibility and expression at the Il33 locus. h, Representative IHC stains of IL-33 protein in normal (left) or metaplastic (middle, right) pancreata expressing shRen or shBrd4 from Kras-WT (Csh) or Kras-mutant (KCsh) mice (n=4 per condition) treated with caerulein-induced pancreatic injury and analyzed 48 hours thereafter, as in Extended Fig. 4a above. Scale bar, 50 μm. i, Relative Il33 mRNA levels in pancreatic acinar 266–6 (left) or KPflC PDAC (right) cultured cells stably transduced with vectors encoding for the indicated proteins, as assessed by qRT-PCR and normalized to β-actin housekeeping control. Representative results of 2 independent experiments performed with n=2 biological replicates (wells) each with individual data points shown. j, Multiplexed immunoassay detecting the indicated cytokines or chemokines in protein lysates from normal or mutant Kras pancreata, 2 days after induction of caerulein (Caer)-induced tissue injury or treatment with PBS (control). n=2, 3, 4, 2 or 5 (from left to right) independent animals per condition. The bar-graphs to the right displays pooled data (means ± s.e.m) from n=5 independent animals (Kras*+Injury condition), revealing IL-33 as a major pancreas injury ‘alarmin’ induced by combined effects of Kras gene mutation and tissue damage.
Extended Data Fig. 10.
Extended Data Fig. 10.. IL-33 cytokine signaling shapes the transcriptional, chromatin accessibility and histological state of the Kras-mutant pancreatic epithelium.
a, Schematic representation of the experimental design to interrogate the impact of recombinant IL-33 (rIL-33) on the transcriptional, chromatin and phenotypic state of the pancreatic epithelium from Kras-mutant (KC-GEMM) or wild-type (C-GEMM) mice. Molecular analyses were performed in lineage-traced (mKate2+) pancreatic epithelial cells purified by FACS-sorting from of rIL-33 or vehicle treated mice at day 0 (ATAC-seq), or day 0 and day 21 days (RNA-seq) after treatment. b, GSEA comparing the expression of the early chromatin activated gene program identified in Fig. 4 analyses (left), or of genes overexpressed in human PDAC specimens compared to normal pancreas (Moffitt et al. dataset) (right), in Kras-mutant cells isolated from rIL-33 treated vs PBS-treated mice (day 21 time point). The chromatin activated genes queried are the chromatin-dynamic DEGs identified to be upregulated during injury-accelerated neoplasia (Kras*+Injury) and in advanced disease (PDAC) but not during normal regeneration (Injury alone) and blunted by Brd4 suppression in metaplastic Kras-mutant cells (KCsh: Kras+Injury). c-d, GSEA comparing the expression of genes induced by the combination of mutant Kras + rIL-33 in either shBrd4 vs shRen Kras-mutant pancreatic epithelial cells (mKate2+) isolated from KCsh-GEMM (Kras*+Injury) (c) or in Kras-mutant populations isolated from caeruelin-treated (Kras*+Injury) vs resting (Kras*) KC mice (d). The queried gene sets were identified as significantly upregulated in Kras-mutant pancreatic epithelial cell populations (mKate2+) isolated from rIL-33 (vs PBS) treated mice (KC+rIL-33 vs KC+Veh) at either day 0 (d0) or day 21 (d21) time points. e, qRT-PCR analysis of rIL-33 effects in the mRNA levels of acinar differentiation (Cpa1), metaplasia (Sox9) and Kras-dependent neoplasia (Agr2, Muc6) markers in pancreatic epithelial cell (mKate2+) populations isolated from Kras-WT (C) or Kras-mutant (KC) mice (n=2 each) treated with rIL-33 or Vehicle (PBS) and analyzed 21 days thereafter. f, GSEA comparing the expression of genes induced by the combination of mutant Kras + rIL-33 in human PDAC specimens vs human normal pancreas (Moffitt et al. dataset). g, Volcano plots comparing the chromatin accessibility landscape of Kras-mutant pancreatic epithelium of rIL-33-treated vs vehicle-treated mice, as assessed by ATAC-seq performed at the day 0 time-point. h, Top-scoring motifs identified by HOMER de novo analysis in accessibility-GAIN peaks identified in Kras-mutant pancreatic epithelial cells (mKate2+) isolated from rIL-33-treated mice vs from PBS-treated counterparts, assessed by ATAC-seq analyses performed at the day 0 time point. The significance of the enrichment is shown in brackets. i, Metagene representation of the mean ATAC-seq signal (n=3 mice per condition) at accessibility-GAIN regions driven by injury in the Kras-mutant pancreatic epithelium (Kras*+Injury vs Kras*) (top) or at accessibility-GAIN regions linked to the neoplasia-specific gene activation program (identified in Fig. 4b analyses, right) in Kras-mutant pancreatic epithelial cells (mKate2+) from isolated from rIL-33 treated vs PBS-treated mice (n=3 each, day 0 time point). rIL-33 treatment promotes accessibility at injury-sensitive sites. p-values were determined by Kolmogorov–Smirnov test. j, Quantification of the relative number of ADM and PanIN lesions in pancreata from Kras wild-type (C-GEMM) or Kras mutant (KC-GEMM) mice treated with rIL-33 or vehicle (PBS) and analyzed at the indicated time points in days (d) after treatment. Data are presented as means ± s.e.m and significance was assessed by unpaired two-tailed Student’s t-test (ns, not significant). n=3, 4, 4, 5, 3 or 4 (from left to right) independent animals per experimental condition. k, Representative immunofluorescence stains of IL-33 protein (green) co-stained with the lineage-tracer marker mKate2 (red) marking pancreatic epithelial cells from mice (n=3 per group) harbouring wild-type (Normal) or mutant Kras in the indicated tissue states. Scale bar, 100 μm. l, Relative mRNA levels (RNA-seq tpm counts) of Il33 (left) or the indicated mutant Kras effector (Agr288), middle) or acinar TF (Cpa1, right) in FACS-sorted mKate2+ pancreatic epithelial cell populations isolated from rIL-33-treated or PBS-treated mice harbouring WT or mutant Kras. n=3, 4, 4, 4, 5 or 4 (from left to right) biological replicates (independent mice) per group; median and upper/lower quantile values per group are indicated.
Fig 1.
Fig 1.. Tissue damage induces cancer-associated chromatin states in pre-malignancy.
a, Experimental settings to interrogate epithelial neoplastic reprogramming in vivo. Chromatin accessibility (and gene expression, below) analyses were performed on lineage-traced pancreatic epithelial cell populations FACS-isolated from well-defined tissue states (see main text). When applicable, tissue damage was induced by treatment with the synthetic cholecystokinin analogue caerulein,. b, Principal Component Analyses of ATAC-seq data from independent biological replicates of pancreatic epithelial cells isolated from tissue states described in (a). c, Proportion of ATAC-peaks significantly gained (top) or lost (bottom) in PDAC compared to Normal pancreas, and found similarly altered in pre-malignant tissues subjected to injury, expressing mutant Kras, or both. Bar color indicates experimental condition, as in (b). d, Number of ATAC-peaks that are significantly lost (top) or gained (bottom) in the indicated conditions vs Normal pancreas, shared or unique to each condition. e, Heatmap representation of peaks gained or lost between Normal, Injury, Kras* and Kras*+Injury conditions. Each column represents an independent mouse. Numbers indicate the number of peaks per cluster. f, ATAC-seq tracks at a N2-cluster locus exhibiting synergistic accessibility-GAINS by combination of injury and mutant Kras (one independent mouse per lane). y-axis scale range per lane [0–60]. In c, d, bar charts summarize the degree of overlap between dynamic ATAC-peaks identified by DESeq2 analyses (log2FC >= 0.58; FDR <=0.1) comparing Injury (n=5 mice), Kras* (n=3 mice), Kras*+Injury (n=6 mice), or PDAC (n=4 mice) conditions versus Normal (n=3 mice).
Fig. 2.
Fig. 2.. An in vivo approach to perturb chromatin output in regenerating and neoplastic pancreatic epithelia.
a, Diagram of experimental settings to study regenerative and tumor-initiating epithelial plasticity in response to tissue damage in KC- and C-GEMMs. Illustrations from biorender.com. b, Representative immunohistochemistry (IHC) of Brd4 in Csh (top) or KCsh (bottom) mice (n = 3 mice/group) fed with dox-containing food for 9 days. Surrounded areas represent epithelium; arrows point to Brd4-suppressed exocrine pancreas epithelium in wild-type or mutant Kras mice expressing Brd4.specific (shBrd4.552) but not control (shRen.713) shRNA. Scale bar, 100 μm. c, Representative ATAC-seq and RNA-seq tracks of a known acinar identity gene (top) or housekeeping gene locus (bottom) in lineage-traced (mKate2+;GFP+) pancreatic epithelial cells isolated from shRen.713 or shBrd4.552 KCsh mice (n = 3 each), analyzed at the same time point after dox administration as in b.
Fig. 3.
Fig. 3.. Neoplastic and regenerative outcomes of injury rely on distinct Brd4-dependent programs.
a, Representative H&E of pancreata from Kras wild-type C-shRen (control) or C-shBrd4 (sh552) mice treated with Caerulein (Caer) or PBS harvested at indicated days (d) post-treatment (number of mice/group, as in b). b, Quantification of pancreas-to-body weight ratio of C-shRen or -shBrd4 mice at indicated time-points after caerulein treatment, denoting rapid loss of pancreatic tissue in shBrd4 mice between day-2 and day-7 post-injury. n = 5, 6, 2, 11, 5, 6, 7, 6 or 4 (from left to right) mice/group. c, Representative IHC of mKate2 and Alcian blue in pancreata from KC-GEMM-shRen.713 or -shBrd4.552 mice placed on dox diet since postnatal day 10, analyzed at indicated time points. d, Quantification of PanIN lesion area in pancreata from 6 week-old KC-shRen (n=4) or -shBrd4 (n=8) mice, or 1-year-old KC-shRen (n=3) or KC-shBrd4 (n=4) mice. e, Representative immunofluorescence (GFP) and IHC (mKate2, Alcian blue) to visualize the progression of Kras-mutant cells expressing Ren or Brd4 shRNAs (mKate2+;GFP+) upon injury-accelerated pancreatic neoplasia, analyzed at indicated days (d) or weeks (w) post-Caer (n=3 mice/group). f, (Top) Heatmap of downregulated DEGs upon Brd4 suppression in regenerative metaplasia (Csh:Injury) or neoplastic transformation (KCsh:Kras*+Injury) settings across indicated conditions (as in Extended Data Fig. 4a). n=3 shRen.713 or shBrd4.1448 mice (rows) per condition. Normal C-shRen samples show expression levels of DEGs in healthy pancreas. Black squares delineate genes uniquely sensitive to Brd4 suppression in cells undergoing injury-driven regenerative (left) vs neoplastic (right) transitions. See Supplementary Table 4 for list of shBrd4-sensitive genes in each context. (Bottom) Chromatin accessibility dynamics at regulatory loci of shBrd4-sensitive genes, indicated by ATAC-cluster annotation. In b, d, data presented as means±s.e.m and significance assessed by unpaired two-tailed Student’s t-test (ns, non-significant). Scale bar, 100 μm.
Fig. 4.
Fig. 4.. A chromatin switch induced by gene – environment interactions defines the neoplastic transition.
a, Proportion of chromatin-dynamic DEGs (blue, red) vs chromatin-stable DEGs (grey) between Brd4-competent pancreatic epithelial cells (mKate2+) isolated from regenerating (Injury, n=5 mice), early neoplasia (Kras*, n=3; Kras*+Injury, n=4 mice) or invasive cancer (PDAC, n=3 mice) tissues vs from normal pancreas (Normal, n=4 mice). b, Unsupervised clustering of dynamic ATAC-peaks associated with DEGs distinguishing pancreatic epithelial cells (mKate2+) isolated from Injury (I), Kras* (K), Kras*+Injury (K+I), or PDAC tissue conditions vs Normal, and colored depending on whether they contain binding sites for acinar (NR5A2 and/or PTF1A) and/or neoplasia-associated (AP-1) TFs. Bar length represents Log2 fold changes of accessibility signals gained or lost in each condition vs Normal, as assessed by DESeq2 analyses (number of mice/group as in Fig. 1). c-d, GSEA comparing the expression of neoplasia-specific downregulated (left) or upregulated (right) epigenetic programs herein identified between human PDAC specimens and human normal pancreas (Moffitt et al. dataset) (c), or between shBrd4.1448- vs shRen.713-expressing pancreatic epithelial cells isolated from KC-GEMM mice (Kras*+Injury condition, n=3 per genotype) (d). e, UMAP visualization of single-cell ATAC-seq (scATAC-seq) profiles of 6369 Brd4-competent Kras-mutant pancreatic epithelial cells (mKate2+) isolated from Kras* and Kras*+Injury tissue conditions (n=1 mice each), and colored by the indicated tissue condition (left). Inferred activity scores for the acinar TF NR5A2 and AP-1 per individual cell are portrayed in color (right), displaying a switch in transcription factor activity in Kras-mutant cells upon tissue injury. f, AP-1 and NR5A2 activity scores of Kras-mutant cells (columns) annotated by tissue condition (as in e-left). g, Top-scoring pathways in GREAT ontology analyses of peaks positively or negatively correlated with the chromatin switch defined by increasing AP-1/NR5A2 activity ratios across the single cell epigenetic profiles of Kras-mutant cells shown in f.
Fig. 5.
Fig. 5.. Epigenetic dysregulation of IL-33 promotes neoplastic reprogramming.
a, Effects of Brd4 suppression (shBrd4.1448 vs shRen.713, y-axis) on the expression of the indicated cytokines or chemokines and their degree of activation in pancreatic epithelial cells during injury-facilitated neoplasia (x-axis). Factors exhibiting neoplasia-specific mRNA upregulation and ATAC-GAIN are marked in orange. b, Representative immunofluorescence of IL-33 (red) and GFP (green) in pancreata from Kras wild-type or Kras-mutant mice 2 days after tissue injury (caerulein) or control (PBS) (n=4 mice/group). Arrows point epithelial-cell (GFP-positive) Brd4-dependent activation of IL-33 in the Kras*+Injury (K+I) condition, which contrasts with the predominantly stromal (GFP-negative) pattern of tissues subject to caerulein (Injury) or Kras gene mutation (Kras*) alone. Nuclei counterstained with DAPI (blue). c,Volcano plots showing the cooperation between rIL-33 and mutant Kras in driving transcriptional reprogramming of the pancreatic epithelium, assessed by RNA-seq of mKate2+ epithelial cells isolated from Kras-wild type (C-GEMM) mice treated with rIL-33 (n=4) or vehicle (PBS; n=5) (left), or Kras-mutant (KC-GEMM) mice treated with rIL-33 (n=4) or vehicle (PBS, n=4) (right), at 21 day. d, GSEA comparing expression of genes induced (top) or repressed (bottom) upon damage (Kras*+Injury vs Kras*) in Kras-mutant epithelial cells isolated from rIL-33-treated (n=4) vs vehicle-treated (n=3) mice (day 0). rIL-33 treatment mimics transcriptional changes of tissue damage in Kras-mutant pancreata. e, Representative H&E or IHC (mKate2, Alcian blue) from Kras-wild type (C-GEMM) or Kras-mutant (KC-GEMM) mice treated with rIL-33 or vehicle (PBS), at 21 days (n=4 mice/group). f, Quantification of normal exocrine tissue (acinar) or metaplastic (ADM) and neoplastic (PanIN) lesion area in Kras-WT (left) or Kras-mutant (right) mice treated with rIL-33 or vehicle control, at 21 days. Pooled data presented as means±s.e.m. n=3, 4, 4 or 5 (from left to right) mice. (p=0.0169 for PanIN area in KC-GEMM rIL-33 vs vehicle, unpaired two-tailed Student’s t-test). Scale bars, 100 μm.

References

Main References

    1. Giroux V & Rustgi AK Metaplasia: tissue injury adaptation and a precursor to the dysplasia-cancer sequence. Nat Rev Cancer 17, 594–604, (2017). - PMC - PubMed
    1. Guerra C et al.Chronic pancreatitis is essential for induction of pancreatic ductal adenocarcinoma by K-Ras oncogenes in adult mice. Cancer Cell 11, 291–302, (2007). - PubMed
    1. Habbe N et al.Spontaneous induction of murine pancreatic intraepithelial neoplasia (mPanIN) by acinar cell targeting of oncogenic Kras in adult mice. Proc Natl Acad Sci U S A 105, 18913–18918, (2008). - PMC - PubMed
    1. Collins MA et al.Oncogenic Kras is required for both the initiation and maintenance of pancreatic cancer in mice. J Clin Invest 122, 639–653, (2012). - PMC - PubMed
    1. Hingorani SR et al.Preinvasive and invasive ductal pancreatic cancer and its early detection in the mouse. Cancer Cell 4, 437–450 (2003). - PubMed

Methods References

    1. Saborowski M et al.A modular and flexible ESC-based mouse model of pancreatic cancer. Genes Dev 28, 85–97, (2014). - PMC - PubMed
    1. Tasdemir N et al.BRD4 Connects Enhancer Remodeling to Senescence Immune Surveillance. Cancer Discov 6, 612–629, (2016). - PMC - PubMed
    1. Zuber J et al.RNAi screen identifies Brd4 as a therapeutic target in acute myeloid leukaemia. Nature 478, 524–528, (2011). - PMC - PubMed
    1. Dow LE et al.A pipeline for the generation of shRNA transgenic mice. Nat Protoc 7, 374–393, (2012). - PMC - PubMed
    1. Livshits G et al.Arid1a restrains Kras-dependent changes in acinar cell identity. Elife 7, (2018). - PMC - PubMed

Publication types

MeSH terms