. 2021 Apr;592(7852):128-132.
doi: 10.1038/s41586-021-03188-w. Epub 2021 Feb 3.

Skin-resident innate lymphoid cells converge on a pathogenic effector state

Affiliations

Skin-resident innate lymphoid cells converge on a pathogenic effector state

Piotr Bielecki et al. Nature. 2021 Apr.

Abstract

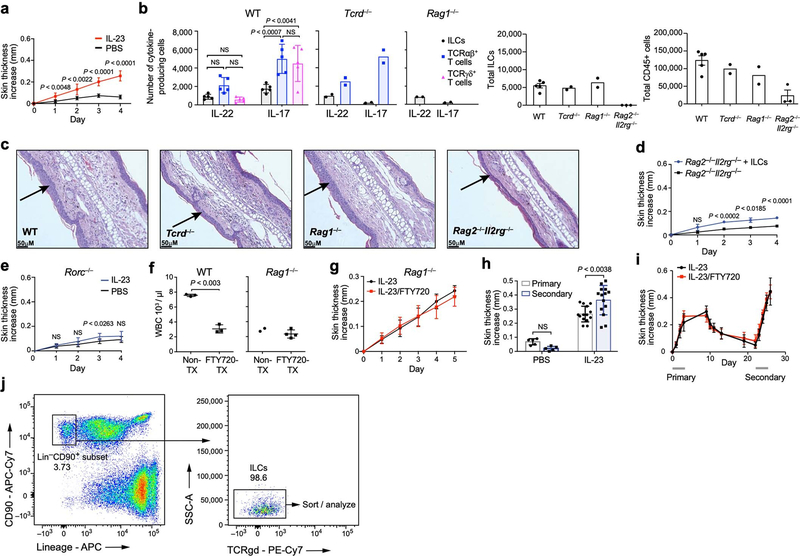
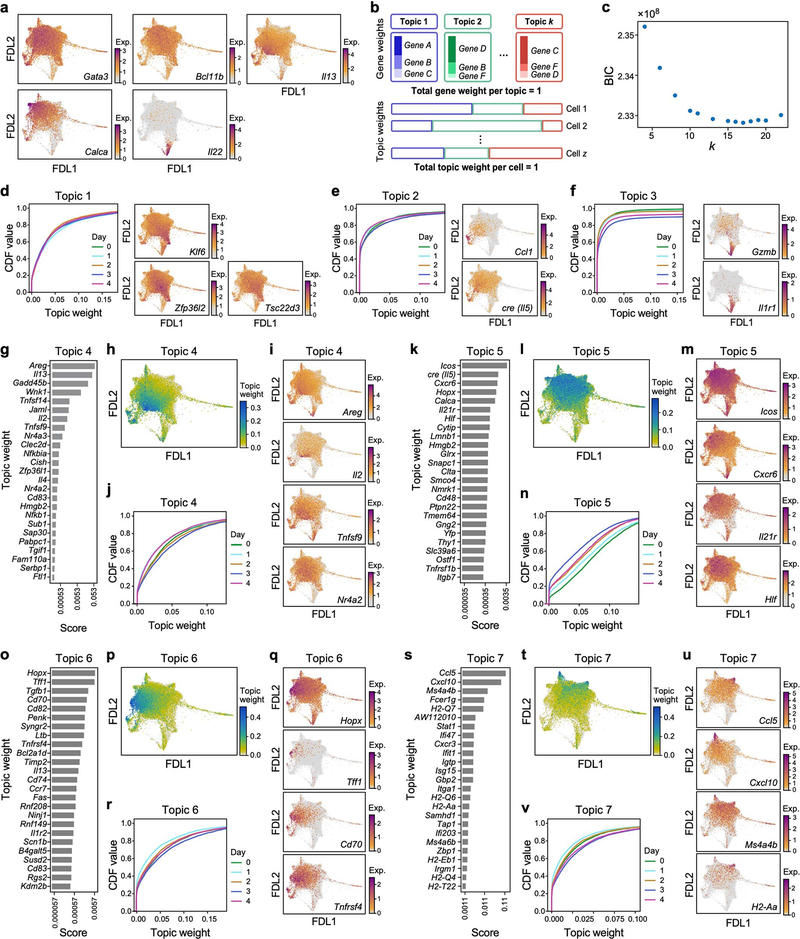
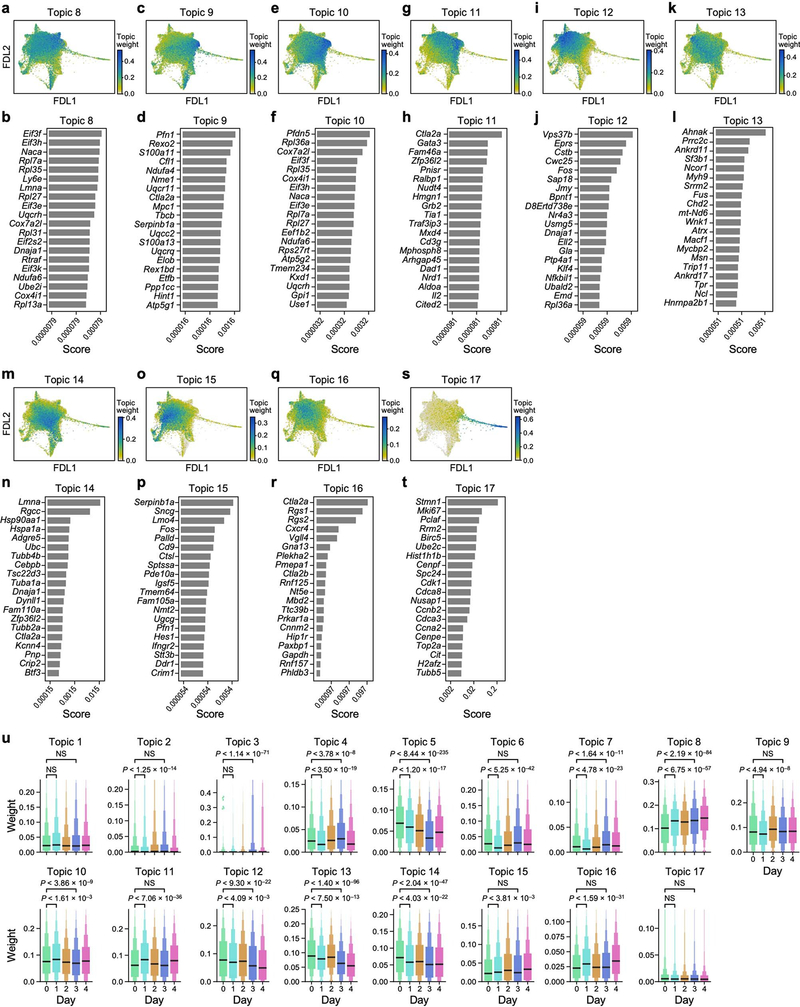
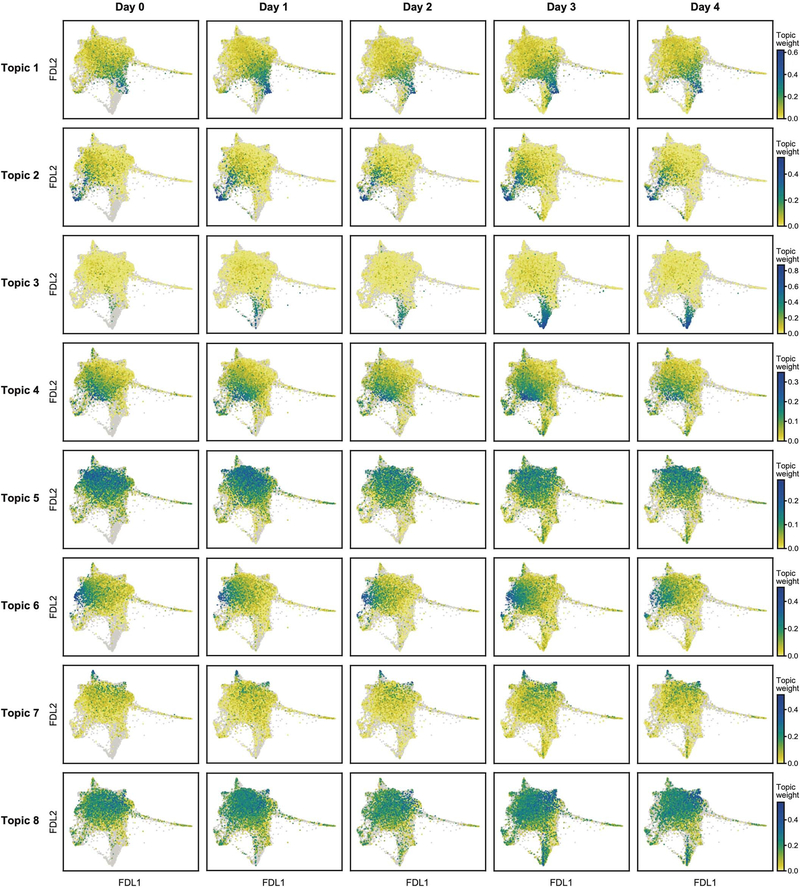
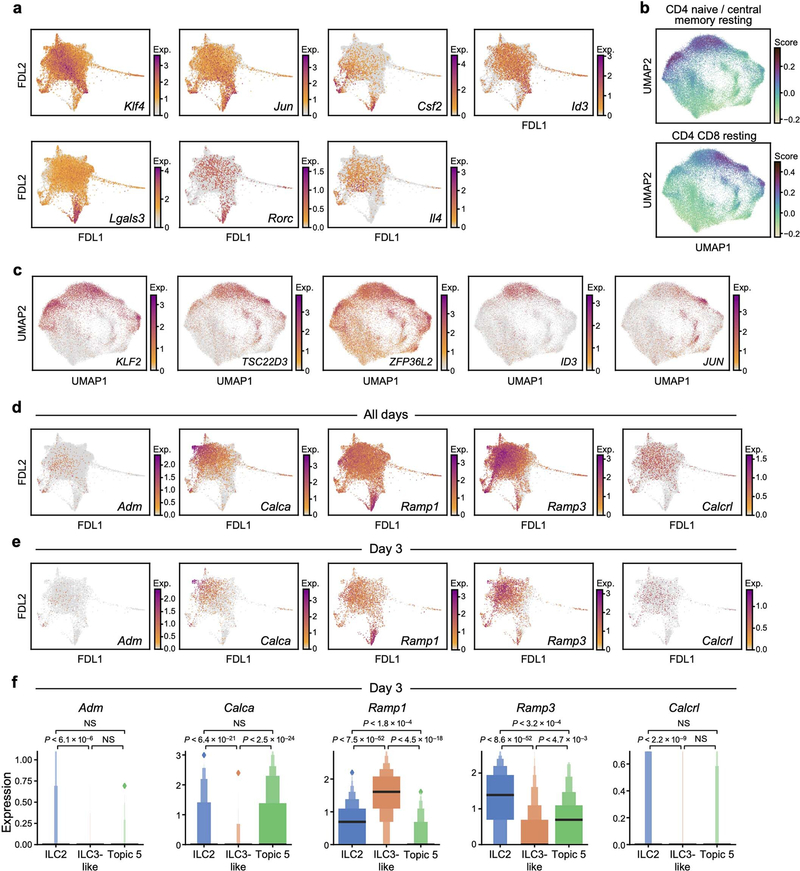
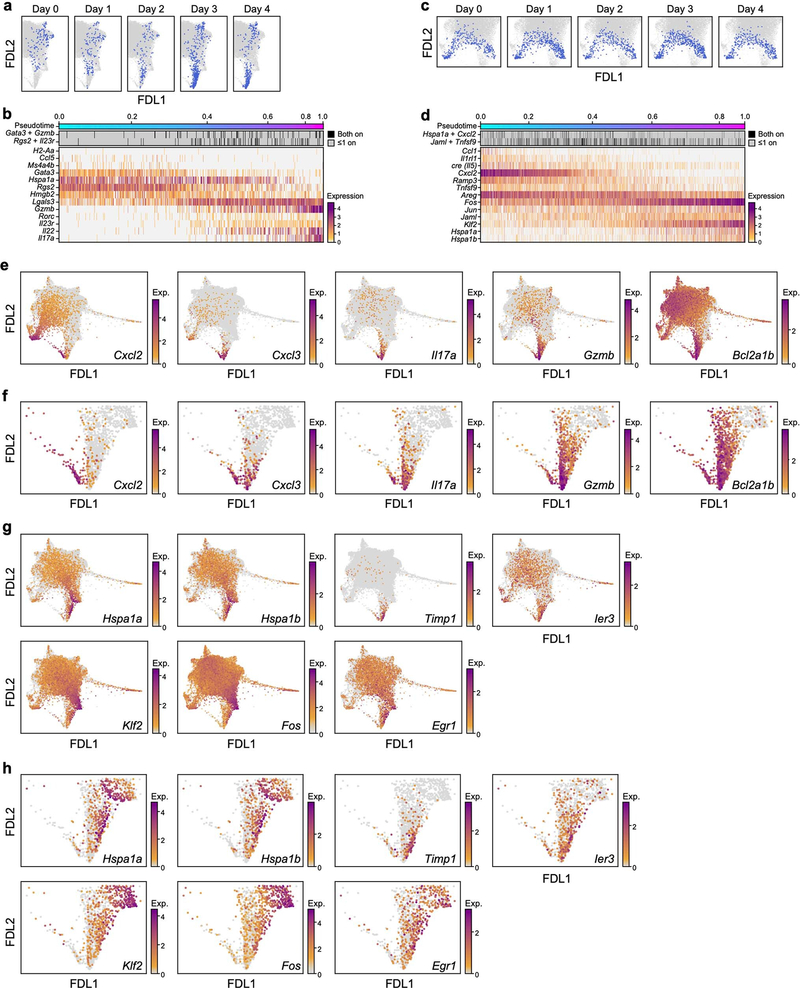
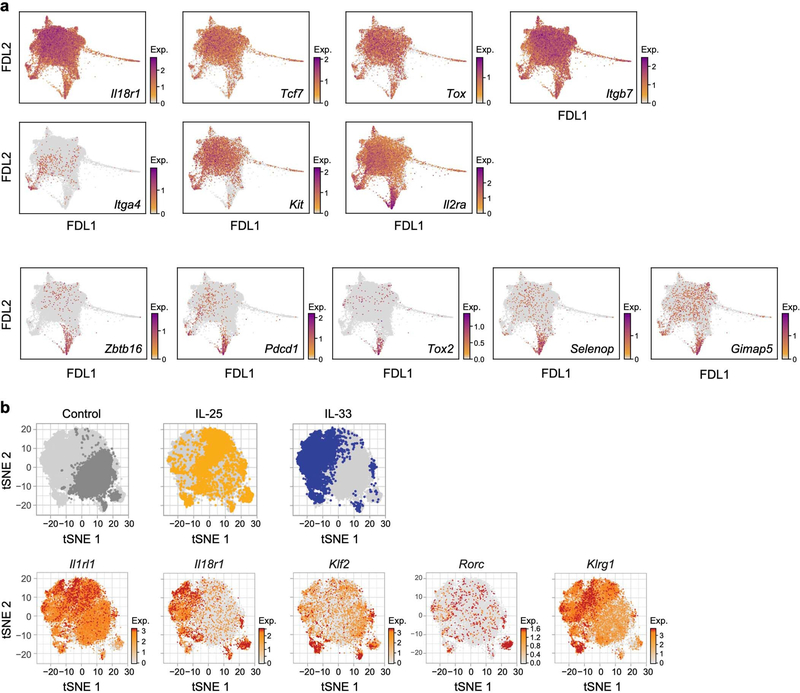
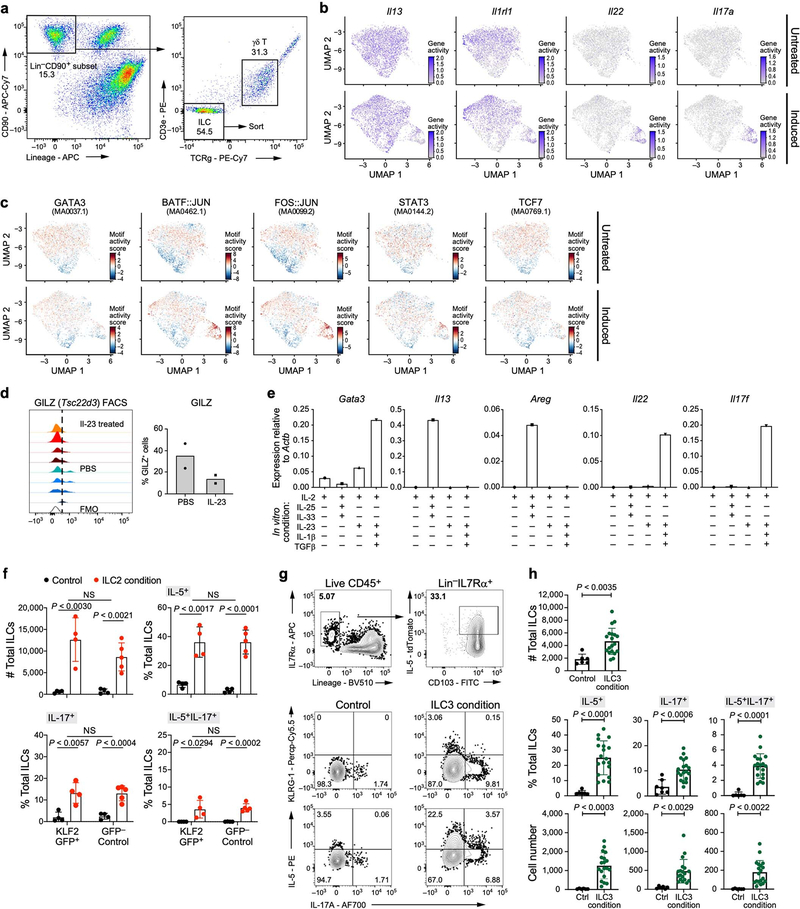
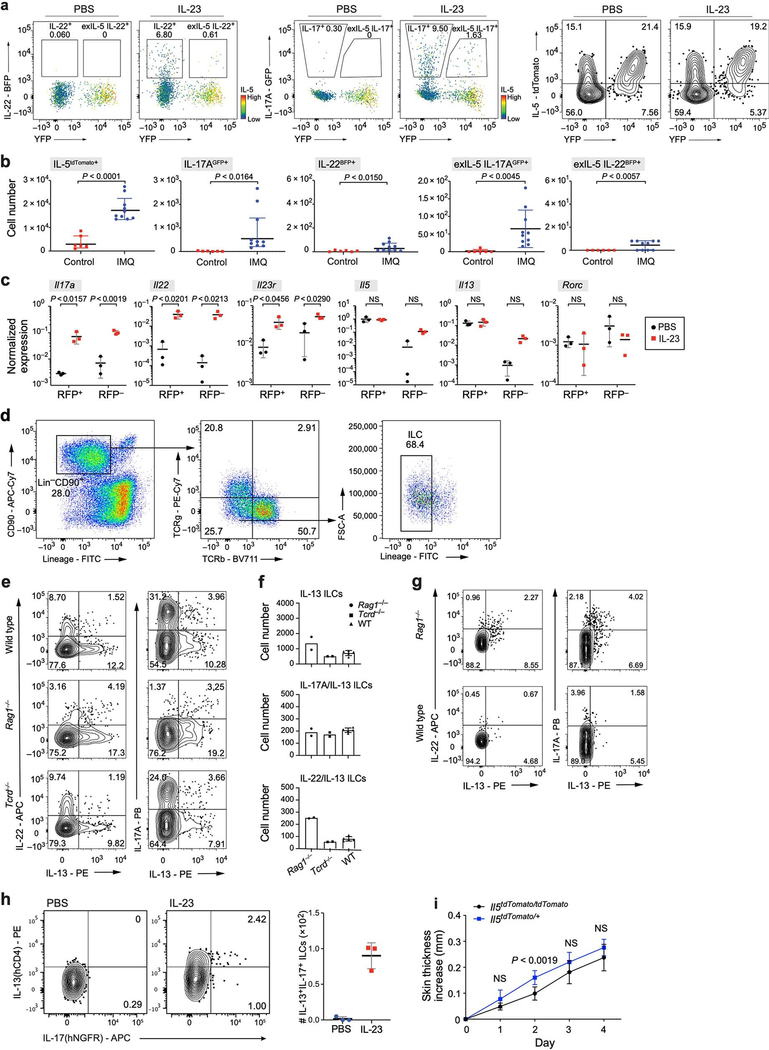
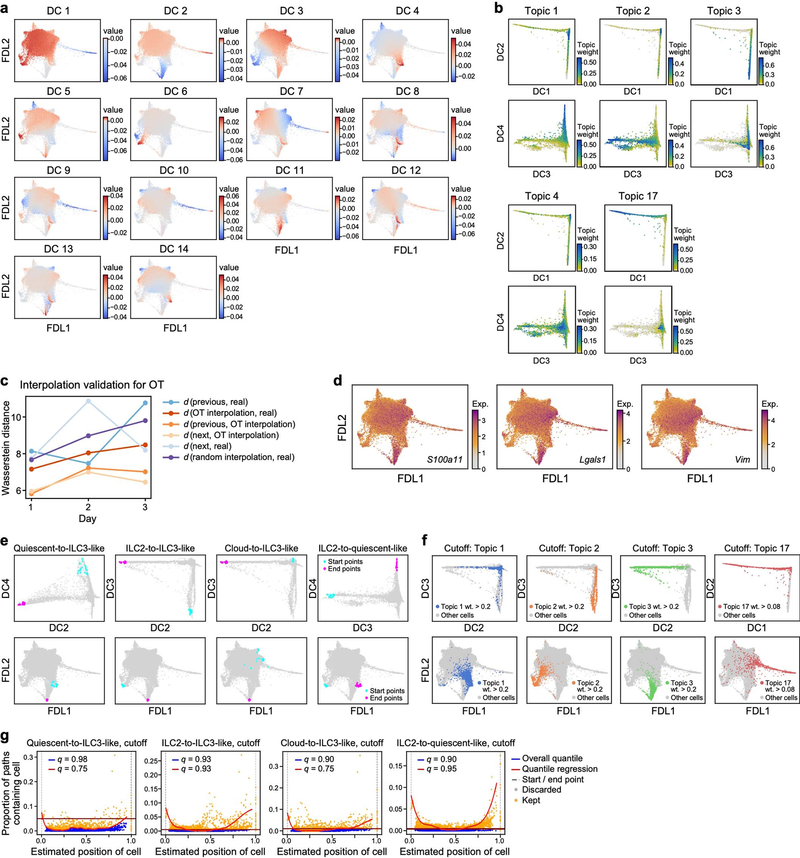
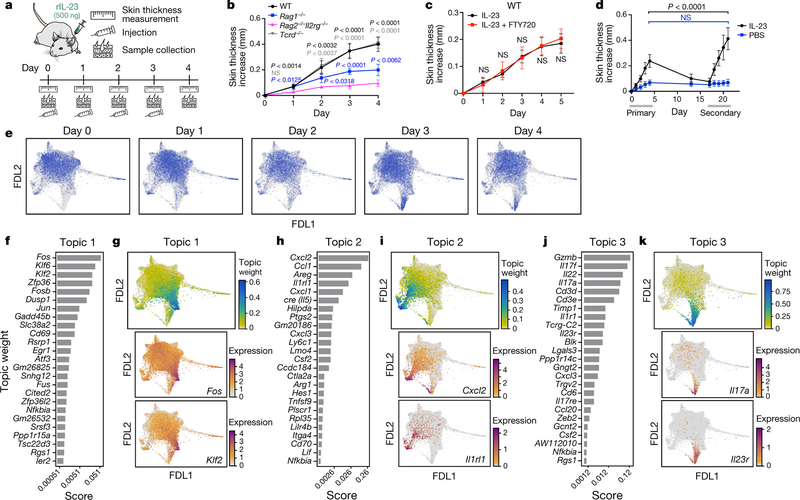
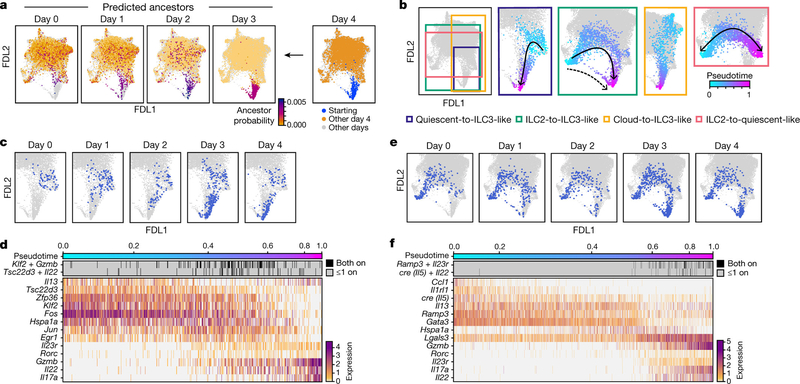
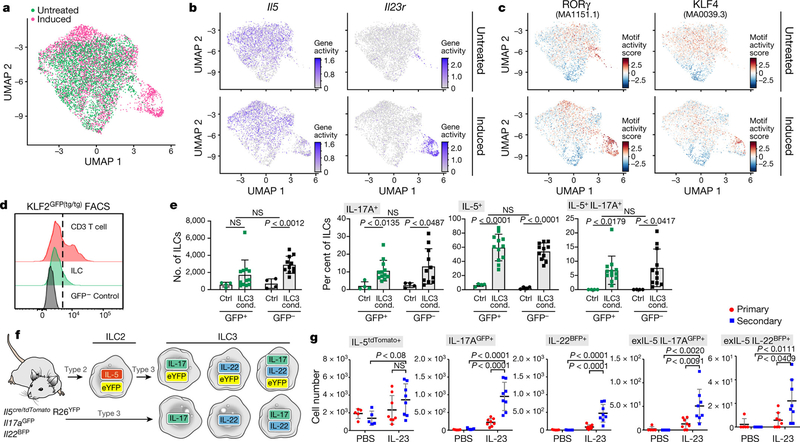
Tissue-resident innate lymphoid cells (ILCs) help sustain barrier function and respond to local signals. ILCs are traditionally classified as ILC1, ILC2 or ILC3 on the basis of their expression of specific transcription factors and cytokines1. In the skin, disease-specific production of ILC3-associated cytokines interleukin (IL)-17 and IL-22 in response to IL-23 signalling contributes to dermal inflammation in psoriasis. However, it is not known whether this response is initiated by pre-committed ILCs or by cell-state transitions. Here we show that the induction of psoriasis in mice by IL-23 or imiquimod reconfigures a spectrum of skin ILCs, which converge on a pathogenic ILC3-like state. Tissue-resident ILCs were necessary and sufficient, in the absence of circulatory ILCs, to drive pathology. Single-cell RNA-sequencing (scRNA-seq) profiles of skin ILCs along a time course of psoriatic inflammation formed a dense transcriptional continuum-even at steady state-reflecting fluid ILC states, including a naive or quiescent-like state and an ILC2 effector state. Upon disease induction, the continuum shifted rapidly to span a mixed, ILC3-like subset also expressing cytokines characteristic of ILC2s, which we inferred as arising through multiple trajectories. We confirmed the transition potential of quiescent-like and ILC2 states using in vitro experiments, single-cell assay for transposase-accessible chromatin using sequencing (scATAC-seq) and in vivo fate mapping. Our results highlight the range and flexibility of skin ILC responses, suggesting that immune activities primed in healthy tissues dynamically adapt to provocations and, left unchecked, drive pathological remodelling.


Conflict of interest statement

Competing interests R.A.F. is a scientific advisor to GlaxoSmithKline, and a shareholder and consultant for Zai Lab. A.R. is a founder and equity holder of Celsius Therapeutics, an equity holder in Immunitas Therapeutics and until 31 August 2020 was an SAB member of Syros Pharmaceuticals, Neogene Therapeutics, Asimov and ThermoFisher Scientific. From 1 August 2020, A.R. has been an employee of Genentech, a member of the Roche Group. P.B. is an equity holder in Celsius Therapeutics. P.B., S.J.R, J.-C.H., E.T.T., M.S.K, A.R. and R.A.F are co-inventors on US Patent Application No. 16/681,050 directed to methods and compositions for modulating innate lymphoid cell pathogenic effectors described in this study. All other authors declare no competing interests.

Figures

Extended Data Fig. 1
Extended Data Fig. 1. Characterization of skin immune cells upon IL-23 induction.
a, Increase in ear skin thickness is significantly greater in response to IL-23 treatment than PBS vehicle. Increase in ear thickness (mean ± s.d.) following treatment with IL-23 (red, n = 10 mice) or PBS vehicle (black, n = 10 mice). Data from 2 independent experiments; repeated measures two-way ANOVA with Geisser–Greenhouse correction, Bonferroni adjusted. b, c, Immune cell composition and skin phenotype in different mouse genotypes (corresponding to the experiment in Fig. 1b). b, Left three panels: number of cells producing IL-22 or IL-17 among ILCs (black dots, bars), αβ T cells (blue squares, bars) and γδ T cells (pink triangles, bars) in wild-type, Tcrd−/− (lacking γδ T cells), and Rag1−/− (lacking all T cells and B cells) mice. Right two panels: number of total ILCs or total CD45+ cells in wild-type, Tcrd−/−, Rag1−/− and Rag2−/− Il2rg−/− (lacking T cells, B cells, and ILCs) mice. n = 5 WT, n = 3 Rag2−/−Il2rg−/−, n = 2 Tcrd−/−, n = 2 Rag1−/− mice; statistics given for WT, two-way ANOVA, Bonferroni adjustment. Experiments were repeated with similar results. c, Haematoxylin and eosin (H&E) staining of ear sections from wild-type, Tcrd−/−, Rag1−/− and Rag2−/−Il2−/− mice. Arrows indicate acanthosis. Representative micrographs of two independent experiments. d, Increase in skin thickness (mean ± s.d.) over time in Rag2−/−Il2rg−/− mice with (blue) or without (black) intravenously transferred ILCs. n = 4 mice for each group, pooled from 3 experiments; repeated measures two-way ANOVA with Geisser–Greenhouse correction, Bonferroni adjusted. e, IL-23-induced inflammation is dependent on Rorc. Increase in ear thickness (mean ± s.d.) following treatment with IL-23 (blue, n = 9 mice) or PBS vehicle (black, n = 8 mice) in Rorc−/− mice. Data pooled from 2 experiments; repeated measures two-way ANOVA with Geisser–Greenhouse correction, Bonferroni adjusted. f, FTY720 blocks white blood cell circulation. Total circulatory white blood cell (WBC) numbers (mean ± s.d.) in untreated (non-Tx) and FTY720-treated (FTY720-Tx) wild-type (n = 3 mice for each group) and Rag1−/− mice (n = 2 mice non-Tx, n = 4 mice FTY720-Tx). Unpaired two-tailed Welch t-test for wild-type mice. g, IL-23-dependent increase in ear skin thickness does not require circulating cells. Increase in skin thickness (mean ± s.d.) over time following IL-23 treatment in FTY720-treated (red) and untreated (black, non-Tx) Rag1−/− mice (Methods). n = 4 Rag1−/− non-Tx, n = 8 Rag1−/− FTY720-Tx mice; data from 2 independent experiments; difference not significant; repeated measures two-way ANOVA with Geisser–Greenhouse correction, Bonferroni adjusted. h, A secondary challenge with IL-23 increases susceptibility. Increase in skin thickness (mean ± s.d.) owing to primary (white) or secondary (blue) challenges by either IL-23 (n = 14 mice) or saline control (PBS) (n = 5 mice). Data from 2 independent experiments;, repeated measures two-way ANOVA, Bonferroni adjusted. i, FTY720 treatment does not impact increased susceptibility to a secondary IL-23 challenge. Increase in skin thickness (mean ± s.d.) over time in mice treated initially with either IL-23 (black) or IL-23 and FTY720 (red) and subsequently with IL-23 (Methods). Bottom bars (grey): period of primary (left) and secondary (right) challenges. n = 6 IL-23 only, n = 6 IL-23 and FTY720. j, Gating strategy on CD45+ cells for sorting total skin ILCs for scRNA-seq and IL-5 fate mapping experiments. ILCs are defined as CD90.2+ and Lin (CD3e, CD4, CD8, TCRβ, CD11b, CD11c, CD19, B220, NK1.1, Ter119, Gr1, FcεRIa), followed by exclusion of TCRγδ+ cells.
Extended Data Fig. 2
Extended Data Fig. 2. Topic modelling of scRNA-seq time course.
a, Localized expression of ILC-associated genes. FDL embedding (as in Fig. 1e) with cell profiles (dots), coloured by normalized expression (log-transformed scTransform-corrected counts) of selected genes. b, LDA topic modelling schematic in the context of single-cell gene expression. Topics (top) consist of genes (middle), weighted (bar height, colour gradient) according to their importance in the topic. Cell transcription profiles (bottom rows) are characterized by the contribution (bar length) of each topic (colour); a cell can have multiple topics. c, In our analysis, K = 17 is optimal according to the Bayesian Information Criterion (BIC). Plot of BIC for selected choices for the number K of topics. df, Additional plots for topics 1–3, as in Fig. 1f–k. d, For ‘quiescent-like’ topic 1, plot (left) of the empirical cumulative distribution functions (eCDF) of topic weights, grouped and coloured by time point and cropped to the overall 95th percentile of the topic weights, and FDL plots (right) of cells, coloured by normalized expression (colour bar; low, grey; high, maroon) of topic-associated genes. Analogous plots are shown for ‘ILC2’ topic 2 (e) and ‘ILC3-like’ topic 3 (f). gv, LDA model results for topics 4–7. For ‘Il2-high’ topic 4, bar plot of top scoring genes, ranked by a score (logarithmic scale) of how well the gene distinguishes this topic from other topics (g); FDL plot (as in a) of cells, coloured by topic weight (colour bar; low, grey; high, teal) (h) or by normalized expression (colour bar; low, grey; high, maroon) of topic-associated genes (i); eCDF plots of topic weights (as in d) (j). Analogous plots shown for topics 5 (kn), 6 (or) and 7 (sv).
Extended Data Fig. 3
Extended Data Fig. 3. More topic modelling results, including topics 8–17 and changes in topic score distributions across time points.
at, LDA model results for topics 8–17 (Methods). For topic 8: FDL embedding (as in Fig. 1e) of scRNA-seq profiles (dots), coloured by topic weight (colour bar; low, grey; high, teal) (a); bar plot of top scoring genes (y axis), ranked by a score (x axis, logarithmic scale) that represents how well the gene distinguishes this topic from other topics (b). Analogous plots shown for topics 9–17 (c–t). u, Distributions of topic weights at each time point. For each topic, topic weights at each time point (colour) were plotted as enhanced box plots, indicating median (black bar) and geometric progression of quantiles (progressively decreasing box widths for 75th, 87.5th, 93.75th, 96.875th and 98.4375th percentiles, and analogously for 25th, 12.5th, 6.25th, 3.125th and 1.5625th percentiles), cropped at the 98.4375th percentile. Bonferroni-adjusted P values, determined by a two-sided Mann–Whitney U-test with continuity correction, or no significance (NS, P > 1%). n = 5,290 for day 0, n = 6,051 for day 1, n = 6,525 for day 3.
Extended Data Fig. 4
Extended Data Fig. 4. Dynamic changes in topic weights highlight rapid induction of ILC3-like (topic −3-high) cells.
FDL embedding (as in Fig. 1e) of scRNA-seq profiles (dots), for each day (columns), with profiles coloured by topic weight (colour bar; low, yellow; high, teal; cells from other days shown in grey), for topics 1–8 (rows) (out of 17 topics; Methods). To highlight the difference between cells with low topic weight in a specific day compared to cells from other days, this colour legend differs from that used in Fig. 1g, i, k, Extended Data Figs. 2h, l, p, t, 3a, c, e, g, i, k, m, o, q, s, in the very low-weight region (here yellow instead of grey).
Extended Data Fig. 5
Extended Data Fig. 5. Expression of other topic-related genes, comparison of mouse skin ILCs to resting human T cells, and expression patterns of CGRP-signalling genes.
a, FDL embedding (as in Fig. 1e) of scRNA-seq profiles (dots) coloured by normalized expression (colour bar; low, grey; high, maroon) of selected genes (panels) associated with topic 1 (Klf4, Jun and Id3), topics 2 and 3 (Csf2), topic 3 (Lgals3 and Rorc) and topic 4 (Il4). b, c, Genes associated with quiescent-like topic 1 were also observed in resting human T cells. UMAP embedding of scRNA-seq profiles (dots) of human T cells [29], coloured by scores (colour bar; low, yellow; mid, teal; high, purple) for gene signatures associated with CD4 or CD8 resting, naive and central memory T cells (b), or by log(TP10k) (log of (1 + transcript counts scaled to 10,000 per cell)) gene expression (colour bar; low, grey; high, maroon) for topic-1-associated genes (c) (Methods). df, CGRP-signalling genes have distinct patterns of differential expression in cells enriched in topics 2, 3 or 5. FDL embedding (as in Fig. 1e) of cells from all time points (d) or from only day 3 (e), coloured by normalized expression (colour bar; low, grey; high, maroon) of CGRP-associated genes (panel labels). Ramp1 and Calcrl form a receptor for CGRP, encoded by Calca (which also encodes calcitonin or katacalcin, depending on splicing and processing), whereas Ramp3 and Calcrl form a receptor for adrenomedullin (Adm), and a weak-affinity receptor for CGRP. f, Normalized expression of each gene (panels) on day 3 is shown for non-overlapping subsets of cells with relatively high weights for ‘ILC2’ topic 2, ‘ILC3-like’ topic 3, or ‘Calca-high’ topic 5 (Methods). Enhanced box plots indicate geometric progression of quantiles (that is, 50th, 75th and 87.5th percentiles, as in Extended Data Fig. 3u), cropped at the 98.5th percentile. Bonferroni-adjusted P values between two distributions were determined by a two-sided Mann–Whitney U-test with continuity correction. n = 632 for ILC2s, n = 224 for ILC3-like cells, n = 38 for topic −5-high cells.
Extended Data Fig. 6
Extended Data Fig. 6. Additional analysis of skin ILC trajectories and of differential gene expression in ILC3-like cells originating along different trajectories.
ad, Additional visualizations for trajectories identified by directed diffusion (as in Fig. 2b). For the cloud-to-ILC3-like trajectory: FDL embedding (as in Fig. 2a) with cells (dots) in the trajectory highlighted in blue for each day (panel title, cells not inferred to be in the trajectory or from other days in gray) (a), and heat map of co-expression (top) and normalized expression (bottom; colour bar: low, grey; high, burgundy) of trajectory-associated genes (rows) in cells (columns), ordered by pseudotime (colour bar, top) (b). Analogous plots are shown for the potentially bidirectional ILC2-to-quiescent-like trajectory (c, d). eh, Distinct trajectories leading to ILC3-like cells are characterized by differentially expressed genes (Methods). FDL embedding (as in Fig. 1e) including all cells (e), and cropped to focus on ILC3-like cells (f), shows cell profiles (dots), coloured by normalized expression (colour bar: low, grey; high, maroon) of genes (panels) more highly expressed by ILC3-like cells in the ILC2-to-ILC3-like trajectory (as in Fig. 2b, e–f) than by other ILC3-like cells, including Bcl2a1b, which is specifically low in quiescent-like cells, compared to other ILCs. Analogous plots are shown for genes with higher expression in the quiescent-to-ILC3-like trajectory, compared to other ILC3-like cells (g, h). P values in Supplementary Table 4.
Extended Data Fig. 7
Extended Data Fig. 7. Skin ILC similarities to and differences from mouse bone marrow and lung ILC precursors.
a, ILC-precursor markers have distinctive expression patterns in skin ILCs. While IL-18Rα+ST2 ILC2s were identified as precursors in lung [17, 18], most skin ILCs express Il18r1 but not Il1rl1, (as in Fig. 1i), and Klf2 is highest in quiescent-like cells (as in Fig. 1g). FDL embedding (as in Fig. 1e) shows cell profiles (dots) from all time points, coloured by normalized expression (log-transformed scTransform-corrected counts, Methods; colour bar; low, grey; high, maroon) of precursor-associated genes, including those that are broadly expressed in skin ILCs (top row, Il18r1, Tcf7, Tox and Itgb7), highly expressed in topic-2-high (‘ILC2’) cells (middle row, Itga4 and Kit), lowly expressed in topic-1-high (‘quiescent-like’) cells (middle row, negative marker Il2ra, which encodes CD25), or highly expressed in topic-3-high (‘ILC3-like’) cells (bottom row, Zbtb16, Pdcd1, Tox2, Selenop and Gimap5). Note that integrin proteins encoded by Itgb7 and Itga4 form the heterodimeric integrin receptor α4β7. b, Klf2 expression is associated with high Il18r1 and low Il1rl1 expression in lung ILCs [35], both in steady state and in induced ‘inflammatory ILC2s’ [7]. t-distributed stochastic neighbour embedding (tSNE) of lung-resident ILCs (dots), coloured by experimental condition (top row: PBS control, dark grey; orange, IL-25 stimulation; blue, IL-33 stimulation; light grey, cells from other conditions), and by logTPX (Methods) normalized expression (bottom row: colour bar: low, grey; high, red) of genes used to delineate lung precursors [17] (Il18r1 and Il1rl1), ‘quiescent-like’ topic 1-associated Klf2, ILC3-required transcription factor Rorc, and IL-25-induced ‘inflammatory-ILC2’ marker Klrg1.
Extended Data Fig. 8
Extended Data Fig. 8. Potential for skin ILCs to transition to ILC3-like states is highlighted by chromatin accessibility and in vitro stimulation.
ac, Single-cell ATAC-seq profiles reveal accessible chromatin at ILC2-, ILC3- and quiescence-associated loci (Methods). a, Gating strategy on CD45+ cells used to sort total ILCs for scATAC-seq. ILCs are defined as CD90.2+ and lin (CD4, CD8, TCRβ, CD11b, CD11c, CD19, B220, NK1.1, Ter119, Gr1, FcεRIa), followed by additional exclusion of CD3e+ and TCRγδ+ cells. b, UMAP embedding shows scATAC-seq profiles (dots) from untreated (top) or IL-23-induced (bottom) mice, coloured by chromatin accessibility (colour bar; low, grey; high, violet) at the promoter and gene loci of ILC2 genes (Il13 and Il1rl1) and ILC3 genes (Il22 and Il17a). c, UMAP embedding (as in b) shows profiles from untreated (top) or IL-23–induced (bottom) mice, coloured by motif activity score (colour bar: low, blue; high, red; Methods) for the ILC-associated transcription factors GATA3 (JASPAR motif code: MA0037.1, required for ILC2), BATF–JUN (MA0462.1, required for ILC3), FOS–JUN (MA0099.2, associated with ‘quiescent-like’ topic 1), STAT3 (MA0144.2, TH17-reponse regulator), and precursor-associated TCF7 (MA0769.1). d, Protein measurements validate reduced post-induction production of Tsc22d3 (associated with ‘quiescent-like’ topic 1, encoding the transcription factor GILZ). Left, distributions of protein levels, measured by flow cytometry following intracellular staining of GILZ in skin ILCs from mice treated with IL-23 (top 4 tracks, red), compared with PBS (lower 4 tracks, blue) and fluorescence minus one (FMO) control (bottom track, clear). n = 4 mice for both groups, representative data from 2 experiments. Right, proportion of Gilz+ cells (average values of two independent experiments) in control and IL-23-treated mice. eh, In vitro validation of ILC2 and ILC3-like potential. e, Cultured skin ILCs from untreated mice express type 2- (Gata3, Il13 and Areg) and type 3- (Il22 and Il17f) associated genes (panels), when appropriately stimulated. Relative expression was measured by rtPCR on total cDNA extracted from ILCs cultured for 5 days in the presence of IL-2 and ILC2-inducing cytokines (IL-25 and IL-33) or ILC3-inducing cytokines (IL-1β, IL-23 and TGFβ). Two biological replicates pooled for RNA extraction and rtPCR, n = 1 for each gene. f, Numbers (top left) of KLF2GFP+ or KLF2GFP− skin ILCs cultured in control or ILC2-inducing conditions (IL-25 and IL-33), and percentages of these cells producing IL-5, IL-17 or both IL-5 and IL-17, based on intracellular staining after 2.5 h of PMA and ionomycin stimulation (Methods). Data are pooled from 3 independent experiments (n = 4 wells control and GFP ILC2 induced, n = 5 GFP+ induced; unpaired two-tailed t-test). g, FACS plots showing the sorting strategy for the isolation of IL-5-producing (tdTomato+) skin ILC2s from Il5cre/tdTomato (Red5) mice (top row) and analysis of the production of KLRG-1, IL-17A and IL-5 in tdTomato+ skin ILCs (remaining panels), cultured in control or ILC3-inducing conditions (IL-1β, IL-23, IL-18 and TGFβ), based on intracellular staining after 2.5 h of PMA and ionomycin stimulation (Methods). The lack of cells producing both KLRG-1 and IL-17A suggests that ‘inflammatory ILC2s’ do not underlie an ILC2-to-ILC3-like transition. h, Numbers (top) of IL-5tdTomato+ skin ILCs cultured in control or ILC3-inducing conditions (as in g), and percentages (middle row) and numbers (bottom row) of these cells producing IL-5, IL-17 or both, based on intracellular staining after 2.5 h of PMA and ionomycin stimulation (Methods). Data are pooled from three independent experiments; n = 6 control, n = 19 treated wells; error bars are mean ± s.d.; unpaired, two-tailed t-test. ILCs from KLF2-GFPtg/tg reporter and Red5 reporter for in vitro cultures were sorted as live CD45+IL-7Rα+lin (CD3ε, CD5, CD11b, CD11c, CD19, B220, NK1.1, Ter119, Gr1, FcεRIa, TCRβ, TCRγ) GFP+ or GFP for KLF2 expression, or CD103+ for IL-5 expression in Red5 mice.
Extended Data Fig. 9
Extended Data Fig. 9. Reporter mouse systems confirm ILC2-to-ILC3-like transition of committed IL-5+ ILC2s, and mixed ILC2–ILC3 state.
a, exIL-5 cells that transdifferentiated to produce IL-22 and IL-17A no longer produce IL-5. FACS analysis indicates joint expression of the IL-5 fate reporter YFP and IL-22-BFP (left two graphs) or IL-17A-GFP (middle two graphs). Additionally, not all IL-5Cre/tdTomato+ cells recombine efficiently to be YFP+ cells (right two graphs), which suggests a greater actual number of exIL-5 cells. b, Alternative psoriasis model (imiquimod) also drove an increase in IL-17A-producing cells, including in exIL-5 cells, but induced less IL-22 production. Number of cells with the indicated reporter configuration in untreated mice (red squares) and mice topically treated with imiquimod over 10 days (blue circles). Data from 2 independent experiments; mean ± s.d.; n = 6 untreated, n = 10 imiquimod-treated mice. c, Expression (rtPCR) of genes (panels) in skin ILCs with (RFP+) and without (RFP) recorded IL-13 fate mapping (Methods) from PBS- and IL-23-treated Il13YetCre/+R26RAi14RFP/+ mice. n = 3 biological replicas for each group; two-way ANOVA, Bonferroni adjusted. d, Gating strategy on CD45+ cells for experiment in eg. ILCs are defined as CD90.2+ and lLin (CD4, CD8, TCRβ, CD11b, CD11c, CD19, B220, NK1.1, Ter119, Gr1, FcεRIa), followed by additional exclusion of CD3e+ and TCRγδ+ cells. e–h, IL-23 treatment induces cells producing both IL-13 and IL-22 or both IL-13 and IL-17A. e, FACS plots show production of IL-13, IL-22 (left), and IL-17A (right) after IL-23 induction in wild-type (top, n = 5), Rag1−/− (middle, n = 2) and Tcrd−/− (bottom, n = 2) mice, measured by intracellular cytokine staining of skin ILCs stimulated by PMA and ionomycin. f, Summary of the number of cells producing IL-13 (top), and co-producing IL-13 and IL-17A (middle) or IL-13 and IL-22 (bottom) in each mouse genotype. Error bars for WT are mean ± s.d. Experiments were repeated with similar results. g, FACS plots analogous to those in e (excluding Tcrd−/−), with mice treated with IL-23 and IL-1β with intracellular cytokine staining done without ex vivo PMA and ionomycin treatment (representative plots of n = 4 mice for each group, two experiments). h, Representative FACS plots show production of IL-13 (reported by human CD4) and IL-17A (reported by human NGFR) in skin ILCs from reporter mice (Il13Smart/SmartIl17aSmart/Smart) on the wild-type background (Methods) (n = 3 biological replicas per group). ILCs were defined as CD45.2+CD90.2+IL-7Ra+ and Lin (CD3, CD4, CD5, CD8α, CD11b, CD11c, CD19, NK1.1, F4/80, Gr-1, CD49b, FcεRIa and Ter119). i, IL-23 skin injection model in Il5cre/tdTomato (Red5) mouse strain. Increase in skin thickness (mean ± s.d.) over time is similar in homozygote Red5/Red5 mouse strain lacking expression of IL-5 cytokine (black) and in Red5/+ mouse (blue). n = 8 mice for both groups, two independent experiments; repeated measures two-way ANOVA with Geisser– Greenhouse correction, Bonferroni adjusted.
Extended Data Fig. 10
Extended Data Fig. 10. Methods-related visualizations of the scRNA-seq analysis.
a, b, Axes of variation in gene expression profiles captured by diffusion components (Methods). Diffusion components (DCs) calculated on standardized expression data (Pearson residuals of scTransform-corrected counts) capture axes of variation related to topic modelling. a, For DCs 1–14 (panels), FDL embedding (as in Fig. 1e) of cell profiles (dots), coloured by the coordinate value (colour bar; low, blue; high, red) for each diffusion component. b, For topics 1–4 and 17, scatter plots show cell profiles (dots), plotted by DC 1 versus DC 2 (top), or DC 3 versus DC 4 (bottom), and coloured by topic weight (colour bar: low, grey; high, teal). DCs 2–4 were used to determine start and end positions for the directed-diffusion trajectories (Fig. 2b), since they reflect extremal points of the gene expression spectrum. c, Interpolation validation for Waddington-OT results (Methods). Interpolating cell distributions at intermediate time points by optimal transport (OT) captures the actual distributions better than random interpolation. Entropic OT distance (Wasserstein distance, d) between different pairs (colours) of empirical probability distributions, plotted for consecutive triples of time points (midpoint, x axis; for example, 1 refers to triple of days 0, 1, 2), for cell distributions at previous, current, and next time points (‘previous’, ‘real’ and ‘next’, respectively), and for OT and random interpolations between the previous and next time point distributions. dg, Topic-9-associated genes and additional information about cell selections for directed-diffusion trajectories in Fig. 2b (Methods). d, FDL embedding (as in Fig. 1e) of cell profiles, coloured by normalized expression (log transformed scTransform-corrected counts; colour bar: low, grey; high, maroon) for genes that are differentially expressed in cells up-weighted for topic 9, compared with other cells. e, Visualization of cell profiles (dots), coloured by membership in the start (cyan) or end (fuchsia) sets (or grey, otherwise), for each of the directed-diffusion trajectories. Plots show diffusion components (top; DC2, x axis, DC4, y axis for quiescent-to-ILC3-like and ILC2-to-quiescent-like trajectories; DC2, x axis, DC3, y axis for ILC2-to-ILC3-like and cloud-to-ILC3-like trajectories), and FDL embedding (bottom, as in Fig. 1e). f, Visualization of cells explicitly excluded from the potential starting set for the cloud-to-ILC3-like trajectory. For topics 1–3, cells (dots) are plotted by diffusion components (top; DC2, x axis, DC3, y axis) and FDL embedding (bottom), and coloured brightly if their topic weight exceeds the threshold of 0.2, or grey otherwise. Analogous panels for topic 17 showing DC1/DC2 and with threshold 0.08. g, Cell selection for directed-diffusion trajectories in Fig. 2b. For each trajectory (panel), the proportion of sampled paths that a cell occurred in versus the mean normalized pseudotime position for cells (dots) from all time points. Cells are considered part of the trajectory (in orange) if they occur at the very start or end of the paths (0 and 1 on x axis, grey dashed lines), or are contained in sufficiently many sampled paths, as determined by either a global quantile cut-off (blue line) or an adaptive quantile cut-off that depends on the average path position of the cell (red line, spline quantile regression), with different cut-offs chosen for each trajectory. Remaining cells (grey) are excluded from the trajectory.
Fig. 1:
Fig. 1:. Skin ILCs drive IL-23–induced pathology.
a, Study overview. rIL-23, recombinant IL-23. b–d, Tissue-resident ILCs are sufficient to drive IL-23–induced inflammation. Increase in skin thickness over time in wild-type (WT) (black), Rag1−/− (blue), Rag2−/− Il2rg−/− (magenta) and Tcrd−/− (grey) mice (b; n = 7 mice per group, 2 independent experiments), wild-type mice with (red) and without (black) FTY720 treatment (c; n = 6 mice per group, no significant difference), and wild-type mice during primary and secondary IL-23 challenge (black) (n = 8 mice) or saline control (blue) (PBS) (d; n = 5 mice, 2 independent experiments). Data are mean ± s.d.; P values determined by repeated measures two-way analysis of variance (ANOVA) with Geisser–Greenhouse correction, Bonferroni adjusted. In b, Rag2−/−Il2rg−/− are a negative control group. NS, not significant. e, ScRNA-seq profiles of cells (dots), highlighted by time point (panel title, dots in blue, versus grey for other time points) in a force-directed layout (FDL) embedding of a k-nearest-neighbours graph. fl, Topic modelling of ILC scRNA-seq data infers functional programs. For topic 1 (f, g), topic 2 (h, i) and topic 3 (j, k), genes are ranked by a score distinguishing each topic from others (f, h, j), and cells are coloured by topic weight (top) or normalized expression (log-transformed scTransform-corrected counts) of topic-associated genes (middle and bottom) (g, i, k).
Fig. 2:
Fig. 2:. Convergent transitions to ILC3-like cells.
a, Optimal transport predicts that ILC3-like cells arise from a broad range of skin ILCs. FDL embedding (as in Fig. 1e, but excluding proliferating cells) with cells for each day (0–3) coloured by the estimated probability that they are ancestors (low, orange; high, purple; grey for other days) of day-4 ILC3-like cells. In the day −4 panel (right): day −4 ILC3-like, blue; day −4 not-ILC3-like, orange; cells from days 0–3, grey. bf, Multiple simultaneous inferred trajectories leading to ILC3-like cells. b, FDL embedding (as in a) of cells coloured by pseudotime (early, cyan; late, fuchsia) if they are part of the inferred trajectory (other cells in grey) for (left to right): quiescent-to-ILC3-like, ILC2-to-ILC3-like, cloud-to-ILC3-like, and ILC2-to-quiescent-like trajectories. Arrows indicate trajectory directions; dashed arrow indicates secondary, sparse ILC2-to-ILC3-like trajectory. cf, For the quiescent-to-ILC3-like trajectory: FDL embedding (as in a) with cells in the trajectory highlighted in blue for each day (panel title, all other cells in grey), (c), and heatmap of co-expression (top) and normalized expression (bottom) of trajectory-associated genes (rows) in cells (columns) ordered by pseudotime (color bar, top) (d). Analogous plots are shown for the ILC2-to-ILC3-like trajectory (e, f).. Expression of Cre reports Il5 activity.
Fig. 3
Fig. 3. Skin ILCs from naive mice have ILC2 and ILC3-like potential.
ac, Accessible chromatin at ILC2- and ILC3-related loci, assayed by scATAC-seq. Uniform Manifold Approximation and Projection (UMAP) embedding of profiles (dots) coloured by treatment condition (day-0 untreated, green; day −4 IL-23 induced, pink) (a) or accessibility in untreated (top) or IL-23-induced (bottom) mice of ILC-associated gene loci (activity scores) (b) and transcription factor binding sites (per-cell motif activity scores; Methods) (c). JASPAR motif IDs are shown in parentheses. d, e, KLF2-producing ILCs become ILC3-like cells in vitro. d, Representative fluorescence-activated cell sorting (FACS) profiles of KLF2-GFP+ CD3 T cells and skin ILCs from KLF2GFP(tg/tg) mice, and GFP+ skin ILCs from wild-type control mice. Cells are pre-gated as live CD45+linIL7Rα+ ILCs. e, Numbers (leftmost panel) of KLF2GFP+ or KLF2GFP− skin ILCs cultured in control (ctrl) or ILC3-inducing (ILC3 cond.) conditions, and percentages (right three panels) of these cells producing IL-5, IL-17 or both IL-5 and IL-17, by intracellular staining after 2.5 h of stimulation with phorbol 12-myristate 13-acetate (PMA) and ionomycin (n = 4 wells (control), n = 12 wells (GFP+) and n = 11 wells (GFP); 3 independent experiments). Error bars are mean ± s.d.; P values determined by unpaired, two-tailed t-test. f, g, In vivo validation of ILC2-to-ILC3-like trajectories. f, Possible reporter outcomes for ILC3-like cells with (top) or without (bottom) an ILC2-to-ILC3 transition, using an IL-5 fate IL-17AGFP IL-22BFP reporter mouse. g, Numbers of cells producing IL-5, IL-22 and IL-17A, including among cells previously producing IL-5 (exIL-5, YFP+), with and without IL-23 primary and secondary treatments (n = 5 mice (PBS control), n = 8 mice (IL-23); 2 independent experiments). Error bars are mean ± s.d.; P values determined by two-way ANOVA.

References

    1. Vivier E et al. Innate lymphoid cells: 10 years on. Cell 174, 1054–1066 (2018). - PubMed
    1. Spencer SP et al. Adaptation of innate lymphoid cells to a micronutrient deficiency promotes type 2 barrier immunity. Science 343, 432–437 (2014). - PMC - PubMed
    1. Roediger B et al. Cutaneous immunosurveillance and regulation of inflammation by group 2 innate lymphoid cells. Nat. Immunol 14, 564–573 (2013). - PMC - PubMed
    1. Teunissen MBM et al. Composition of innate lymphoid cell subsets in the human skin: enrichment of NCR+ ILC3 in lesional skin and blood of psoriasis patients. J. Invest. Dermatol. 134, 2351–2360 (2014). - PubMed
    1. Villanova F et al. Characterization of innate lymphoid cells in human skin and blood demonstrates increase of NKp44+ ILC3 in psoriasis. J. Invest. Dermatol 134, 984–991 (2014). - PMC - PubMed

Publication types

MeSH terms