. 2021 May;126(5):790-804.
doi: 10.1038/s41437-021-00409-w. Epub 2021 Feb 3.

Ecological adaptation drives wood frog population divergence in life history traits

Affiliations

Ecological adaptation drives wood frog population divergence in life history traits

Emily H Le Sage et al. Heredity (Edinb). 2021 May.

Abstract

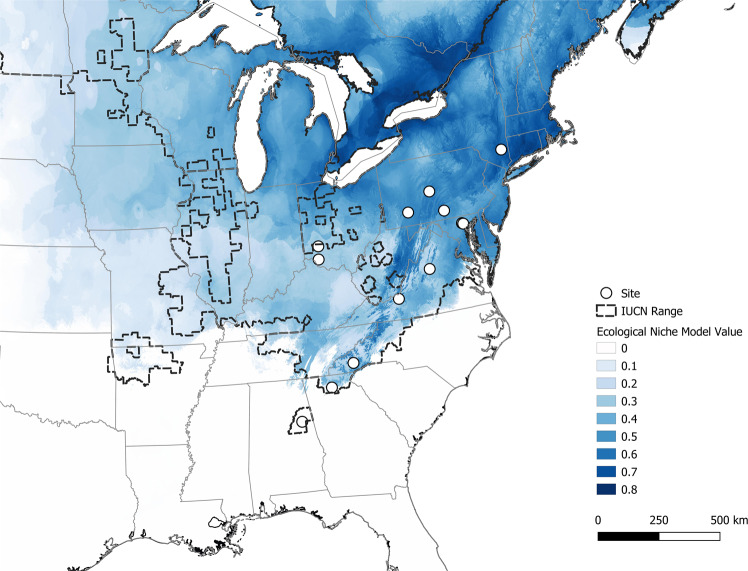
Phenotypic variation among populations is thought to be generated from spatial heterogeneity in environments that exert selection pressures that overcome the effects of gene flow and genetic drift. Here, we tested for evidence of isolation by distance or by ecology (i.e., ecological adaptation) to generate variation in early life history traits and phenotypic plasticity among 13 wood frog populations spanning 1200 km and 7° latitude. We conducted a common garden experiment and related trait variation to an ecological gradient derived from an ecological niche model (ENM) validated to account for population density variation. Shorter larval periods, smaller body weight, and relative leg lengths were exhibited by populations with colder mean annual temperatures, greater precipitation, and less seasonality in precipitation and higher population density (high-suitability ENM values). After accounting for neutral genetic variation, the QST-FST analysis supported ecological selection as the key process generating population divergence. Further, the relationship between ecology and traits was dependent upon larval density. Specifically, high-suitability/high-density populations in the northern part of the range were better at coping with greater conspecific competition, evidenced by greater postmetamorphic survival and no difference in body weight when reared under stressful conditions of high larval density. Our results support that both climate and competition selection pressures drive clinal variation in larval and metamorphic traits in this species. Range-wide studies like this one are essential for accurate predictions of population's responses to ongoing ecological change.


Conflict of interest statement

The authors declare that they have no conflict of interest.

Figures

Fig. 1
Fig. 1. Localities for populations reared in the common garden experiment (open circles; N = 13) across the eastern clade range of the wood frog.
Ecological suitability values are represented as a color gradient with darker shades representing higher suitability values. IUCN range limits for wood frogs are represented by a dashed line. See Table S1 in Supplemental Materials for specific geographic locations of each site.
Fig. 2
Fig. 2. Relationships between larval and metamorphic traits of wood frogs reared at low-density (filled points) and high-density (open points) in common garden conditions and ecological suitability of the natal pond derived from an ecological niche model (ENM).
The fitted partial regression means, adjusted for covariance in average temperature by ENM values for the natal pond for each trait (13 and 12 populations with 47–86 and 5–24 frogs/population in low-density and high-density, respectively). Diagonal lines (solid and dashed for low-density and high-density, respectively) and shading indicate linear regressions and 95% confidence intervals (shaded area).
Fig. 3
Fig. 3. Wood frog populations exhibit local adaptation in larval and metamorphic traits expressed in common garden conditions.
Histograms of simulated QST–FST distributions for each trait represent the null hypothesis of neutral variation, while the arrow indicates observed global QST–FST values for each trait. Only low-density treatment shown, but high-density individuals show the same trends for each trait.
Fig. 4
Fig. 4. Phenotypic variance in weight, femur–SVL ratio, and time to metamorphosis appears driven by natural selection from ecological forces rather than isolation by distance when wood frogs are reared at low-density but not high-density, whereas variation in larval growth rate appears conserved across populations.
Points are pairwise QST–FST values, calculated using fitted partial regression means adjusted for covariance in average temperature, and lines represent linear regressions, compared at low-density (filled points, solid lines) and high-density (open points, dashed lines). Red horizontal lines indicate at or below which phenotypic variance is not due to natural selection (QST = FST).

Similar articles

References

    1. Adams DC, Church JO. Amphibians do not follow Bergmann’s rule. Evol: Int J Org Evol. 2008;62(2):413–420. doi: 10.1111/j.1558-5646.2007.00297.x. - DOI - PubMed
    1. Alho J, Herczeg G, Laugen A, Räsänen K, Laurila A, Merilä J. Allen’s rule revisited: quantitative genetics of extremity length in the common frog along a latitudinal gradient. J Evol Biol. 2011;24(1):59–70. doi: 10.1111/j.1420-9101.2010.02141.x. - DOI - PubMed
    1. Allen JA. The influence of physical conditions in the genesis of species. Radic Rev. 1877;1:108–140.
    1. Amado TF, Bidau CJ, Olalla-Tárraga MÁ. Geographic variation of body size in New World anurans: energy and water in a balance. Ecography. 2019;42(3):456–466. doi: 10.1111/ecog.03889. - DOI
    1. Ashton KG. Do amphibians follow Bergmann’s rule? Can J Zool. 2002;80(4):708–716. doi: 10.1139/z02-049. - DOI

Publication types

LinkOut - more resources