

Particle size analysis of pristine food-grade titanium dioxide and E 171 in confectionery products: Interlaboratory testing of a single-particle inductively coupled plasma mass spectrometry screening method and confirmation with transmission electron microscopy
- PMID: 33536722
- PMCID: PMC7730118
- DOI: 10.1016/j.foodcont.2020.107550
Particle size analysis of pristine food-grade titanium dioxide and E 171 in confectionery products: Interlaboratory testing of a single-particle inductively coupled plasma mass spectrometry screening method and confirmation with transmission electron microscopy
Abstract
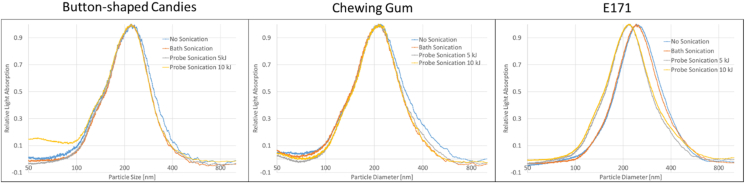
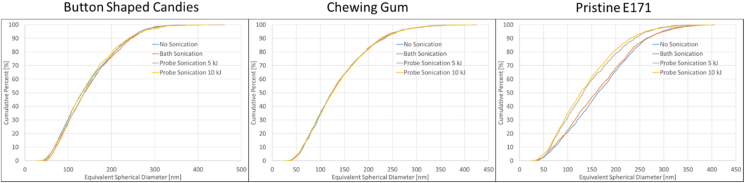
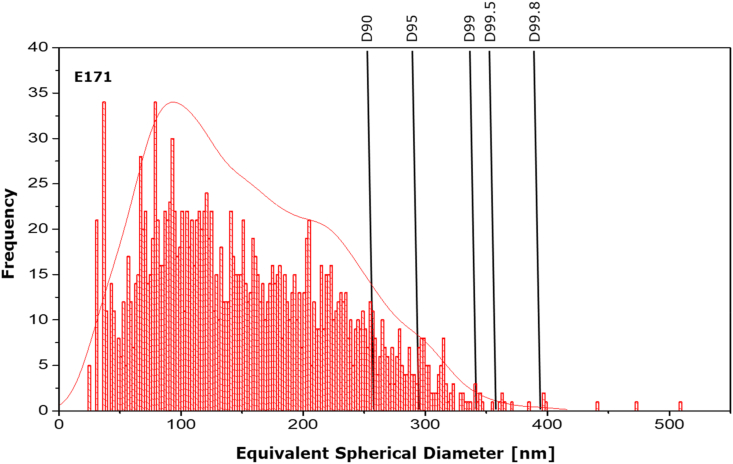
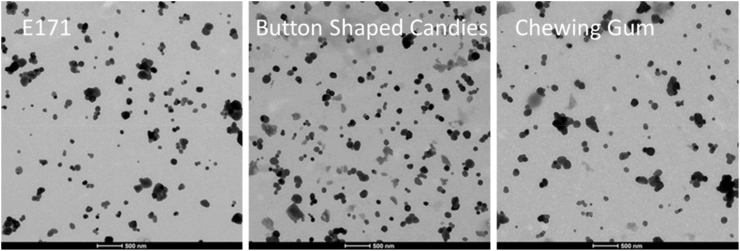
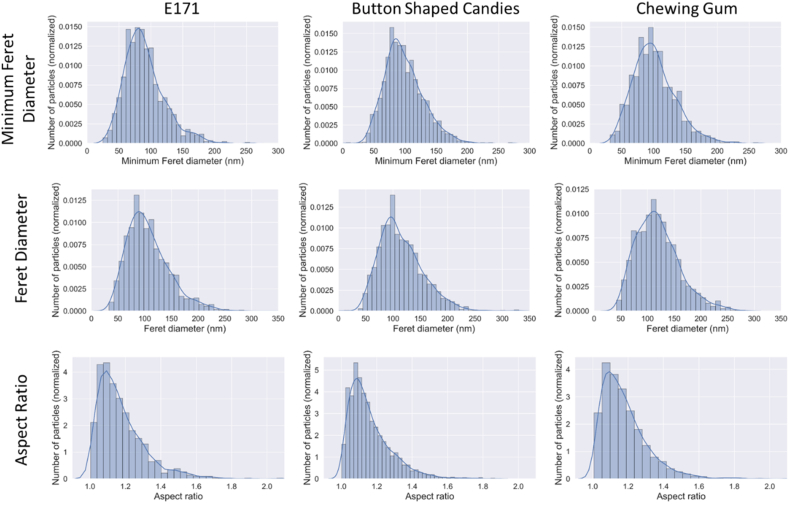
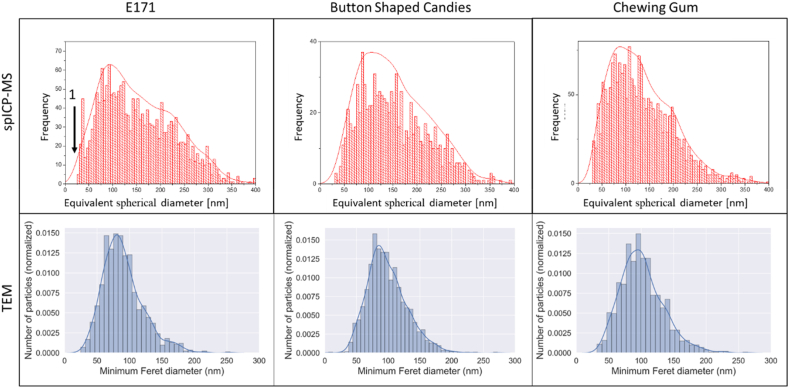
Titanium dioxide is a white colourant authorised as food additive E 171 in the EU, where it is used in a range of alimentary products. As these materials may contain a fraction of particulates with sizes below 100 nm and current EU regulation requires specific labelling of food ingredient to indicate the presence of engineered nanomaterials there is now a need for standardised and validated methods to appropriately size and quantify (nano)particles in food matrices. A single-particle inductively coupled plasma mass spectrometry (spICP-MS) screening method for the determination of the size distribution and concentration of titanium dioxide particles in sugar-coated confectionery and pristine food-grade titanium dioxide was developed. Special emphasis was placed on the sample preparation procedure, crucial to reproducibly disperse the particles before analysis. The transferability of this method was tested in an interlaboratory comparison study among seven experienced European food control and food research laboratories equipped with various ICP-MS instruments and using different software packages. The assessed measurands included the particle mean diameter, the most frequent diameter, the percentage of particles (in number) with a diameter below 100 nm, the particles' number concentration and a number of cumulative particle size distribution parameters (D0, D10, D50, D99.5, D99.8 and D100). The evaluated method's performance characteristics were, the within-laboratory precision, expressed as the relative repeatability standard deviation (RSDr), and the between-laboratory precision, expressed as the relative reproducibility standard deviation (RSDR). Transmission electron microscopy (TEM) was used as a confirmatory technique and served as the basis for bias estimation. The optimisation of the sample preparation step showed that when this protocol was applied to the relatively simple sample food matrices used in this study, bath sonication turned out to be sufficient to reach the highest, achievable degree of dispersed constituent particles. For the pristine material, probe sonication was required. Repeatability and reproducibility were below 10% and 25% respectively for most measurands except for the lower (D0) and the upper (D100) bound of the particle size distribution and the particle number concentration. The broader distribution of the lower and the upper bounds could be attributed to instrument-specific settings/setups (e.g. the timing parameters, the transport efficiency, type of mass-spectrometer) and software-specific data treatment algorithms. Differences in the upper bound were identified as being due to the non-harmonised application of the upper counting limit. Reporting D99.5 or D99.8 instead of the effectively largest particle diameter (D100) excluded isolated large particles and considerably improved the reproducibility. The particle number-concentration was found to be influenced by small differences in the sample preparation procedure. The comparison of these results with those obtained using electron microscopy showed that the mean and median particle diameter was, in all cases, higher when using spICP-MS. The main reason for this was the higher size detection limit for spICP-MS plus the fact that some of the analysed particles remained agglomerated/aggregated after sonication. Single particle ICP-MS is a powerful screening technique, which in many cases provides sufficient evidence to confirm the need to label a food product as containing (engineered) titanium dioxide nanomaterial according to the current EU regulatory requirements. The overall positive outcome of the method performance evaluation and the current lack of alternative standardised procedures, would indicate this method as being a promising candidate for a full validation study.
Keywords: Confectionery; E 171; Food-grade titanium dioxide; Single-particle ICP-MS; Validation.
© 2020 The Authors.
Figures
References
-
- Abad-Álvaro I., Peña-Vázquez E., Bolea E., Bermejo-Barrera P., Castillo J.R., Laborda F. Evaluation of number concentration quantification by single-particle inductively coupled plasma mass spectrometry: Microsecond vs. millisecond dwell times. Analytical and Bioanalytical Chemistry. 2016;408(19):5089–5097. doi: 10.1007/s00216-016-9515-y. - DOI - PubMed
-
- Bucher G., Auger F. Combination of 47Ti and 48Ti for the determination of highly polydisperse TiO2 particle size distributions by spICP-MS. Journal of Analytical Atomic Spectrometry. 2019;34(7):1380–1386. doi: 10.1039/c9ja00101h. - DOI
LinkOut - more resources
Full Text Sources
Other Literature Sources
Research Materials