. 2021 Jan 11:14:609316.
doi: 10.3389/fnsys.2020.609316. eCollection 2020.

Neural Networks With Motivation

Affiliations

Neural Networks With Motivation

Sergey A Shuvaev et al. Front Syst Neurosci. .

Abstract

Animals rely on internal motivational states to make decisions. The role of motivational salience in decision making is in early stages of mathematical understanding. Here, we propose a reinforcement learning framework that relies on neural networks to learn optimal ongoing behavior for dynamically changing motivation values. First, we show that neural networks implementing Q-learning with motivational salience can navigate in environment with dynamic rewards without adjustments in synaptic strengths when the needs of an agent shift. In this setting, our networks may display elements of addictive behaviors. Second, we use a similar framework in hierarchical manager-agent system to implement a reinforcement learning algorithm with motivation that both infers motivational states and behaves. Finally, we show that, when trained in the Pavlovian conditioning setting, the responses of the neurons in our model resemble previously published neuronal recordings in the ventral pallidum, a basal ganglia structure involved in motivated behaviors. We conclude that motivation allows Q-learning networks to quickly adapt their behavior to conditions when expected reward is modulated by agent's dynamic needs. Our approach addresses the algorithmic rationale of motivation and makes a step toward better interpretability of behavioral data via inference of motivational dynamics in the brain.

Keywords: addiction; artificial intelligence; hierarchical reinforcement learning; machine learning; motivational salience; reinforcement learning.


Conflict of interest statement

The authors declare that the research was conducted in the absence of any commercial or financial relationships that could be construed as a potential conflict of interest.

Figures
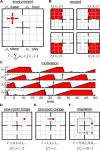
FIGURE 1
FIGURE 1
The Four Demands task. (A) An agent inhabits a 6 × 6 environment separated into four rooms. Each room is associated with its own reward and motivation (water, food, sleep, and play). (B) Components of physical reward values (color coded: red = 1, white = 0). The subjective reward value is a scalar product between the motivation vector and the physical reward value vector as illustrated. (C) Possible components of the 4D motivation vector as functions of time. Arrows indicate some of the transitions between the rooms. When the agent enters a room, its motivation is reset to zero. When the agent does not receive a non-zero perceived reward available in the room, the motivation increases by 1 at each time step until saturation at θ. (D–F) Potential strategies in our model: one-room binge (D), two-room binge (E), and migration (F).
FIGURE 2
FIGURE 2
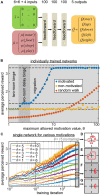
(A) The architecture of the 3-layer fully connected network computing the Q-function Q(a|s,μ). (B) The average subjective reward rate received by the network trained with maximum allowed motivation value θ (blue circles – motivation is provided as an input to the network; yellow – motivation affects the reward as usual, but is not provided to the network; orange – random walk). The regions of θ corresponding to different optimal strategies, learned by the motivated agent, are shown by different gray areas in the plot. These areas represent the phase diagram of the optimal behaviors displayed by the motivated agent. The dashed lines indicate the expected subjective reward values associated with these strategies: top – migration; middle – two-room delay binge; bottom – two-room binge. For small/large values of θ, the motivated network displays two-room binge/migration behaviors, respectively. Under the same conditions, the non-motivated network mostly displays two-room binge behavior. (C) A single network trained in minibatches for various values of θ, which in this case was a separate, 41st input to the network. Different curves correspond to different values of θ. For θ = 4..10/θ = 2,3/θ = 1, the model exhibits the migration/two-room delay binge/two-room binge strategies depicted in (E–G) respectively (dot with the circle denotes staying at the same location one extra step). (D) For the novel input θ = 15 that was not used in training, the model displays a new strategy, delayed migration.
FIGURE 3
FIGURE 3
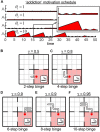
Addiction model. (A) Motivation schedule for model of addiction. In the first three rooms, motivations are allowed to grow up to the value of θ = 1. In the fourth (“smoking”) room, the motivation may grow to the value of θ = 10. (B–F) Strategies learned by the network for various values of the discounting factor γ, defining the relative values of the future rewards. Intermediate value of γ = 0.9 yields different behaviors (D,E).
FIGURE 4
FIGURE 4
The transport network. An agent (black dot) navigates in a network of roads connecting the cities – each associated with its own binary motivation. The subjective reward value is equal to the value of the motivation vector μ at the position of the agent, less the distance traveled. When the agent visits a city with non-zero motivation (red circle), the motivation toward this city is reset to zero. The task continues until μ=0. (A–D) The steps of the agent through the network (black arrows), the corresponding motivation vectors, and subjective reward values.
FIGURE 5
FIGURE 5
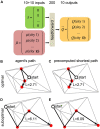
Training a neural network to find the shortest route to visit a subset of target cities using the motivation framework. (A) In this example, the total number of cities is N = 10, and the number of target cities to visit is m = 3. The neural network receives the agent’s position and motivation vectors as inputs and computes the Q-values for all available actions. (B,C) The trained agent (B) took the correct shortest path solution (C). This scenario accounts for 82% of the test examples. (D,E) The trained agent (D) took a different route than the shortest path solution (E). This scenario accounts for 18% of the test examples.
FIGURE 6
FIGURE 6
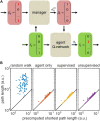
(A) Hierarchical reinforcement learning (HRL) setting for the transport network example. Bottom row: the agent Q-network receives current state (position) and motivation, and then computes the Q-values for transitioning to the other states (positions). Top row: the manager that makes changes in motivation. The manager can be represented by a hardcoded set of rules (random walk/agent-only simulation), or a Q-network (supervised/unsupervised simulations). (B) Performance of four representative models on 100 test runs trained in the same network: actual path lengths versus precomputed shortest path solutions. In the agent only simulation, the agent is supplied with the accurate motivation, whereas in hierarchical models (supervised/unsupervised), the motivation vector is computed by the manager network. The diagonal: identity line.
FIGURE 7
FIGURE 7
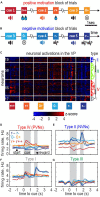
Ventral pallidum responses in the classical conditioning task with motivation. (A,B) A behavioral task for the recording. Trials were separated into blocks during which only rewards (water drops) or only punishment (air puffs) were delivered thus providing positive or negative motivation. (C) Responses of the VP neurons recorded in 3 mice clustered into the negative motivation neurons, positive motivation neurons, and neurons of mixed sensitivity. Dendrogram shows hierarchical clustering (see section “Materials and Methods”). (D–G) Average firing rates of the neurons in each cluster [cell type names follow Stephenson-Jones et al. (2020)]. (D) Positive valency neurons (PVNs) elevate their firing rate in reward condition in proportion with the reward magnitude; the baseline firing rate in PVNs in reward conditions is higher than in punishment conditions. (E) Negative valency neurons (NVNs) show the opposite trend. (F,G) Mixed sensitivity neurons (type I and type III) do not distinguish reward and punishment conditions.
FIGURE 8
FIGURE 8
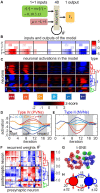
Recurrent neural network with motivation in the classical conditioning task. (A) The architecture of the RNN computing the V-function in this task. (B) Inputs and outputs of the RNN for each trial type. Inputs: motivation μ, cue s, subjective reward value r~. Outputs: V-function. Bottom row: the precomputed correct V-function V. Trial types (left to right): strong reward, weak reward, no reward, no punishment, weak punishment, strong punishment. (C) Responses of neurons in the RNN can be clustered into the positive motivation (red), negative motivation (blue), and neurons of mixed sensitivity (green). Dendrogram shows hierarchical clustering (see section “Materials and Methods”). (D,E) Average activities of the neurons in red and blue clusters in the model resemble those of PVNs and NVNs recorded in the VP. (F) Recurrent connectivity matrix. (G) t-SNE embedding of the RNN neurons based on their weights (spatial arrangement) corresponds to their clustering by the activity (red/blue/green color as in the panels C,F). (H) The push-pull circuit – a schematic representation of the recurrent connectivity in the model (annotated with the mean weights and the corresponding standard errors of mean; SEMs).

References

    1. Andrychowicz M., Wolski F., Ray A., Schneider J., Fong R., Welinder P., et al. (2017). Hindsight experience replay. Adv. Neural Inform. Process. Syst. 30 5048–5058.
    1. Bacon P. L., Precup D. (2018). Constructing temporal abstractions autonomously in reinforcement learning. Ai Magaz. 39 39–50. 10.1609/aimag.v39i1.2780 - DOI
    1. Berridge K. C. (1996). Food reward: brain substrates of wanting and liking. Neurosci. Biobehav. Rev. 20 1–25. 10.1016/0149-7634(95)00033-b - DOI - PubMed
    1. Berridge K. C. (2012). From prediction error to incentive salience: mesolimbic computation of reward motivation. Eur. J. Neurosci. 35 1124–1143. 10.1111/j.1460-9568.2012.07990.x - DOI - PMC - PubMed
    1. Berridge K. C., Robinson T. E. (2016). Liking, wanting, and the incentive-sensitization theory of addiction. Am. Psychol. 71 670–679. 10.1037/amp0000059 - DOI - PMC - PubMed

LinkOut - more resources