. 2021 Feb:64:102305.
doi: 10.1016/j.bspc.2020.102305.

A Method to Minimise the Impact of ECG Marker Inaccuracies on the Spatial QRS-T angle: Evaluation on 1,512 Manually Annotated ECGs

Affiliations

A Method to Minimise the Impact of ECG Marker Inaccuracies on the Spatial QRS-T angle: Evaluation on 1,512 Manually Annotated ECGs

William J Young et al. Biomed Signal Process Control. 2021 Feb.

Abstract

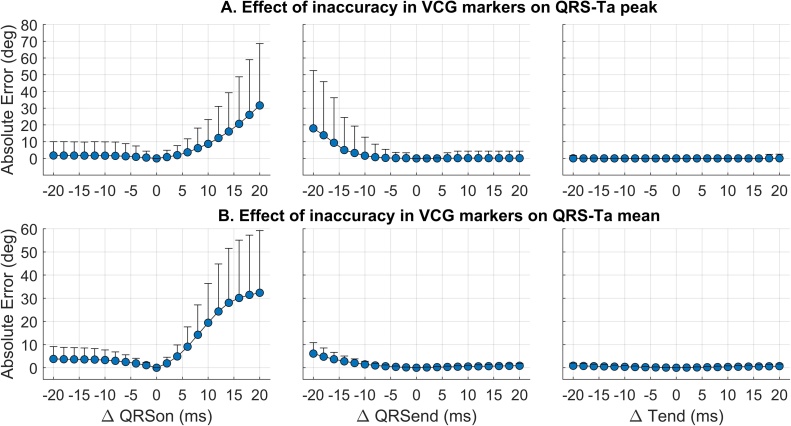
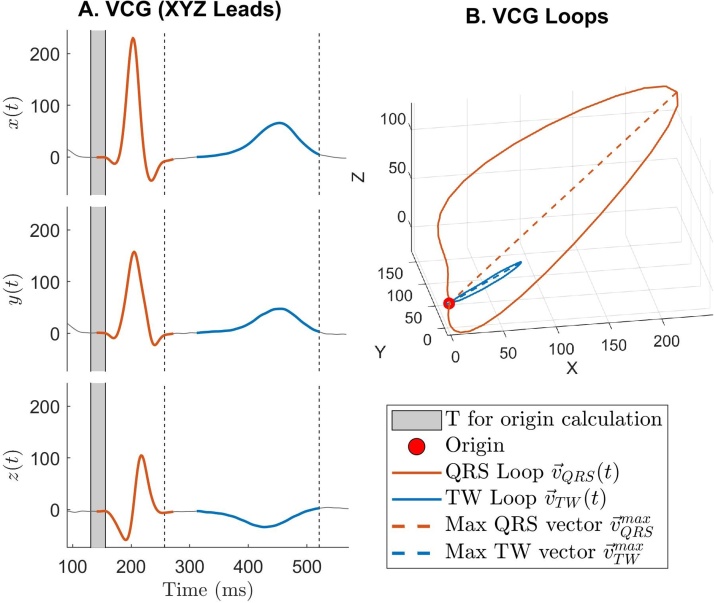
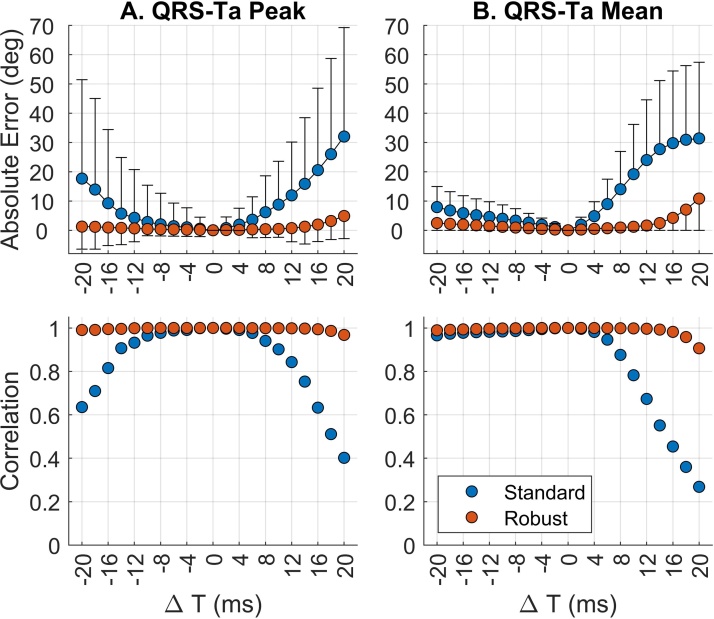
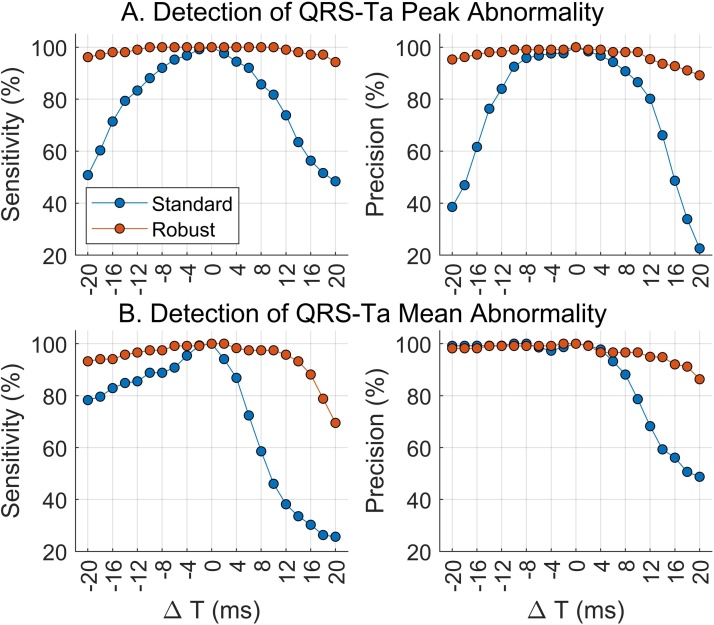
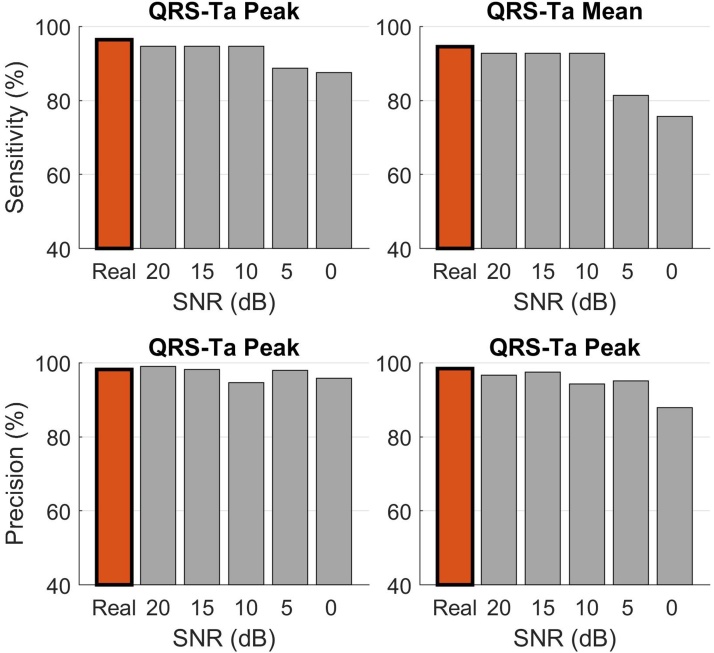
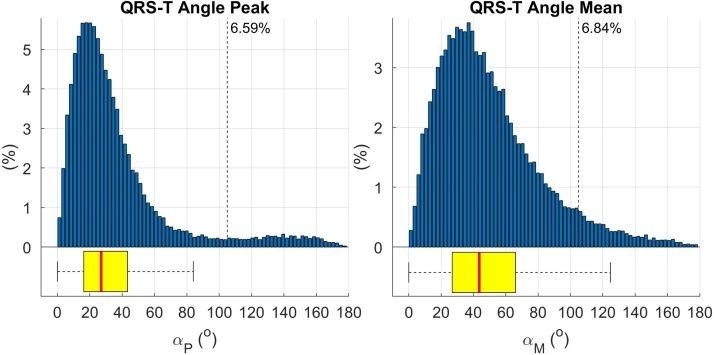
The spatial QRS-T angle (QRS-Ta) derived from the vectorcardiogram (VCG) is a strong risk predictor for ventricular arrhythmia and sudden cardiac death with potential use for mass screening. Accurate QRS-Ta estimation in the presence of ECG delineation errors is crucial for its deployment as a prognostic test. Our study assessed the effect of inaccurate QRS and T-wave marker placement on QRS-Ta estimation and proposes a robust method for its calculation. Reference QRS-Ta measurements were derived from 1,512 VCGs manually annotated by three expert reviewers. We systematically changed onset and offset timings of QRS and T-wave markers to simulate inaccurate placement. The QRS-Ta was recalculated using a standard approach and our proposed algorithm, which limits the impact of VCG marker inaccuracies by defining the vector origin as an interval preceding QRS-onset and redefines the beginning and end of QRS and T-wave loops. Using the standard approach, mean absolute errors (MAE) in peak QRS-Ta were >40% and sensitivity and precision in the detection of abnormality (>105°) were <80% and <65% respectively, when QRS-onset was delayed or QRS-offset anticipated >15 ms. Using our proposed algorithm, MAE for peak QRS-Ta were reduced to <4% and sensitivity and precision of abnormality were >94% for inaccuracies up to ±15 ms. Similar results were obtained for mean QRS-Ta. In conclusion, inaccuracies of QRS and T-wave markers can significantly influence the QRS-Ta. Our proposed algorithm provides robust QRS-Ta measurements in the presence of inaccurate VCG annotation, enabling its use in large datasets.

Keywords: Automatic analysis; Electrocardiogram; Population distribution; Spatial QRS-T angle; Vectorcardiogram.


Figures

Fig. 2
Fig. 2
Effect of systematically moving manually annotated reference VCG markers within ± 20 ms, on the estimation error of peak (A) and mean (B) QRS-Ta using the standard approach. Markers and bars represent the mean and standard deviation of the absolute error. From left to right, changes were made to QRSon, QRSend or Tend only.
Fig. 1
Fig. 1
QRS-T angle measurement using our proposed approach. A: X, Y and Z leads showing the QRS and T-wave in orange and blue, respectively. The solid grey block prior QRS complex represents the interval for the calculation of the vectors’ origin. B: VCG loops in the XYZ space. The red dot represents the vectors’ origin and the dashed lines the peak QRS and T-wave vectors.
Fig. 3
Fig. 3
Effect of moving all three reference VCG markers, on the estimation error of peak (A) and mean (B) QRS-T angles using standard (blue) and our proposed robust (red) approaches. Top two sub-plots: markers and bars represent the mean and standard deviation of the absolute error. Bottom two sub-plots: change in correlation coefficient between reference QRS-Ta (time point 0) and QRS-Ta calculated having systematically shifted the VCG marker. In this simulation, QRSon, QRSend and Tend were moved simultaneously in the same direction.
Fig. 4
Fig. 4
QRS-T angles for all 1,512 ECGs were measured using standard (blue) and robust(red) algorithms after systematically moving the manually annotated reference VCG markers in 2 ms steps until ± 20 ms. Sensitivity and precision of abnormal angle detection (αP or αM >105 deg) were assessed using standard (blue) and robust (red) algorithms after moving reference VCG markers in 2 ms steps. In this simulation, QRSon, QRSend and Tend were moved simultaneously in the same direction.
Fig. 5
Fig. 5
Effect of noise on the detection of abnormal QRS-T angle using the robust approach. QRS-T angles for all 1,512 ECGs were measured after white noise was added to the 10 sec ECG recordings and sensitivity and precision of abnormal angle detection (αP or αM >105 deg) were assessed for both peak (left) and mean (right) QRS-T angles.
Fig. 6
Fig. 6
Histogram showing peak and mean QRS-T angle distributions for 34,150 individuals with a 12-lead ECG recorded in the UK Biobank study. Vertical dotted line shows cut off for abnormality (> 105°).

Similar articles

Cited by

  • Genetic architecture of spatial electrical biomarkers for cardiac arrhythmia and relationship with cardiovascular disease.
    Young WJ, Haessler J, Benjamins JW, Repetto L, Yao J, Isaacs A, Harper AR, Ramirez J, Garnier S, van Duijvenboden S, Baldassari AR, Concas MP, Duong T, Foco L, Isaksen JL, Mei H, Noordam R, Nursyifa C, Richmond A, Santolalla ML, Sitlani CM, Soroush N, Thériault S, Trompet S, Aeschbacher S, Ahmadizar F, Alonso A, Brody JA, Campbell A, Correa A, Darbar D, De Luca A, Deleuze JF, Ellervik C, Fuchsberger C, Goel A, Grace C, Guo X, Hansen T, Heckbert SR, Jackson RD, Kors JA, Lima-Costa MF, Linneberg A, Macfarlane PW, Morrison AC, Navarro P, Porteous DJ, Pramstaller PP, Reiner AP, Risch L, Schotten U, Shen X, Sinagra G, Soliman EZ, Stoll M, Tarazona-Santos E, Tinker A, Trajanoska K, Villard E, Warren HR, Whitsel EA, Wiggins KL, Arking DE, Avery CL, Conen D, Girotto G, Grarup N, Hayward C, Jukema JW, Mook-Kanamori DO, Olesen MS, Padmanabhan S, Psaty BM, Pattaro C, Ribeiro ALP, Rotter JI, Stricker BH, van der Harst P, van Duijn CM, Verweij N, Wilson JG, Orini M, Charron P, Watkins H, Kooperberg C, Lin HJ, Wilson JF, Kanters JK, Sotoodehnia N, Mifsud B, Lambiase PD, Tereshchenko LG, Munroe PB. Young WJ, et al. Nat Commun. 2023 Mar 14;14(1):1411. doi: 10.1038/s41467-023-36997-w. Nat Commun. 2023. PMID: 36918541 Free PMC article.
  • Analysing electrocardiographic traits and predicting cardiac risk in UK biobank.
    Ramírez J, van Duijvenboden S, Young WJ, Orini M, Jones AR, Lambiase PD, Munroe PB, Tinker A. Ramírez J, et al. JRSM Cardiovasc Dis. 2021 Jun 12;10:20480040211023664. doi: 10.1177/20480040211023664. eCollection 2021 Jan-Dec. JRSM Cardiovasc Dis. 2021. PMID: 34211707 Free PMC article. Review.
  • Reproducibility of global electrical heterogeneity measurements on 12-lead ECG: The Multi-Ethnic Study of Atherosclerosis.
    Haq KT, Lutz KJ, Peters KK, Craig NE, Mitchell E, Desai AK, Stencel NWL, Soliman EZ, Lima JAC, Tereshchenko LG. Haq KT, et al. J Electrocardiol. 2021 Nov-Dec;69:96-104. doi: 10.1016/j.jelectrocard.2021.09.014. Epub 2021 Oct 2. J Electrocardiol. 2021. PMID: 34626835 Free PMC article.
  • Deep-Learning-Based Estimation of the Spatial QRS-T Angle from Reduced-Lead ECGs.
    Santos Rodrigues A, Augustauskas R, Lukoševičius M, Laguna P, Marozas V. Santos Rodrigues A, et al. Sensors (Basel). 2022 Jul 20;22(14):5414. doi: 10.3390/s22145414. Sensors (Basel). 2022. PMID: 35891094 Free PMC article.

References

    1. Oehler A., Feldman T., Henrikson C.A., Tereshchenko L.G. QRS-T angle: a review. Ann. Noninvasive Electrocardiol. 2014;19(November (6)):534–542. doi: 10.1111/anec.12206. - DOI - PMC - PubMed
    1. Waks J.W., Sitlani C.M., Soliman E.Z., Kabir M., Ghafoori E., Biggs M.L. Global electric heterogeneity risk score for prediction of sudden cardiac death in the general population: the Atherosclerosis Risk in Communities (ARIC) and Cardiovascular Health (CHS) Studies. Circulation. 2016;133(June (23)):2222–2234. doi: 10.1161/CIRCULATIONAHA.116.021306. - DOI - PMC - PubMed
    1. Kardys I., Kors J.A., van der Meer I.M., Hofman A., van der Kuip D.A.M., Witteman J.C.M. Spatial QRS-T angle predicts cardiac death in a general population. Eur. Heart J. 2003;24(July (14)):1357–1364. doi: 10.1016/s0195-668x(03)00203-3. - DOI - PubMed
    1. Zhang X., Zhu Q., Zhu L., Jiang H., Xie J., Huang W., Xu B. Spatial/frontal QRS-T angle predicts All-cause mortality and cardiac mortality: a meta-analysis. PLoS One. 2015;10(8):e0136174. doi: 10.1371/journal.pone.0136174. - DOI - PMC - PubMed
    1. Gleeson S., Liao Y., Dugo C., Cave A., Zhou L., Ayer Z. ECG-derived spatial QRS-T angle is associated with ICD implantation, mortality and heart failure admissions in patients with LV systolic dysfunction. PLoS One. 2017;12(3):e0171069. doi: 10.1371/journal.pone.0171069. - DOI - PMC - PubMed

LinkOut - more resources