

Chronic dietary exposure to inorganic arsenic
- PMID: 33537067
- PMCID: PMC7845508
- DOI: 10.2903/j.efsa.2021.6380
Chronic dietary exposure to inorganic arsenic
Abstract
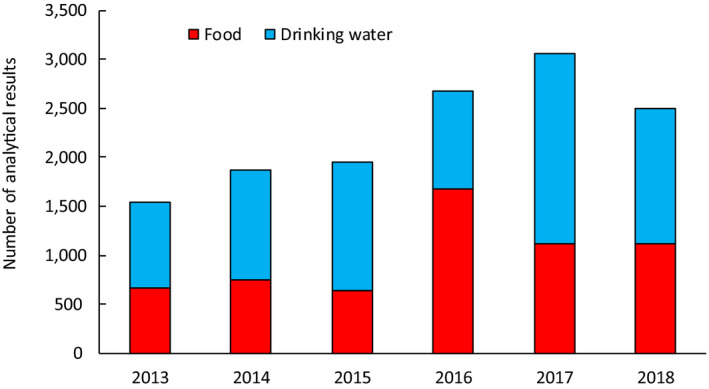
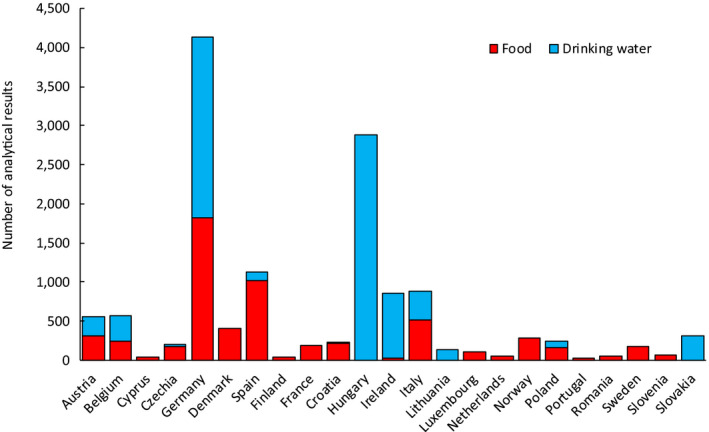
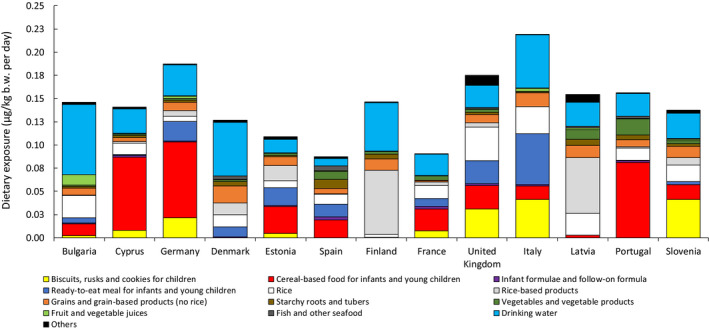
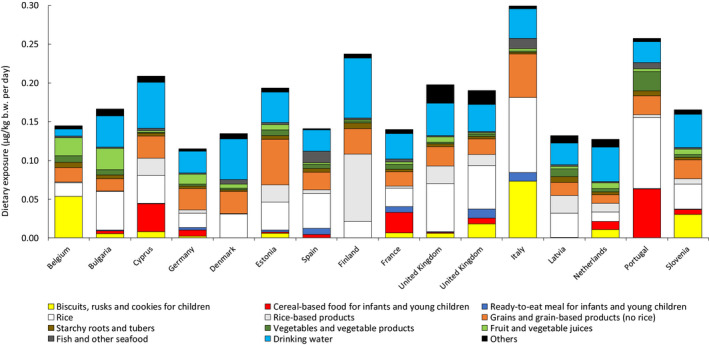
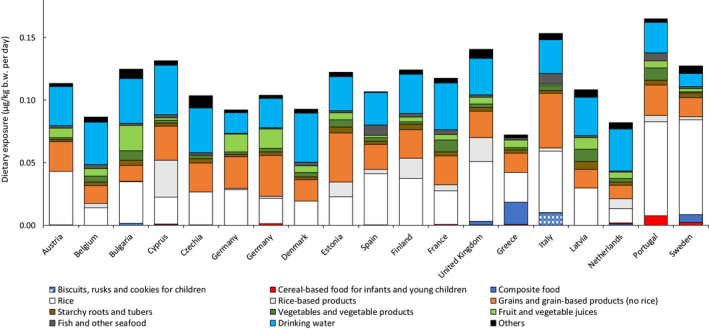
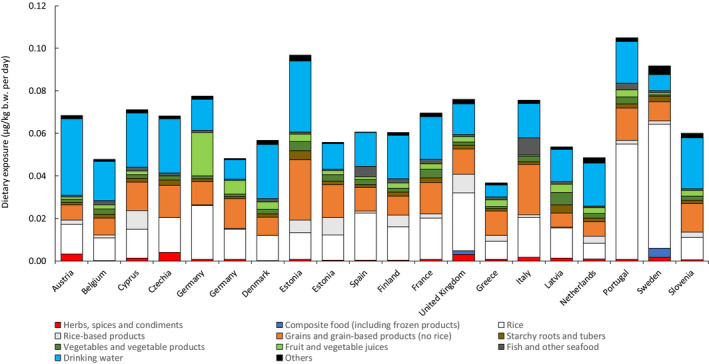
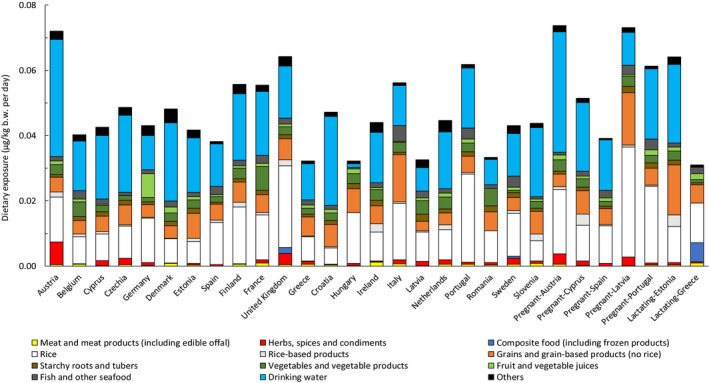
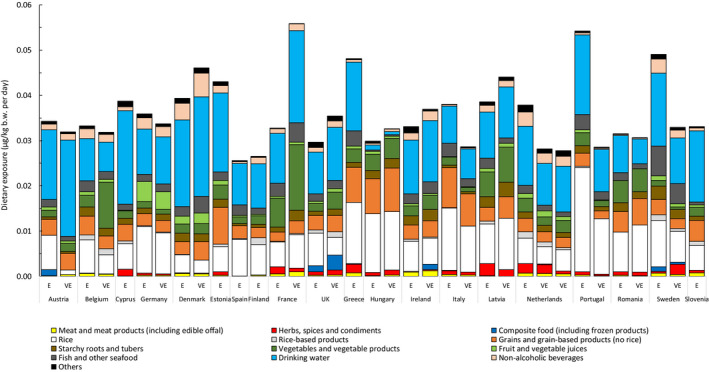
Following an official request to EFSA from the European Commission, EFSA assessed the chronic dietary exposure to inorganic arsenic (iAs) in the European population. A total of 13,608 analytical results on iAs were considered in the current assessment (7,623 corresponding to drinking water and 5,985 to different types of food). Samples were collected across Europe between 2013 and 2018. The highest mean dietary exposure estimates at the lower bound (LB) were in toddlers (0.30 μg/kg body weight (bw) per day), and in both infants and toddlers (0.61 μg/kg bw per day) at the upper bound (UB). At the 95th percentile, the highest exposure estimates (LB-UB) were 0.58 and 1.20 μg/kg bw per day in toddlers and infants, respectively. In general, UB estimates were two to three times higher than LB estimates. The mean dietary exposure estimates (LB) were overall below the range of benchmark dose lower confidence limit (BMDL 01) values of 0.3-8 μg/kg bw per day established by the EFSA Panel on Contaminants in the Food Chain in 2009. However, for the 95th percentile dietary exposure (LB), the maximum estimates for infants, toddlers and other children were within this range of BMDL 01 values. Across the different age classes, the main contributors to the dietary exposure to iAs (LB) were 'Rice', 'Rice-based products', 'Grains and grain-based products (no rice)' and 'Drinking water'. Different ad hoc exposure scenarios (e.g. consumption of rice-based formulae) showed dietary exposure estimates in average and for high consumers close to or within the range of BMDL 01 values. The main uncertainties associated with the dietary exposure estimations refer to the impact of using the substitution method to treat the left-censored data (LB-UB differences), to the lack of information (consumption and occurrence) on some iAs-containing ingredients in specific food groups, and to the effect of food preparation on the iAs levels. Recommendations were addressed to improve future dietary exposure assessments to iAs.
Keywords: dietary exposure assessment; drinking water; inorganic arsenic; rice; rice‐based commodities.
© 2021 European Food Safety Authority. EFSA Journal published by John Wiley and Sons Ltd on behalf of European Food Safety Authority.
Figures
References
-
- Al Amin MH, Xiong C, Francesconi KA, Itahashi Y, Yoneda M and Yoshinaga J, 2020. Variation in arsenolipid concentrations in seafood consumed in Japan. Chemosphere, 239, 124781. - PubMed
-
- Banerjee K, Helwick RP and Gupta S, 1999. A treatment process for removal of mixed inorganic and organic arsenic species from groundwater. Environmental Progress, 18, 280–284.
-
- Bocquet A, Dupont C, Chouraqui JP, Darmaun D, Feillet F, Frelut ML, Girardet JP, Hankard R, Lapillonne A, Rozé JC and Simeoni U, 2019. Efficacy and safety of hydrolyzed rice‐protein formulas for the treatment of cow's milk protein allergy. Archives de Pédiatrie, 26, 238–246. - PubMed
LinkOut - more resources
Full Text Sources
Other Literature Sources