. 2021 Jan 1;11(7):3074-3088.
doi: 10.7150/thno.53755. eCollection 2021.

Highly specific and label-free histological identification of microcrystals in fresh human gout tissues with stimulated Raman scattering

Affiliations

Highly specific and label-free histological identification of microcrystals in fresh human gout tissues with stimulated Raman scattering

Bohan Zhang et al. Theranostics. .

Abstract

Gout is a common metabolic disease with growing burden, caused by monosodium urate (MSU) microcrystal deposition. In situ and chemical-specific histological identification of MSU is crucial in the diagnosis and management of gout, yet it remains inaccessible for current histological methods. Methods: Stimulated Raman scattering (SRS) microscopy was utilized to image MSU based on its fingerprint Raman spectra. We first tested SRS for the diagnosis capability of gout and the differentiation power from pseudogout with rat models of acute gout arthritis, calcium pyrophosphate deposition disease (CPDD) and comorbidity. Then, human synovial fluid and surgical specimens (n=120) were were imaged with SRS to obtain the histopathology of MSU and collagen fibers. Finally, quantitative SRS analysis was performed in gout tissue of different physiological phases (n=120) to correlate with traditional histopathology including H&E and immunohistochemistry staining. Results: We demonstrated that SRS is capable of early diagnosis of gout, rapid detection of MSU in synovial fluid and fresh unprocessed surgical tissues, and accurate differentiation of gout from pseudogout in various pathophysiological conditions. Furthermore, quantitative SRS analysis revealed the optical characteristics of MSU deposition at different pathophysiological stages, which were found to matched well with corresponding immunofluorescence histochemistry features. Conclusion: Our work demonstrated the potential of SRS microscopy for rapid intraoperative diagnosis of gout and may facilitate future fundamental researches of MSU-based diseases.

Keywords: gout; label-free histology; monosodium urate; stimulated Raman scattering.


Conflict of interest statement

Competing Interests: The authors have declared that no competing interest exists.

Figures
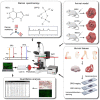
Figure 1
Figure 1
Schematics of the experimental design. Left top, spontaneous Raman characterization; Right top, acute GA rat models of MSU, CPDD and comorbidity for testing the capabilities of early diagnosis of gout and differentiation power from pseudogout; Right bottom, human surgical specimens were harvested from different locations; All specimens were imaged with SRS/SHG microscopy to obtain the distributions of MSU and collagen fibers; Left bottom, quantitative SRS analysis was performed to correlate with traditional histopathology including H&E and immunohistochemistry staining.
Figure 2
Figure 2
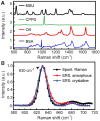
Spontaneous and stimulated Raman spectra of standard chemicals. (A) Spontaneous Raman spectra of MSU, CPPD, lipid (OA) and protein (BSA). (B) Raman and SRS spectra of crystalline and amorphous MSU samples.
Figure 3
Figure 3
Imaging and differentiation of crystalline and amorphous MSU with SRS and SHG microscopy. (A) on-resonance SRS image of MSU crystals at 630 cm-1; (B) off-resonance SRS image takend at 700 cm-1; (C) SHG image of the same crystals; (D-F) corresponding SRS and SHG images of amorphous MSU. Scale bar: 5 μm.
Figure 4
Figure 4
Differentiation of pseudogout and early detection of microcrystals in fresh tissues of rat models (3 days after injection) with multicolor SRS. (A) Depositions of MSU (green, 630 cm-1) surrounded by collagen (red, SHG) were shown in acute gout model (n = 3 rats). (B) Depositions of CPPD (blue, 1050 cm-1) were detected in the synovium protein (gray, 2930 cm-1) of CPPD model (n = 3 rats). (C) MSU and CPPD microcrystals were clearly distingruished in synovium tissues of combined model (n = 3 rats). (D-E) SRS spectra of MSU, bare tissue and CPPD. Scale bar: 20 μm.
Figure 5
Figure 5
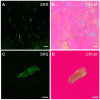
Detection of MSU in synovial fluid of GA patients. MSU microcrystals in the synovial fluid of patients with chronic gout arthritis imaged by (A) SRS and (B) CPLM. MSU crystal bows in synovial fluid imaged with (C) SRS and (D) CPLM. Scale bar:10 μm.
Figure 6
Figure 6
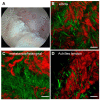
Rapid diagnosis on fresh human surgical tissues of GA patients. (A) Chalky tissues were harvested under arthroscopy. SRS images of unprocessed fresh tissues revealed intact MSU (green) depositions from (B) the elbow joint (n = 1), (C) the first metatarsophalangeal joint (n = 1) and (D) Achilles tendon (n = 1). Scale bar:10 μm.
Figure 7
Figure 7
Imaging thin frozen sections of human tissues. (A) Representative stiched large-scale SRS/SHG image and (B) H&E image of adjacent tissue sections, showing the distributions of MSU (green) and collagen fibers (red), with a typical granuloma-like structure (dashed circle). (C-D) Enlarged images of the dashed square area in (A-B). (E-F) A typical tophi structure containing an enveloped crystal core. Scale bar: 500 μm (A-B), 100 μm (C-F).
Figure 8
Figure 8
Evaluation of chronic gout tissues with SRS, H&E and immunofluorescence. (A) Tophus tissue of GA patients were sampled from three groups: center, 10 mm and 20 mm away from the center, with a large-scale SRS/SHG image (right) covering the rectangular area (left). (B) Representative images of SRS, H&E and immunofluorescence in the tissues (n = 120) to show the differences between the three groups. SRS/SHG images show MSU (green) and collagen fibers (red), while immunofluorescence images show cell nucleus (blue), IL-1β (green) and TNF-α (red). Scale bar: 500 μm (A), 50 μm (B).
Figure 9
Figure 9
Quantitative analysis of chronic tophi tissues from the three groups defined in Figure 8. (A) Area percentage of MSU in each FOV. (B) Mean SRS intensity of MSU (per pixel) in each FOV. (C) Cumulative intensity of MSU in each FOV. (D) Crystallization ratio of MSU in each FOV. N = 40 for each group, Kruskal-Wallis test followed by Dunn's multiple comparisons test, ****P < 0.0001. Data shown as mean ± s.e.m.
Figure 10
Figure 10
Correlation between SRS microscopy and immunofluorescence in corona zone. (A-C) Correlation between SRS intensity of MSU and IL-1β (n=40 for each group; Pearson r test was applied in group 1; Spearman r test was applied in group 2 and 3, R = 0.5396, 0.6737, 0.5239, respectively; P <0.05, calculated by two-sided t-test.). (D-F) Correlation between SRS intensity of MSU and TNF-α (n=40 for each group; Pearson r test was applied in group 1; Spearman r test was applied in group 2 and 3, R = 0.5451, 0.7233, 0.7284, respectively; P <0.05, calculated by two-sided t-test.).

Similar articles

Cited by

References

    1. Kuo CF, Grainge MJ, Zhang W, Doherty M. Global epidemiology of gout: prevalence, incidence and risk factors. Nat Rev Rheumatol. 2015;11:649–62. - PubMed
    1. Zhu Y, Pandya BJ, Choi HK. Prevalence of gout and hyperuricemia in the US general population: The national health and nutrition examination survey 2007-2008. Arthritis Rheum. 2011;63:3136–41. - PubMed
    1. Martillo MA, Nazzal L, Crittenden DB. The crystallization of monosodium urate. Curr Rheumatol Rep. 2014;16:400. - PMC - PubMed
    1. Kuo CF, Grainge MJ, Mallen C, Zhang W, Doherty M. Comorbidities in patients with gout prior to and following diagnosis: case-control study. Ann Rheum Dis. 2016;75:210–7. - PMC - PubMed
    1. Dalbeth N, Merriman TR, Stamp LK. Gout. Lancet. 2016;388:2039–52. - PubMed

Publication types